Copyright 0 1984 by the Genetics Society of America
RECOMBINATION AND ASSORTMENT IN T H E
MACRONUCLEUS OF
TETRAHYMENA
THERMOPHILA:
A
THEORETICAL STUDY BY COMPUTER SIMULATION
F. P. DOERDER AND S. L. DIBLASI
Department of Biology, Cleveland State University, Cleveland, Ohio 441 15 Manuscript received March 12, 1984
Revised copy accepted August 17, 1984
ABSTRACT
T h e compound nature of the macronucleus of Tetrahymena thermophila pre- sents multiple opportunities-fqr recombination between genes on the same macronuclear chromosome. Such rccQmbiaants should be detectable through their assortment at subsequent amitotic macronuclear divisions. Thus, a ma- cronucleus that is initially AB/ab should produce recombinant assortees of the genotypes Ab/aB. Computer simulation shows that, when the recombination frequency is two or fewer times per cell cycle, recombinant assortees are pro- duced at experimentally measurable frequencies of less than 40%. At higher recombination frequencies, linked genes appear to assort independently. T h e simulations also show that recombination during macronuclear development can be distinguished from recombination in subsequent cell cycles only if the first appearance of recombinant assortees is 100 or more fissions after conju- gation. T h e use of macronuclear recombination and assortment as a means of mapping macronuclear genes is severely constrained by the large variances in assortment outcomes; with experimentally small sample sizes, such mapping is impossible.
ECOMBINATION between linked genes is well documented in the diploid
R
micronucleus of the ciliate Tetrahymena thermophila (ALLEN 1964; DOER-DER 1973; McCoy 1977). Indeed, recombination is sufficiently frequent that
few of the 100 markers assigned to the N =
5
chromosomes by the method of nullisomics (BRUNS 1982) show linkage by standard testcross procedures. Recombination has also been suggested for macronuclear genes (ALLEN 1965; DOERDER 1973; ORIAS 1973), but to date no genetic map has been constructed. Mapping of macronuclear genes is important because, in its derivation from a micronucleus at conjugation, the macronucleus undergoes extensive genetic reorganization (reviewed by GOROVSKY 1980). T h e resulting macronuclear linkages will certainly be determined by molecular means, but a genetic tool is also available. In T . thermophila all known genes undergo macronuclear assortment, a stochastic process in which a heterozygous macronucleus gives rise through repeated division to macronuclei which express only one allele. Since macronuclear DNA molecules are sufficiently large so as to contain many genetic loci (MERKULOVA and BORCHSENIUS 1976; WILLIAMS et al. 1978; PREERand PREER 1979; YAO and YAO 1981), such linked genes should coassort. That
1036 F. P. DOERDER AND S. L. DIBLASI
is, in the absence of recombination, a double heterozygote, e.g., AB/ab, should produce only two classes of assortees, one AB and another ab. Were recombi- nation to occur, two additional classes, Ab and aB, are expected. T h e purpose of this paper is to provide a theoretical framework for the interpretation of coassortment experiments in which all four classes appear.
Only t w o suspected micronuclear linkages have been examined for coassort- ment in appropriate double heterozygotes (ALLEN 1965; DOERDER 1 9 7 3 ) . In both cases two recombinant classes of assortees, as well as the two parental classes, appeared in a 1 : l : l : l ratio. If indeed linked in both the micronucleus and macronucleus, either these genes are somatically recombined during ma- cronuclear development or division or, as a result of chromosome fragmenta- tion in development, these genes come to be on different macronuclear linkage groups so that they actually assort independently.
Multiple opportunities for recombination are present each cell cycle; early in the life cycle, the mean G2 DNA content is 128C, whereas later in the life cycle it is 9OC (DOERDER and DEBAULT 1 9 7 8 ) . Because macronuclear division is regularly unequal and because newly replicated subunits are randomly dis- tributed at division (ORIAS and FLACKS 1 9 7 5 ) , GI macronuclei derived from the same G2 macronucleus are normally genetically unequal. Thus, a G2 macro- nucleus with 50 AB and 4 0 ab units may divide into one GI nucleus with 2 2 AB and 2 2 ab units and another with 28 AB and 18 ab units. If in the 50AB:40ab macronucleus two units recombined, the G2 distribution would be 49AB:39ab: 1Ab: l a B . At division the distribution might be 22AB:22ab and 27AB: 17ab: 1Ab: l a B , where both recombinants go to the same macronucleus. Other distributions are also possible, and by subsequent rounds of replication, recombination and assortment, macronuclei consisting entirely of only one type of these units would be produced.
In this paper we have used computer simulation to answer three major questions. First, is it theoretically possible to detect macronuclear recombina- tion experimentally? That is, given the multiple opportunities for recombina- tion in the compound macronucleus, how much recombination must occur before linked genes appear to assort independently? Second, can recombination occurring during macronuclear development at conjugation be distinguished from recombination occurring in subsequent amitotic cycles? Third, can the frequencies of recombinant assortees provide sufficient information to deter- mine genetic distances and gene order?
This work has appeared in abstract form (DOERDER and DIBLASI 1 9 8 3 ) .
MATERIALS AND METHODS
The simulation program MACREC has been partially described elsewhere (DOERDER 1979; F.
MACRONUCLEAR RECOMBINATION 1037
initial subcloning, each subclone was serially recloned until all subclones were stable for one type o f assorting unit. In accordance with known life cycle variation in macronuclear DNA content (DOERDER and DEBAULT 1978), the GI mean number of assorting units was set at 6 4 for the first 50 fissions and at 45 after 100 fissions; between 50 and 100 fissions the mean was allowed to gradually (and randomly) decline.
MACREC is written in Fortran and was run on Cleveland State University’s IBM 370/158 computer with typical simulations requiring 5-9 min of central processor time.
RESULTS
Detection of macronuclear recombination: T h e compound nature of the macro- nucleus presents multiple opportunities for recombination. If, through prior recombination events, recombinant units are already present in a macronu- cleus, further recombination may produce one of three results, depending upon whether the recombining units are nonrecombinant (P1 or P2, parental) or recombinant (R1 or
R2,
nonparental). If the choice is P1 X P2, the result is two additional recombinant units, RI and R2. If the choice is R1 X R2, the result is two parental units, PI and P2. Because the genetic consequences of these two recombination events have phenotypic consequences, they are in a sense “visible.” If, on the other hand, the choice is R1 X P1, P1 X R2, P1 XP1 or any other combination of units, the resulting recombination, although scorable by the simulation program, is experimentally “invisible” because no net genetic, or phenotypic, change results.
In descendants of a single 32AB:32ab GI macronucleus, at some recombi- nation frequency the proportion of recombinant assortees will be equal to the proportion of nonrecombinant (parental) assortees. In other words, at some theoretical RCF the ratio of assortees at the completion of assortment will be
IAB: lab: 1Ab: laB, which is also the ratio expected when the starting macro- nucleus is 16AB: 16ab: 16Ab: 16aB. T o determine that theoretical RCF, we sim- ulated, at different RCFs, assortment experiments in which recombinant sub- units were produced in a starting macronucleus that contained equal numbers of nonrecombinant units (P1 and P2 only). T h e RCF was arbitrarily defined in terms of the cell cycle, such that a RCF of 1.0 meant that in each G2
macronucleus two randomly selected units were recombined. RCFs of less than
1.0 were treated stochastically; for example, RCF of 0.10 meant that recom- bination occurred in one of ten randomly selected macronuclei or, on the average, once every tenth cell cycle. (Deterministic vs. stochastic control of recombination events will be analyzed below.) T h e results of these simulations are shown in column A (32:32:0:0) of Tables 1 and 2. They are expressed both in terms of the mean appearance (fission) of the first recombinant assortee (Table 1 ) and of the proportion of recombinant assortees at the completion of assortment (Table 2). By either measure, at RCFs of 2.0 or less, the results are significantly different from those expected for a starting ratio of
16: 16: 16: 16.
T h e counts of visible (P1 X P2 and R1 X R2) and invisible recombination events were used to derive RCFs based on the number of subunits rather than per cell cycle. For example, in a typical simulation at RCF = 0.10, among the
1038 F. P. DOERDER AND S. L. DIBLASI TABLE 1
Relationship between recombination and appearance of j r s t recombinant assortee for three starting ratios of AB:ab:Ab:aB subunits
Appearance of first recombinant assortee (fissions)" (A)
32:32:0:0 31:31:1:1 (B) 30:30:2:2 (C) Recombination
events/cell cycle Mean SD ( N ) Mean SD ( N ) Mean SD ( N )
0 66 20.8 (7)b 63 12.7 (7)
0.10 83 21.2 (7) 79 17.9 (7)b 61 12.4 (7)
0.25 85 17.5 (7) 66 14.3 (7) 55 15.8 (7)
0.50 61 17.9 (7) 61 6.3 (7) 55 11.7 (7)
0.75 63 6.9 (7) 59 8.9 (7) 59 8.9 (7)
1 55 11.7 (7) 53 9.2 (9) 46 4.9 (7)
2 50 6.9 (7) 48 12.7 (9) 42 4.9 (7)
3 47 9.7 (8)
16:16: 16: 16 33 4.9 (7)
a Each mean represents N simulations each utilizing 500 subclones derived from a single cell.
These means are not significantly different. Actual values are RCF = 0: 70, 57, 83, 70, 31, 96, 57; RCF = 0.10: 96, 109, 70, 70, 51, 83, 70.
TABLE 2
Relationship between recombination and proportion of recombinant assortees at completion of assortment f i r three starting ratios of AB:ab:AbaB subunits
Final % recombinant assortees"
(C) 30:30:2:2 (B)
31:31:1:1 (A)
32:32:0:0 Recombination
events/cell cycle Mean SD Mean SD Mean SD
0 0.0
-
3.3 1.oo
6.1 1.660.10 6.3 1.63 9.4 2.01 11.5 2.31
0.25 12.5 1.44 15.5 3.06 15.9 2.40
0.50 19.5 3.27 20.7 2.67 25.7 2.96
0.75 26.9 2.88 25.2 3.33 27.6 2.85
1 30.1 3.48 29.6 3.10 32.1 1.92
2 39.5 2.13 43.3 2.93 44.8 3.85
3 51.8 4.30
16: 16: 16:16 49.4 2.16
a Each mean represents the same simulations shown in Table 1.
2090 visible crossover units. T h e probability that a subunit is of a crossover type is, therefore, 0.00170, and the probability that it is due to a visible crossover is 0.00051. A tabulation of these values is shown in Table 3. T h e frequency of visible crossover is, as expected, an inverse (nonlinear) function of the RCF; at RCFs of less than 0.10 (not shown) the visible crossovers approach 100% of all crossovers. At higher RCFs, therefore, a given subunit is likely to have participated in multiple recombination events.
MACRONUCLEAR RECOMBINATION
TABLE 3
Relationship between RCF and total and visible recombinant events
1039
~ ~ ~
Probability of % visible crossover" crossover/
RCF/cell cycle subunit" Mean SD
0.01 0.000176 34.3 2.13
0.10 0.00167 29.0 1.01
0.25 0.00426 23.7 0.92
0.50 0.00846 18.4 1.28
1 0.01702 13.2 0.43
2. 0.03404 9. 2 0.52
a Ratio of total recombinant units to total units in unassorted
'
Each mean represents the same simulations shown in Tables macronuclei.1 and 2.
not) is linear, with a slope of 0.0170. This value reflects the relative constancy of the number of subunits that participate in recombination. From the exam- ple, the 8,253,894 subunits were distributed among 70,452 unassorted macro- nuclei for a mean of 117 units/macronucleus. Among all of the simulations, the mean was 1 18. In a macronucleus with 118 units, if two recombine, the frequency of crossover units is 2/118 = 0.0169, which is the observed slope. Much of the recombination that produces visible crossover units, therefore, occurs early in the life cycle before the G2 mean DNA content has declined
to 9OC. This intuitively obvious conclusion is directly observable during the assortment process from the proportions of recombinant subunits. For exam-
ple, among seven simulations with an input of 32:32:0:0 at RCF = 1.0, at 57
fissions the mean number of GI units was 61.2 (SEM = 0.15) and the mean number of clones (out of 500) assorted to either R1 or R2 units was 1.4 (SEM
= 0.57). Among the macronuclei of the unassorted clones, the mean propor- tion of R1 and R2 units was 27.94% (SEM = 0.34). By 100 fissions, 40-60%
of clones were fully assorted for any one of the four types.
In the simulations shown in Tables 1 and 2 recombination was defined in terms of the cell cycle. At RCFs of less than 1.0 recombination was controlled stochastically; that is, if RCF = 0.10 and a random number was less than 0.10,
recombination occurred. However, at frequencies of 1 .O or more, recombina- tion was not controlled by random numbers; that is, if RCF = 2.0, two recom- bination events always occurred in each cell cycle. As shown in Tables 1 and
2 both of these modes of control resulted in considerable variance in assort- ment outcomes. Less deterministic modes of recombination control might be expected to alter these results. T o test this idea, simulations were performed in which random numbers were compared to cumulative frequencies of the Poisson distribution to determine the frequencies at which recombination would occur 0, 1, 2, 3 or more times per cell cycle (to calculate these fre- quencies, the Poisson mean was set equal to the desired RCF). For 32:32:0:0
1040 F. P. DOERDER AND S. L. DIBLASI
ance of the first recombinant assortee was 56 fissions (SD = 10.8, seven simu- lations); at RCF = 0.10, the mean was 90 (SD = 27.0, six simulations). Although the latter mean and variance are larger than the corresponding entries in Table 1, simulations at other RCF values showed no trend. Similarly, no significant differences or trends were observed in the final percent of recombinant assor- tees.
Recombination during macronuclear development: In the simulations discussed in the previous section, the macronuclei of the starting cells contained no recombinant units. However, recombination may also occur during the devel- opment of macronuclei prior to the first division. If in development two loci come to be on different fragments of micronuclear chromosomes, then, of course, the linkage is broken and the output ratio would be 1:1:1:1 assuming no differential replication of the fragments. Extensive recombination between genes at two loci on the same fragment could also result in this ratio. Assort- ment experiments can not distinguish between these two possibilities. However, if recombination during development is very rare, then it may be possible to distinguish it from recombination occurring during subsequent amitotic divi-
sion.
T h e results of simulations in which the GI starting cells contained t w o or four recombinant units are shown in columns B and C of Table
2.
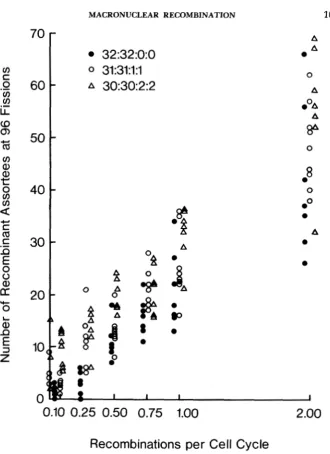
At a RCF of 0.0, meaning that amitotic recombination did not occur, recombinant as- sortees are produced, as expected. Although rare, the recombinant assortees generally first appeared within 70 to 90 fissions. As the RCF during amitotic division increased, the fission at which the first recombinant assortee appears decreased and the final proportion of recombinant assortees increased. At lower RCFs, however, the variance was considerably larger than at higher RCFs, and at all RCFs the distributions (not shown, but see Figure 1) showed considerable overlap. Recombination during macronuclear development, there- fore, is not easily distinguished from recombination in subsequent cell cycles. However, if experimentally no recombinant assortees appear within the first 100 fissions but do so at some time thereafter, one can conclude that recom- bination during macronuclear development is unlikely and that the observed recombinants are due to recombination in the subsequent amitotic cycles.Gene mapping: T h e answer to the question as to whether macronuclear re- combination followed by assortment is of sufficient sensitivity to permit gene mapping has been anticipated in the previous sections. It is a qualified yes. Genes located on homologous chromosomes are theoretically mappable relative to each other provided RCFs remain proportional in both development and amitotic division, However, the variance associated with low RCFs is suffi- ciently high that fine structure mapping is precluded.
MACRONUCLEAR RECOMBINATION 1041 tn C 0 tn tn LL
a
0,a
tn a,.-
.-
+E
52
a
0.cI C
a
Ca
E
0 0 a,U
0 a,a
E
2z
.-
rc L70
60
50
40
30
20
10
40 '
1
32:32:0:0
0
31:31:1:1
A
30:30:2:2
2
A 0 A %Q
8
00 A A 0 0 A eoA A
8h
08
0 0 0 0 0 A 0 08
9 I I I I
0.10
0.25
0.50 0.75 1.00
2.00
Recombinations per Cell Cycle
FIGURE 1 .-Number of recombinant assortees at 96 fissions for three different starting ratios as a function of amitotic RCF. Each simulation represents the outcome of a single assortment simulation in which 500 subclones are derived from a single macronucleus; for each combination of starting ratio and RCF six to ten simulations were performed. T h e symbols are offset at each RCF for clarity. Note the considerable overlap both among different RCFs at a given starting ratio and among the three starting ratios at a given RCF. These data are from the same simulations reported in Tables 1 and 2.
1042 F. P. DOERDER AND S. L. DIBLASI TABLE 4
Recombination and assortment among 100 subclones with a starting ratio of
32AB: 32ab: OAb: OaB
No. of recombinants at:
First End of recombinant Simulation no. 96 fissions Assortment (fission)
RCF = 0.10 303 304 305 306 307 308 Mean SD RCF = 1 297 298 299 300 301 302 Mean SD
0 9
0 8
0 7
0 6
0 6
4 0 7.0 1.8
-
-
1 25
4 36
0 29
0 28
0 24
29 4
1.5 28.5
2.0 4.2
-
-
130 104 104 117 11722 1 130 46.8 78 65 104 104 104 65 87 19.6
either the RCF or the input ratio. Nevertheless, depending upon the precise outcomes of repeated experiments, a crude map may be possible. For example, for hypothetical loci A , B and C, experimentally observed values of
25
AB recombinants and ten BC recombinants are sufficiently different with respect to possible RCFs to permit ordering of the loci if AC recombinants total 40or 50. On the other hand, if as a reflection of the variance, the number of observed AC recombinants is 30, no map is possible. Given the variation of possible outcomes for any given RCF, any map that is drawn is subject to considerable uncertainty.
Sample size in recombination experiments: In the simulations reported here,
500 subclones were scored. A review of the literature shows that assortment experiments always use considerably fewer. For some purposes a lower number may suffice (F. P. DOERDER, unpublished results), but in other experiments it will not. T o illustrate, suppose it is desired to score for recombination in assorting subclones at 96 fissions, as in Figure 1. But suppose that, due to the difficulty of determining the phenotypes, only 100 subclones can be scored. What can be learned? T h e answer is suggested in Table 4. For RCF = 0.1, no stable recombinants were seen at 96 fissions, and for RCF = 1.0 recombi- nants were seen in only three of the six simulations. Yet, when 500 clones were scored, as in Figure 1, zero values were rare (e.g., one in seven for RCF
MACRONUCLEAR RECOMBINATION 1043
however, unchanged. Thus, for a smaller sample size, rare recombination is likely to be missed. This conclusion is not unexpected given the randomness associated with the assortment process and indicates that sample size must be carefully considered for each hypothesis to be tested. Unfortunately, given the diversity of possible hypotheses, we are unable to present a meaningful table of optimum sample sizes.
DISCUSSION
We have shown by computer simulation that linkage between macronuclear genes should be experimentally demonstrable by assortment when the fre- quency of recombination is less than three times
per
cell cycle. We have also shown that assortment experiments are not likely to readily distinguish recom- bination during development from subsequent amitotic recombination unless the former is sufficiently rare so that recombinant assortees do not first appear until well after 100 fissions past conjugation. Finally, we have shown that the frequencies of recombinant assortees should permit in some circumstances the construction of a crude genetic map.Recombination between macronuclear genes is possible a t any stage of the life cycle. If recombination is rare, then it should produce parental and recom- binant assortees in frequencies that suggest linkage. Both the timing and fre- quency of recombination can influence the frequency of recombinant assortees. For instance, recombination early in macronuclear development at the 4C (haploid equivalents) stage could result in a 1 : l : l : l ratio of assorting units, whereas later recombination at the 64C stage could result in a 3 1 :3 1 : 1 : 1 ratio. Thus, recombination in early development would tend to obscure any subse- quent recombination. RCFs may be different at different stages of the life cycle. Recombination during macronuclear development may be higher, rela- tive to total gene dosage, than during subsequent amitotic cycles. In addition, recombination might not occur in macronuclei that skip an S phase. Simple assortment experiments would not distinguish among these possibilities.
Relatively few experiments to map macronuclear genes have been per- formed. In large part this is because micronuclear linkages have been difficult to demonstrate. Indeed, the assignment of nearly 100 loci to the N = 5 mi- cronuclear chromosomes has been through the use of nullisomic strains rather than through conventional testcrosses of double heterozygotes (BRUNS 1982; P.
J.
BRUNS, personal communication). Testcrosses that have been reported have, unfortunately, yielded ambiguous results, demonstrating linkage in some crosses but not in others (DOERDER 1973; McCoy 1977); the offending loci have yet to have their linkages confirmed by the method of nullisomics.1044 F. P. DOERDER AND S. L. DIBLASI
produce recombinant assortees at frequencies sufficient to establish linkage. Therefore, if closely linked micronuclear genes (as determined by testcrosses or molecular methods) continue to show independent macronuclear assortment but are shown by molecular techniques to be on the same macronuclear chro- mosome, frequent macronuclear recombination would be indicated.
ORIAS (1 973) proposed that macronuclear recombination is responsible for peculiarities of assortment for the isozymes of the P-I (acid phosphatase) locus (ALLEN 197 1). Heterozygotes frequently assort to express not two, but three, stable types of subclones. Orias suggested that the stable third isozyme (P3) is the result of intraallelic recombination between the genes for PI and
P5
which are the stable isozymes of the majority of assortees. According to Orias’ scheme, the recombinant would have a charge intermediate between the other two stable isozymes. T h e simulations reported here are consistent with Orias’ interpretation if the hypothetical recombination event occurs after macronu- clear development. Thus, ALLEN (1971) reported no stable Ps clones in an interval of 1 17- 160 fissions after conjugation, although at 1 17 fissions the isozyme was present in a minority of unassorted clones. Unfortunately, the published data are insufficient either to extrapolate the time of the initial recombination event or to estimate the frequency of its occurrence.We thank MICHELE BERKOWITZ and the members of our research group for their comments on the manuscript. This work was supported in part by National Institutes of Health grant GM29588 to F. P. D.
LITERATURE CITED
ALLEN, S. L., 1964
ALLEN, S. L. 1965
ALLEN, S. L., 1971 BRUNS, P. J., 1982
DOERDER, F. P., 1973 Regulatory serotype mutations in Tetrahymena pyriyormis, syngen 1 . Ge- netics 7 4 81-106.
DOERDER, F. P., 1979 Regulation of macronuclear DNA content in Tetrahymena thermophila. J.
DOERDER, F. P. and L. E. DEBAULT, 1978 Life cycle variation and regulation of macronuclear
DOERDER, F. P. and S. L. DIBLASI, 1983 Computer simulation of macronuclear assortment and
GOROVSKY, M. A., 1980 Genome organization and reorganization in Tetrahymena. Annu. Rev. Genet. 14: 203-239.
McCoy, J. W., 1977 Linkage and genetic map length in Tetrahymena thermophila. Genetics 87:
MERKULOVA, N. N., AND S. N. BORCHSENIUS, 1976 Replication and integration of fragments of new chains into the DNA of the infusorian Tetrahymena pyriformis. Mol. Biol. (USSR) 1 0 875- 880.
Linkage studies in variety 1 of Tetrahymena pynyormis: a first case of linkage
Genetic control of enzymes in Tetrahymena. Brookhaven Symp. Biol. 18: 27-
A latedetermined gene in Tetrahymena heterozygotes. Genetics 68: 415-433.
Tetrahymena thermophila. Genet. Maps 2: 178-181. in the ciliate protozoa. Genetics 49: 617-627.
54.
Protozool. 2 6 28-35.
DNA content in Tetrahymena thermophila. Chromosoma 6 9 1-19.
recombination in Tetrahymena Genetics 104 (Suppl): s22.
MACRONUCLEAR RECOMBINATION 1045
ORIAS, E., 1973 Alternative interpretation of the molecular structure and somatic genetics of
Macronuclear genetics of Tetrahymena I. Random distribution of
T h e size of macronuclear DNA and its relationship to
Tetrahymena pyriformis. pp. 433-467. In: Handbook of Genetics, Edited
Viscoelastic studies on acid phosphatase-I in Tetrahymena pyriformis. Biochem. Genet. 9: 87-90.
macronuclear gene copies in T. pyriformis, syngen 1. Genetics 7 9 187-206.
models for maintaining genic balance. J. Protozool. 2 6 14-18.
by R. C. KING, Vol 2. Plenum Press, New York.
Tetrahymena macronuclear DNA. Proc. Natl. Acad. Sci. USA 1 0 5062-5065.
Repeated hexanucleotide sequence C-C-C-C-A-A is present near free ends of macronuclear DNA of Tetrahymena. Proc. Natl. Acad. Sci. USA 7 8 7436-7439.
Corresponding editor: S. L. ALLEN ORIAS, E. and M. FLACKS, 1975
PREER, J. R., JR. and L. B. PREER, 1979
SONNEBORN, T. M., 1974
WILLIAMS, J. B., E. W. FLECK, L. E. HELLIER and E. UHLENHOPP, 1978