Volume 2, No. 6, Nov-Dec 2011
International Journal of Advanced Research in Computer Science
RESEARCH PAPER
Available Online at www.ijarcs.info
Metric Dependent Performance Optimization of Virtual Machine Using Hyper
Threading Concept
K.Phaneendra* Assistant Professor, Department of MCA,
Lakkireddy Balireddy College of Engineering, Mylavaram, India.
DR.M.Babureddy Head Department of MCA,
Lakkireddy Balireddy College of Engineering, Mylavaram, India
[email protected] G.Rajendra ,
Assistant Professor, Department of MCA,
Lakkireddy Balireddy College of Engineering Mylavaram, India.
Abstract: Accurate estimate of resource demands is crucial for managing and planning resources in various computer systems. Any work done by computer system considered as a path in the potential field of resources. Metrics provide a quantitative basis for the development and validation of models in the development process. Virtual systems and virtualization technology are taking the momentum nowadays in data centers and IT infrastructure models. Performance analysis of such systems is very invaluable for enterprises but yet is not a deterministic process.
n this paper we will present an overview of the key requirements and characteristics of virtual systems performance metrics and workload characterization which can be considered one step further in implementing virtual systems benchmark and performance. The benchmark tests are taken to describe the type of system scalability feature being tested, and describe observed behaviour based on the workload. In particular we explore how Hyper-Threading affects the throughput.
Keywords: Metric, Virtualization, Hyper-thread, Throughput, Virtual Machine
I. INTRODUCTION
Efficiency of many computing systems heavily depends on the efficiency of their resource management. One wide class of computing systems rely on the resource management as their key element. Resource management must be done to satisfy the user requirements.User satisfaction can be measured in eight dimensions for quality as well as overall user satisfaction: capability or functionality, usability, performance, reliability, installs ability, maintainability, documentation, and availability.
Abstractly, system architecture involves the description of elements from which systems are built, interactions among those elements, patterns that guide their composition, and constraints on those patterns. In general, a particular system is defined in terms of a collection of components, and interactions among those components. By considering all these metrics plays an important role to make the system function effectively by managing its recourses. In this process an overview of the key requirements and characteristics of virtual systems performance metrics and workload characterization which can be considered one step further in implementing virtual systems benchmark and performance model that describe the effect of the applications, host operating system and the hypervisor layer on the performance metrics of virtual workloads. The benchmark tests are taken to describe the typical CPU-intensive workloads that saturate a single CPU, the overall system throughput should increase as the number of virtual
machines increases until the number of virtual machines exceeds the number of physical CPUs (or, when hyper-
threading is enabled, exceeds twice the number of hyper threaded (CPU packages). Past this point, the overall system throughput should plateau while the run time of each individual virtual machine increases, due to each virtual machine's diminished share of the fixed physical resources. To demonstrate this behaviour, the GZIP benchmark was run with 1, 2, 4, 6, 8, 10, 12, 14, and 16 virtual machines. To demonstrate the potential performance impact of hyper-threading, benchmark tests were run with hyper-threading both disabled and enabled.
A. Metrics Methodology:
In 1993 the IEEE published a standard for software quality metrics methodology that has since defined and led development in the field. Here we begin by summarizing this standard. It was intended as a more systematic approach for establishing quality requirements. They are identifying, implementing, analyzing and validating software quality metrics for software system development. The IEEE Metric set consists of Name, Metric, Cost, and Benefit, Impact, Target value, Factors and Tools, Application, Data Items, Computation, Interpretation, Considerations, Training, Example, History and references.
necessary training. It is also wise at this point to test the metrics on some known software to refine their use, sensitivity, accuracy, and the cost of employing them.[2].This situation has often been referred to as the Good metrics should facilitate the development of ―software crisis‖ models that are capable of predicting process or product parameters, not just describing them.
[3]Thus, accurate and effective estimating, planning is needed for maximum utility in analytic studies and control are nearly impossible to achieve and statistical analyses, metrics should have data values that belong to appropriate measurement.[4] Improvement of the process depends upon improved ability to identify, measure, scales and control essential parameters of the development. It has been observed that the fundamental qualities process. This is the goal of software metrics—the required of any technical system are identification and measurement of the essential parameters that affect software development.
a. Functionality—correctness, reliability, etc. b. Performance—response time, throughput, so that Software metrics and models can been proposed.
We are taking the metrics and applying on the
virtualized environment to describe the model of the system which gives best performance.
II. VIRTUALIZATION
When computer systems were first invented was large and expensive to operate. Due to their size, expense, and demand for their usage, computer systems quickly evolved to become timesharing systems so that multiple users (and applications) could use them simultaneously. As computers became more prevalent however, it became apparent that simply time-sharing a single computer was not always ideal. For example, misuse of the system, intentional or unintentional, could easily bring the entire computer to a halt for all users. For organizations that could afford it, they simply purchased multiple computer systems to mitigate these pitfalls.
Having multiple computer systems proved beneficial for the following reasons: Isolation. In many situations it is beneficial to have certain activities running on separate systems. For instance an application may be known to contain bugs, and it might be possible for the bugs to interfere with other applications on the same system. Placing the application on a separate system guarantees it will not affect the stability of other applications.
a. Performance: Placing an application on its own system allows it to have exclusive access to the system‘s resources, and thus have better performance than if it had to share that system with other applications. [5].User level separation of applications on the same machine does not effectively performance isolate applications–scheduling priority, memory demand, network, I/O and disk I/O of one process can affect the performance of others. (For example, one application thrashing the hard disk can slow all other applications on the same system).
Most organizations at the time weren‘t so fortunate to be able to purchase multiple computer systems. It was also recognized that purchasing multiple computer systems was often wasteful, as having more computers made it even harder to keep them busy all the time. However having multiple computers obviously had its benefits, so taking cost
and waste into consideration IBM in 1960‘s began developing the first virtual machines that allowed one computer to be shared as if it were several.
The Virtualization technology is taking the momentum these days in data centers and IT infrastructure models. Virtualization is very similar conceptually to emulation. With emulation, a system pretends to be another system.
A. Concepts of Virtualization:
Virtualization decouples users and applications from the specific hardware characteristics of the systems they use to perform computational tasks. With virtualization, a system pretends to be two or more of the same system. As shown in figure 1,
Figure: 1
The virtualization layer will partition the physical resource of the underlying physical system into multiple virtual machines with different loads.
The fascinating thing about this virtualization layer is that it schedules and allocates the physical resource and makes each virtual machine think that it totally owns all the underlying hardware physical resource (processor, disks, rams etc.). Most modern operating systems contain a simplified system of virtualization. Each running process is able to act as if it is the only thing running. The CPUs and memory are virtualized. If a process tries to consume all of the CPU, a modern operating system will preempt it and allow others their fair share. Similarly, a running process typically has its own virtual address space that the operating system maps to physical memory to give the process the illusion that it is the only user of RAM [6] shown in Figure 2
Figure: 2
virtualization intensively, because it let them offer each client his own virtual machine without requiring a physical machine taking up rack space in the data centre.
B. Types of Virtualization:
The Virtual Resources can be shared across multiple virtual machines sitting atop the layer of abstraction. There are varied approaches towards achieving virtualization, the three most widely used ones being, Full virtualization, Para-virtualization and Hardware Virtualization
a. Full Virtualization: Full virtualization allows running unmodified guest operating systems on top of the existing native operating systems.
b. Para-Virtualization: Para-Virtualization requires modifications to the guest operating systems to avoid binary translation. This is generally suitable for open source operating systems like Linux. This might not be a suitable option for ‗closed‘ operating systems like windows and vista.
c. Hardware Virtualization: Virtualization layer below the operating system called the virtual Machine Monitor (VMM), sits atop the hardware providing flexibility to run multiple operating systems. Earlier, x86 processor architecture did not support virtualization requirements but these days hardware vendors have made changes to their underlying architectures to support for virtualization.
C. Requirements for Virtual Machines:
In 1974 Popek and Goldberg defined what they believed where the formal requirements for a virtualizable computer architecture. [7]For any computer a virtual machine monitor may be constructed if the set of sensitive instructions for that computer is a subset of the set of privileged instructions. In other words, the most essential requirement a computer architecture must exhibit in order to be virtualizable is that privileged instructions must trap, meaning when a guest virtual machine (while running directly on the real processor) attempts to execute a privileged instruction, the processor stops and returns control to the VMM so it can either decide whether or not to execute the instruction, or simulate the instruction by some other means. Popek and Goldberg also stated that virtual machine architecture has three essential characteristics:
a. Any program run under the VMM should exhibit an effect identical with that demonstrated if the program had been run on the original machine directly. They offered one exception to this rule, timing. The software (or hardware) aiding the virtual machine needs to manage the resources used by the virtual machine(s), and this requires it to intervene occasionally, thus altering the timing characteristics of the running virtual machine(s).
b. A statistically dominant subset of the virtual processor‘s instructions is executed directly by the real processor. Popek and Goldberg say that a virtual machine is different from an emulator. An emulator intervenes and analyzes every instruction performed by the virtual processor, whereas a virtual machine occasionally relinquishes the real processor to the virtual processor. For efficiencies sake, this relinquishment must make up the majority of the real processor‘s workload.
c. The VMM is in complete control of system resources. A virtual machine running on the system does not have direct access to any of the system‘s real resources; it must go through the VMM.
These characteristics, although interesting on the surface, prove to be difficult or undesirable to meet. Virtualization software was adopted faster than anyone imagined, including the experts. There are three areas of IT where virtualization is making head roads, network virtualization, storage virtualization and server virtualization.
a. [8]Network virtualization is a method of combining the available resources in a network by splitting up the available bandwidth into channels, each of which is independent from the others, and each of which can be assigned (or reassigned) to a particular server or device in real time. The idea is that virtualization disguises the true complexity of the network by separating it into manageable parts; much like your partitioned hard drive makes it easier to manage your files.
b. [9]Storage virtualization is the pooling of physical storage from multiple network storage devices into what appears to be a single storage device that is managed from a central console. Storage virtualization is commonly used in storage area networks (SANs). c. Server virtualization is the masking of server resources
(including the number and identity of individual physical servers, processors, and operating systems) from server users. The intention is to spare the user from having to understand and manage complicated details of server resources while increasing resource sharing, utilization and maintaining the capacity to expand later.
III. MONITORING PERFORMANCE METRICS:
The current virtualization technologies do not allow monitoring performance counters from the guest operating systems as they are not visible. So performance metrics can be collected from only the host operating system.
Performance metrics can be collected only at virtual machine level and metrics like CPU, disk, memory, NIC utilization of the virtual machines can be collected from the host operating system.
In the absence of sophisticated performance analysis tools for monitoring multiple virtual machines performance, coupled with the non-availability of SPEC performance benchmarks for running multiple virtual machines, it becomes imperative for enterprises IT departments to have a plausibly structured and analytical approach. This enables the adoption of virtualization and thus quantifies the risks to the best possible extent before making an informed decision about it.
A. Metrics for Resource Utilization:
Know which resource is consuming more CPU. Find out if CPUs are running at full capacity or are they being underutilized. Metrics shown include Total CPU utilization, Guest CPU utilization, Hypervisor CPU utilization, idle CPU utilization, etc.
B. Memory Usage:
swap memory, physical memory, free physical memory, deposited pages, virtual TLB pages, total remote physical pages, etc.
C. Networking and Virtual Network Statistics: Monitor the health and status of the network interfaces, virtual network adapters, legacy virtual network adapters and virtual switch. The performance can be monitored through attributes such as input/output traffic utilization, offloaded connections, outbound packets errors, data receive rate, data transfer rate, packets received/transmitted, health of interface, etc.
D. Storage and Virtual Storage Metrics:
Get an idea of the overall disk performance of the Hyper-V system as well as for each VM. Find out how busy the drives are or if the disks are saturated. Metrics include Current Disk Queue Length, Disk bytes per second, Disk transfers per second, etc.
E. Top Hyper-V Servers:
Get an overview of the servers that are consuming your resources and take necessary action. Metrics provided include top total CPU utilization consumers, top guest CPU utilization consumers, top idle CPU utilization consumers and top memory consumers.
IV. INTRODUCTION TO HYPER-THREADING
Hyper-Threading is Intel‘s implementation of simultaneous multithreading technology and was first introduced with Intel‘s Xeon processor. Hyper-Threading allows the processor to use execution units that are normally unused (such was when the processor is waiting because of a cache miss). The actual performance improvement is application dependent (Intel).
ESX Server is a native VM system. A native VM system is one where the VMM is the only software on the machine that runs in the highest privilege level of the host machine. In contrast a VMM that is installed on a host that runs an operating system independent of the VMM is called a hosted VM system.[6] [10]If the VMM on a hosted system runs in a privilege level below the host‘s operating system it is called a user-mode hosted VM system. VMware Server and Microsoft Virtual PC are two examples of user-mode hosted VM systems. VMware claims that since ESX Server runs directly on the hardware I/O performance is significantly higher on ESX Server than on user-mode hosted VM systems. VMware runs unmodified guest operating systems. Paravirtulization achieves higher performance than traditional VM systems by presenting an interface that is similar, but not identical to the underlying hardware. The changes are intended to make virtualization more efficient, but they also require that guest operating systems be rewritten to only use the new interface. Xen and Denali are two well-known paravirtaulization systems
A. Benchmark Test Cases:
This paper provides benchmark test results illustrating the behaviour of virtual machine performance as you scale the number of virtual machines Table 1 provides a summary of the benchmark test cases included in this paper.
Table 1 Summary of Benchmark Test Cases
Test Cases Description
Virtual Machine Scalability
System throughput measured as the number of virtual machines is increase; tests were performed with hyper-threading enabled and disabled.
The following sections detail each of the benchmark tests, describe the type of system scalability feature being tested, and describe what behaviour might be observed based on the workload. Analysis of the results following execution of each benchmark test show and explain the behaviour of the resource allocation method and its effect on system throughput and performance.
B. Virtual Machine Scalability:
For many typical CPU-intensive workloads that saturate a single CPU, the overall system throughput should increase as the number of virtual machines increases until the number of virtual machines exceeds the number of physical CPUs (or, when hyper-threading is enabled, exceeds twice the number of hyper threaded CPU packages). Past this point, the overall system throughput should plateau while the run time of each individual virtual machine increases, due to each virtual machine's diminished share of the fixed physical resources. To demonstrate this behaviour, the GZIP benchmark was run with 1, 2, 4, 6, 8, 10, 12, 14, and 16 virtual machines. To demonstrate the potential performance impact of hyper-threading, benchmark tests were run with hyper-threading both disabled and enabled.
C. Hyper-Threading Disabled:
increases, as well as the maximum and minimum run times observed for each number of virtual machines tested.
The range of run times recorded for individual virtual machines should be narrow if the ESX Server scheduler is dividing the resources equally among all virtual machines. ESX Server exhibits this characteristic narrow range for the GZIP benchmark, which verifies its consistent behaviour under both lightly and heavily loaded conditions.
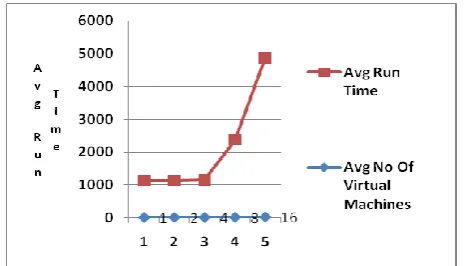
Figure 1 Performance vs. Number of Virtual Machines (Hyper-Threading Disabled)
Figure 1 also shows the equally important gauge of overall throughput as measured in benchmark iterations per hour. If the load is increased from one to four virtual machines, the throughput increases almost linearly from 16 iterations per hour to 62.6 iterations per hour. Once all processors are fully utilized, the overall throughput does not increase, but remains relatively flat, dropping slightly as each additional virtual machine is added. This gauge more clearly illustrates the overhead of managing additional virtual machines.
Table 2 Benchmark Run Times with Increasing Number of Virtual Machines (Hyper- Threading Disabled)
Average Number of Virtual Machines
Average Run Time (In Seconds)
Maximum Run Time (In Seconds)
Minimum Run Time (In Seconds)
Percent (%) Difference Between Max and Min
1 1124 1127 1119 0.7
2 1130 1138 1126 1.1
4 1151 1156 1144 1.0
8 2357 2367 2342 1.1
16 4846 4877 4785 1.9
D. Hyper-Threading Enabled:
The same virtual machine scaling tests were run with hyper-threading enabled. Figure 2 plots the GZIP benchmark test results. While the number of virtual machines does not exceed the number of physical processors (four), hyper-threading provides no additional benefit. As expected, the results with one to four virtual machines are similar to those without hyper threading. Hyper-threading begins to demonstrate benefits when the number of virtual machines increases past the number of physical processors. The throughput does not begin to peak until eight virtual machines are used, providing two threads of execution for each physical processor. As the number of virtual machines continues to increase, the throughput increases marginally until reaching a peak at 14 virtual machines, and then beginning to drop when 16 virtual machines are deployed.
Figure 2 Performances vs. Number of Virtual Machines (Hyper-Threading Enabled)
Table 3 lists the average, maximum, and minimum run times for benchmark tests as the number of virtual machines increases (with threading enabled). As in the hyper-threading disabled case, ESX Server allocates resources equally among the virtual machines, as shown by the narrow range between the maximum and minimum run times.
Table 3 Benchmark Run Times with Increasing Number of Virtual Machines (Hyper-Threading Enabled)
Figure 3 shows the relative performance benefit of enabling hyper-threading for CPU-intensive workloads. As expected, no benefit is gained until the number of virtual machines exceeds the number of physical processors. When the system is saturated, hyper-threading increases throughput by about 20 percent over the non-hyper-threading case by utilizing each processor more effectively. However, the benefit of hyper-threading technology varies significantly with workload and cannot be easily generalized to other workloads. In particular, applications with more networking, disk I/O, or operating system calls will likely achieve less dramatic results.
Figure 3 Comparison of Run Time Performance with and Without Hyper-Threading
Average No of Virtual Machines
Average Run Time (In Seconds)
Maximum Run Time (in Seconds)
Minimum Run Time (In Seconds)
Precent(%) Difference Between Max and Min
1 1127 1129 1126 0.3
2 1135 1139 1129 0.9
4 1159 1166 1149 1.5
8 2036 2048 2020 1.4
V. CONCLUSION
Hyper-Threading significantly increases throughput for CPU intensive workloads. When twelve virtual CPUs were benchmarked and Hyper-Threading was enabled the throughput of single CPU virtual machines increased 21% and the throughput of two CPU virtual machines increased 23% compared to when Hyper-Threading was disabled. Since Hyper-Threading is most effective with large numbers of virtual machines a host that is Hyper-Threading enabled should have at least two virtual CPUs in aggregate for every physical CPU. Using fewer virtual CPUs reduces the benefits of Hyper-Threading.
In summary:
a. Single CPU guest machines scale better than guest machines using virtual SMP.
b. Hyper-Threading increases throughput if there are a large number of virtual CPUs, but makes no difference if the number of virtual CPUs is less than or equal to the number of physical CPUs. c. Do not allocate excessive resources to virtual
machines. The additional resources may hurt performance.
Assessing the impact of virtualization on applications performance is one of the key factors in devising the right strategy for virtualization. The usual goal of virtualization is to centralize administrative tasks while improving scalability and workloads.
VI. REFERENCES
[1]. Tu Honglei; Sun Wei; Zhang Yanan, Zhuhai, ―The Research
on Software Metrics and Software Complexity
Metrics‖volume-1,Dec-2009, presented at International Forum on Computer Science-Technology and Applications, IFCSTA '09. PP.131-136.
[2]. Norman E. Fenton ―Software Metrics, ―A Rigorous
Approach‖, 2nd Edition Revised Ed, 1997, Boston: PWS Publishing.
[3]. R. K. Jain., Art of Computer Systems Performance Analysis -
Techniques for Experimental Design Measurements
Simulation and Modeling, Ed-1, 1991, John Wiley & Sons
[4]. Conte, S. D., H. E. Dunsmore, and V. Y. Shen, Software
Engineering Metrics and Models, Ed-1,1986,
Benjamin/Cummings Publishing Company.
[5]. VMware ESX Server 2, ESX Server Performance and Resource Management for CPU-Intensive Workloads, 2008, a VMware white paper , pp. 4-11.
[6]. Mohamed A. El-Refaey, Mohamed Abu Rizkaa, "Virtual Systems Workload Characterization: An Overview," wetice‘09, 2009, 18th IEEE International Workshops on Enabling Technologies: Infrastructures for Collaborative Enterprises, pp.72-77
[7]. G.J. Popek, and R.P. Goldberg, ―Formal Requirements for Virtualizable Third Generation Architectures,‖ vol. 17 no. 7, 1974, Commun. ACM, pp. 412-421
[8]. N. M. M. K. Chowdhury and R. Boutaba, ―Network virtualization: state of the art and research challenges‖, Volume 47 Issue 7, July 2009, IEEE Communications Magazine, pp.20-26.
[9]. Waldspurger, ―Memory Resource Management in VMware ESX Server‖, vol. 36, no. SI, ACM SIGOPS Operating Systems Rev., winter 2002, pp. 181-194.
[10].Hyper Threading Support in VMware ESX Server 2, 2004 a VMware white paper,pp-3