Performance Analysis of Support Vector Machine (SVM) for Optimization of Fuzzy
Based Epilepsy Risk Level Classifications Using Different Types of Kernel
Functions from EEG Signal Parameters.
A. Keerthi Vasan, R. Harikumar, M. Logesh Kumar
Abstract-In this paper, we investigate the optimization of fuzzy outputs in the classification of epilepsy risk levels from EEG (Electroencephalogram) signals. The fuzzy techniques are applied as a first level classifier to classify the risk levels of epilepsy based on extracted parameters which include parameters like energy, variance, peaks, sharp spike waves, duration, events and covariance from the EEG signals of the patient. Support Vector Machine (SVM) may be identified as a post classifier on the classified data to obtain the optimized risk level that characterizes the patient’s epilepsy risk level. Epileptic seizures result from a sudden electrical disturbance to the brain. Approximately one in every 100 persons will experience a seizure at some time in their life. Some times seizures may go unnoticed, depending on their presentation which may be confused with other events, such as a stroke, which can also cause falls or migraines. Unfortunately, the occurrence of an epileptic seizure seems unpredictable and its process is very little understood The Performance Index (PI) and Quality Value (QV) are calculated for the above methods. A group of twenty patients with known epilepsy findings are used in this study. High PI such as 98.5% was obtained at QV’s of 22.94, for SVM optimization when compared to the value of 40% and 6.25 through fuzzy techniques respectively. We find that the SVM Method out performs Fuzzy Techniques in optimizing the epilepsy risk levels. In India number of persons are suffering from Epilepsy are increasing every year. The complexity involved in the diagnosis and therapy is to be cost effective in nature. This paper is intended to synthesis a cost effective SVM mechanism to classify the epilepsy risk level of patients.
Index Terms- EEG signals, Epilepsy, fuzzy techniques, performance Index, Quality Value.
I. INTRODUCTION
Support Vector Machine (SVM) is an important machine learning technique which involves creating a function from a set of labeled trained data. People attacked by epilepsy [2] are unnoticed and this leads to other events such as a stroke, which also causes falls or migraines. In India number of persons suffering from epilepsy is increasing per year. The complexity involved in the diagnosis and therapy is to be cost effective in nature. Airports, amusement parks, and shopping malls are just a few of the places where computers are used to diagnosis a person’s Epilepsy risk levels if a life threatening condition occurs. In some situation there is not always a trained doctor’s and neuro scientists on hand. This project work is intended to synthesis a cost effective SVM mechanism to classify the epilepsy risk level of the patients and to mimic a doctor’s and neuro scientist’s diagnosis.
The EEG (Electroencephalogram) signals of 20 patients are collected from Sri Ramakrishna Hospitals at Coimbatore and their risk level of epilepsy is identified after converting the EEG signals to code patterns by fuzzy systems. This type of classification helped doctor’s and neuro surgeons in giving appropriate therapeutic measures to the patients. This paper helps to save a patient’s life when a life threatening condition
occurs. This scientific paper is carried in order to save a patient’s life and also to create public awareness among people about the riskness of epilepsy.
II. METHODOLOGY
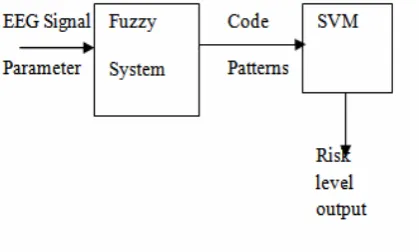
Support Vector Machine (SVM) is used for pattern classification and non linear regression like multilayer perceptrons and Radial Basis Function networks. SVM is now regarded as important example of ‘Kernel Methods’. The main idea of SVM is to construct a hyper plane as the decision surface in such a way that the margin of separation between positive and negative examples is minimized. The SVM is an approximate implementation of method of structural minimization. In SVM we investigate the optimization of fuzzy outputs in the classification of Epilepsy Risk Levels from EEG (Electroencephalogram) signals. The fuzzy techniques are applied as a first level classifier to classify the risk levels of epilepsy based on extracted parameters like energy, variance, peaks, sharp and spike waves, duration, events and covariance from the EEG signals of the patient. The block diagram of epilepsy classifier is shown in Fig 1. This is accomplished as:
1. Fuzzy classification for epilepsy risk level at each channel from EEG signals and its parameters.
2. Each channel results are optimized, since they are at different risk levels.
3. Performance of fuzzy classification before and after the SVM optimization methods is analyzed.
[image:1.595.328.538.507.633.2]
Fig 1 SVM- Fuzzy Classification System
The following tasks are carried out to classify the risk levels by SVM which are,
1.
First a simplest case is analyzed with hyper plane as decision function with the known linear data. A non linear classification is done for the codes obtained from a particular patient by using quadratic discrimination.3.
The centroid obtained is mapped by the kernel function for obtaining a proper shape.4.
A linear separation is obtained by using SVM with kernel and k-means clusteringIn fuzzy techniques [3] more suboptimal solutions are arrived. These solutions are to be optimized to arrive a better solution for identifying patient’s epilepsy risk level. Due to the low value of performance index (40%), quality value (6.25) it is necessary to optimize the output of the fuzzy systems. Hence we are moving to SVM classification which gives a performance index of 98% and a quality value of 22.94. For optimization of fuzzy outputs the Support Vector Machine (SVM) method is identified.
The following solutions constraints steps are followed: Step 1: The linearization and convergence is done using Quadratic Optimization [4,7]. The primal minimization problem is transformed into its dual optimization problem of maximizing the dual lagrangian LD with respect to : Max LD =
(1) Subject to
(2)
(3) Step 2:The optimal separating hyper plane is constructed by
solving the quadratic programming problem defined by (1)-(3). In this solution, those points have non-zero Lagrangian multipliers ( ) are termed support vectors. Step 3:Support vectors lie closest to the decision boundary. Consequently, the optimal hyper plane is only determined by the support vectors in the training data.
Step 4: The k-means [5-8] clustering is done for the given set of data. The k-means function will form a group of clusters according to the condition given in step2 and step3. Suppose for a group of 3 clusters, k-means function will randomly choose 3 centre points from the given set. Each centre point will acquire the values that are present around them.
Step 5: Now there will be six centre points three from each epochs and then the SVM training process is done by the Kernel methods. Thus, only the kernel function is used in the training algorithm, and one does not need to know the explicit form of . Some of the commonly used kernel [10] functions are:
Polynomial function: Radial Basis Function:
Sigmoid function:
III. RADIAL BASIS FUNCTION KERNEL The hyper plane and support vectors are used to separate linearly separable and non-linearly separable data. In this project we used, Radial Basis Kernel function (RBF) [4] for this non-linear classification. RBF is a curve fitting approximation in higher dimensional space. According to this learning it is equivalent to finding a surface in multi
training data and generalization is equivalent to use of this multidimensional surface to interpolate the test data. It draws up on a traditional strict interpolation in multidimensional space. Thus RBF provides a set of the testing data which acts as a “basis” for input patterns when expanded into hidden space. From the set of RBF testing values the Mean Square Error (MSE) and Average MSE is performed and error values are calculated. The tool used in this study is matlab v7.2.
The EEG data used in the study were acquired from twenty epileptic patients who had been under the evaluation and treatment in the Neurology department of Sri Ramakrishna Hospital, Coimbatore, India. A paper record of 16 channel EEG data is acquired from a clinical EEG monitoring system through 10-20 international electrode placing method. The EEG signal was band pass filtered between 0.5 Hz and 50Hz using five pole analog Butter worth filters to remove the artifacts. With an EEG signal free of artifacts, a reasonably accurate detection of epilepsy is possible; however, difficulties arise with artifacts. This problem increases the number of false detection that commonly plagues all classification systems. With the help of Neurologist (Golden standard with 100% sensitivity &100% specificity), we had selected artifact free EEG records with distinct features. These records were scanned by Umax 6696 scanner with a resolution of 600dpi.
IV. EEG DATA ACQUISITION ANDPREPROCESSING Since the EEG records are over a continuous duration of about thirty seconds, they are divided into epochs of two second duration each by scanning into a bitmap image of size 400x100 pixels. A two second epoch is long enough to detect any significant changes in activity and presence of artifacts and also short enough to avoid any repetition or redundancy in the signal. The EEG signal has a maximum frequency of 50Hz and so, each epoch is sampled at a frequency of 200Hz using graphics programming in C. Each sample corresponds to the instantaneous amplitude values of the signal, totaling 400 values for an epoch. The different parameters used for quantification of the EEG are computed using these amplitude values by suitable programming codes. The parameters are obtained for three different continuous epochs at discrete times in order to locate variations and differences in the epileptic activity. We used twenty EEG records for both training and testing. These EEG records had an average length of six seconds and total length of 120 seconds. The patients had an average age of 31 years. A total of 960 epochs of 2 seconds duration are used.
1. The energy in each two-second epoch is given by
ni i
x
E
1 2
(4)
Where xi is signal sample value and n is number of samples. The normalized energy is taken by dividing the energy term by 1000.
2. The total number of positive and negative peaks exceeding a threshold is found.
lies between 20 and 70 ms and sharp waves are detected when the duration lies between 70 and 200ms.
4. The total numbers of spike and sharp waves in an epoch are recorded as events.
5.The variance is computed as given by
n x n
i i
1
2
) (
2
(5)
Where
n x n
i i
1
is the average amplitude of the epoch.
6 .The average duration is given by
p
D
p
i i
t
1(6)
Where ti is one peak to peak duration and p is the number of such durations.
7. Covariance of Duration: The variation of the average
duration is defined by
2 1
2
pD
t
D
CD
p
i
i
(7) [image:3.595.42.282.466.648.2]A sample value of extracted above seven features for the patient record 4 is shown in table I.
Table I. AVERAGE VALUES OF EXTRACTED PARAMETERS FROM PATIENT RECORD 4
In the above abnormal case all the sixteen channels do not show high risk characteristics of EEG signals. There are certain regions (Channel IX & Channel XIII) which produce near normal features. Therefore it is indispensable to classify epilepsy risk level on channel basis using fuzzy techniques, since the parameter values are overlapping in between the normal and abnormal regions.
V. FUZZY MEMBERSHIP FUNCTIONS
The energy is compared with the other six input features to give six outputs. Each input feature is classified into five fuzzy linguistic levels viz., very low, low, medium, high and
very high [11]. The triangular membership functions are used for the linguistic levels of energy, peaks, variance events, spike and sharp waves, average duration and covariance of duration. The output risk level is classified into five linguistic levels namely normal, low, medium, high and very high.
VI. FUZZY RULE SET Rules are framed in the format
IF Energy is low AND Variance is low THEN Output Risk Level is low
In this fuzzy system we have five linguistic levels of energy and five linguistic levels of other six features such as variance, peaks, events, spike and sharp waves, average duration and covariance of duration. Theoretically there may be 56 (that is 15625) rules are possible but we had considered the fuzzy pre -classifier as a combination of six two inputs and one output (2×1) system. With energy being a constant one input the other input is selected in sequential manner. This two inputs one output (2×1) fuzzy system works with 25 rules. We obtain a total rule base of 150 rules based on six sets of 25 rules each. This is a type of exhaustive fuzzy rule based system [1].
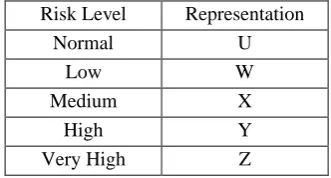
[image:3.595.335.501.627.716.2]VII. RISK LEVEL ESTIMATION IN FUZZY OUTPUTS The output of a fuzzy system represents a wide space of risk levels. This is due to sixteen different channels of input to the system in three epochs. This yields a total of forty-eight input output pairs. Since we deal with known cases of epileptic patients, it is indispensable to find the exact level of risk the patient. This will also aid in the development of automated systems that can precisely classify the risk level of the epileptic patient under observation. Hence an optimization of the outputs of the fuzzy system is initiated. This will improvise the classification of the patient’s state and can provide the EEGer with a clear picture. A specific coding method processes the output fuzzy values as individual code. Since working on definite alphabets is easier than processing numbers with large decimal accuracy, we encode the outputs as a string of alphabets. The alphabetical representation of the five classifications of the outputs is shown in table II
Table II. REPRESENTATION OF RISK LEVEL CLASSIFICATIONS
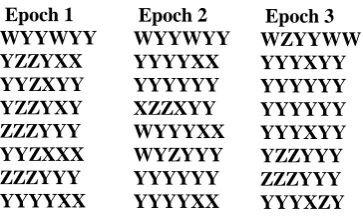
A sample output of the fuzzy system with actual patient readings is shown in fig. 2, for eight channels over three epochs. It can be seen that the Channel I shows low risk levels
Parameters Epoch1 Epoch2 Epoch3
Energy 5.2869 8.581 10.10
Variance 1.1397 2.121 2.322
1 2 2
Peaks
Total 9 38 35
8 6 6
Sharp &Spike
Total 122 91 87
12 10 10
Events
Total 185 154 145
Average duration
3.798 4.042 3.883
Covariance 0.5793 0.5123 0.5941 Risk Level Representation
Normal U
Low W
Medium X
High Y
while channel VII shows high risk levels. Also, the risk level classification varies between adjacent epochs
[image:4.595.56.238.84.194.2]
Fig 2. Fuzzy logic Output
VIII. SVM FOR OPTIMIZATION OF FUZZY OUTPUTS
An important factor for the choice of a classification method for a given problem is the available a-priori knowledge. During the last few years support vector machines (SVM) have shown to be widely applicable and successful particular in cases where a-priori knowledge consists of labeled learning data. If more knowledge is available, it is reasonable to incorporate and model this knowledge within the classification results or to require less training data. Therefore, much active research is dealing with adapting the general SVM methodology to cases where additional a-priori knowledge is available. We have focused on the common case where variability of data can be modeled by transformations which leave the class membership unchanged. If these transformations can be modeled by mathematical groups of transformations one can incorporate this knowledge independently of the classifier during the feature extraction stage by group integration, normalization etc. This leads to variant features, on which any classification algorithm can be applied.
It is noted that one of main assumptions of SVM is that all samples in the training set are independent and identically distributed (i.i.d), however, in many practical engineering applications, the obtained training data is often contaminated by noise. Further, some samples in the training data set are misplaced on the wrong side by accident. These known as outliers. In this case, the standard SVM training algorithm will make decision boundary deviate severely from the optimal hyper plane, such that, the SVM is very sensitive to noise, and especially those outliers that are close to decision boundary. This makes the standard SVM no longer sparse, that is, the number of support vectors increases significantly due to outliers. In this project, we present a general method that follows the main idea of SVM using adaptive margin for each data point to formulate the minimization problem, which uses the RBF kernel trick. It is noted that the classification functions obtained by minimizing MSE are not sensitive to outliers in the training set. The reason that classical MSE is immune to outliers is that it is an average algorithm. A particular sample in the training set only contributes little to the final result. The effect of outliers can be eliminated by taking average on samples. That is why the average technique is a simple yet effective tool to tackle outliers.
In order to avoid outliers we utilized the RBF kernel functions and also decision functions for determining the
margin of each classes. Since we are analyzing twenty epilepsy patients through leave one out methods and ten fold cross validation. Based on the MSE value and Average MSE values of SVM models the classifications of epilepsy risk levels are validated. The following Fig 3 depicts the training and testing MSE of SVM models. The outliers problem is solved through Average MSE method which is shown in Fig4.
MSE of Training and testing SVM Models
0 0.001 0.002 0.003 0.004 0.005 0.006
1 3 5 7 9 11 13 15 17 19
Patients
M
S
E
o
f
S
V
M
M
o
d
e
ls
[image:4.595.306.546.167.345.2]Series1 testing
Fig.3 MSE of Training and Testing of SVM Models
Average MSE under Testing
0 0.005 0.01 0.015 0.02 0.025 0.03 0.035 0.04 0.045
1 3 5 7 9 11 13 15 17 19
Patients
A
v
e
ra
g
e
M
S
E
[image:4.595.306.547.300.483.2]Average MSE under Testing
[image:4.595.306.545.604.743.2]Fig .4 Average MSE under Testing of SVM Models Fig 5 shows the details of training data with Perfect Classification (PC) from which up to 20% of training data set the perfect classification of 100% is obtained. When the training done by the outliers the PC of epilepsy risk level is slipped to 95% level and finally all the sets of data are trained the PC is settled at 98% only.
Fig .5 Training of Data with Perfect Classification Epoch 1
WYYWYY YZZYXX YYZXYY YZZYXY ZZZYYY YYZXXX ZZZYYY YYYYXX
Epoch 2 WYYWYY YYYYXX YYYYYY XZZXYY WYYYXX WYZYYY YYYYYY YYYYXX
Fuzzy Technique
0 20 40 60 80 100 120
7
9
8
4
.9
6
4
.2
8
6
.2
5
6
.3 75
6
7
.4
7
3
.3
6
8
.2
9
2
.1
Specificity
S
e
n
s
it
iv
it
y
Fuzzy Technique IX. TEST RESULTS
[image:5.595.310.535.51.229.2]In SVM the performance classification is about 97.39% which is very high when compared with Fuzzy logic which is 50% only. The sensitivity and selectivity of SVM is also more when compared to the latter. The missed classification of SVM is 1.458% but it is about 20% in Fuzzy Network and the value of PI in SVM is 97.07 and 40 in Fuzzy. Table III indicate the result details of Fuzzy and SVM methods.
Table III. PERFORMANCE INDEX
The Performance Index calculated for the aforesaid classification methods using [8] for SVM optimization is 97.07 which are higher than Fuzzy technique. It is evident that the optimizations give a better performance than the Fuzzy techniques due to its lower false alarms and missed classifications. This optimization model is evaluated in terms of its receiver operating characteristics (ROC) curve for test data sets. This enables the user to evaluate a model in terms of the trade-off between sensitivity and specificity. ROC matrices are used to show how changing detection threshold affects detection versus false alarms. If the threshold is set too high then the system will miss too much detection. Conversely, if the threshold is very low then there will be heavy false alarms. The percentage of detections classified correctly is plotted against the percentage of non -detections in correctly classified as detections (i.e. false alarms) as a function of the detection threshold. ROC is the best way to evaluate a detector.
The performance of classification for test data set is assessed by calculating the area under the ROC curve of AZ . It is noticed that the values of AZ from range of 0.5 to 1 for a perfect classifier. A good trade-off is observed between detections and false alarms. ROC curve for the Fuzzy with and without SVM optimization are shown in Fig 6(a) and 6(b).
Fig. 6(a) ROC of Fuzzy Classifiers
ROC of SVM Post Classifie r
86 88 90 92 94 96 98 100 102
100 100 100 100 100 100 100 93.7
5 100
93.7 5
Specificty
S
e
n
s
it
iv
it
y
Fig. 6(b) ROC of SVM Classifiers
In Order to compare different classifier we need a measure that reflects the overall quality of the classifier. Their quality is determined by three factors. Classification rate, Classification delay and False Alarm rate. The quality value QV is defined as
fa
dly dct msd
V
P
P
T
R
C
Q
*
6
*
*
2
.
0
(8)Where, C is the scaling constant
Rfa is the number of false alarm per set
Tdly is the average delay of the on set classification in seconds
Pdct is the percentage of perfect classification and Pmsd is the percentage of perfect risk level missed
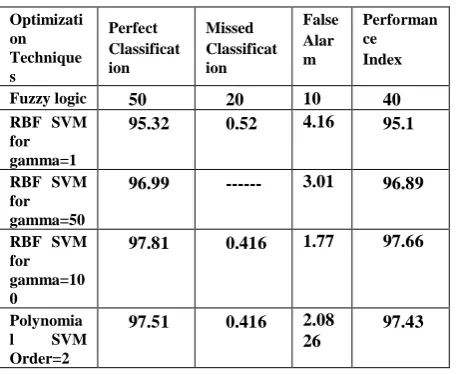
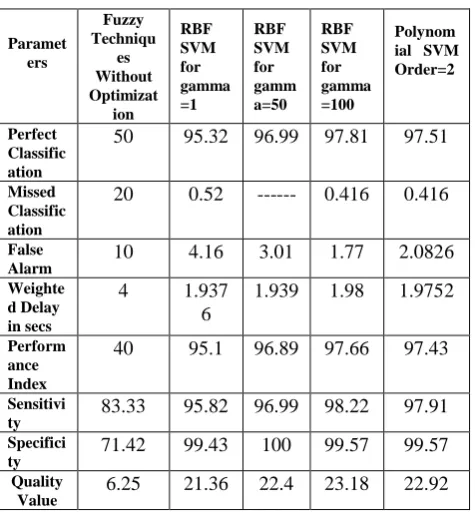
A constant C is empirically set to 10 because this scale is the value of QV to an easy reading range. The higher value of QV, the better the classifier among the different classifier, the classifier with the highest QV should be the best. Fig 7 depicts the details of quality values for each patient. IV shows the Comparison of the fuzzy and SVM optimization techniques. It is observed from table IV that SVM method is performing well with the highest performance index and quality values.
Optimizati on Technique s
Perfect Classificat ion
Missed Classificat ion
False Alar m
Performan ce Index
Fuzzy logic 50 20 10 40
RBF SVM for gamma=1
95.32 0.52 4.16 95.1
RBF SVM for gamma=50
96.99 --- 3.01 96.89
RBF SVM for gamma=10 0
97.81 0.416 1.77 97.66
Polynomia l SVM Order=2
97.51 0.416 2.08 26
[image:5.595.307.543.106.392.2] [image:5.595.42.272.174.361.2] [image:5.595.307.546.249.407.2]Quality Value
0 5 10 15 20 25 30
1 2 3 4 5 6 7 8 9 10 11 12 13 14 15 16 17 18 19 20
Patient
Q
u
a
li
ty
V
a
lu
[image:6.595.58.291.53.199.2]e
Fig.7 Quality value for Data set
Table IV. COMPARISON RESULTS OF CLASSIFIERS TAKEN AS AVERAGE OF ALL TEN PATIENTS
X. CONCLUSION
This paper investigates the performance of SVM in optimizing the epilepsy risk level of epileptic patients from EEG signals. The parameters derived from the EEG signal are stored as data sets. Then the fuzzy technique is used to obtain the risk level from each epoch at every EEG channel. The objective was to classify perfect risk levels with high rate of classification, a short delay from onset, and a low false alarm rate. Though it is impossible to obtain a perfect performance in all these conditions, some compromises have been made. As a high false alarm rate ruins the effectiveness of the system, a low false-alarm rate is most important. SVM optimization techniques are used to optimize the risk level by incorporating the above goals. The classification rate of epilepsy risk level of above 98% is possible in our method. The missed classification is almost 1.458 for a short delay of 2.031 seconds. The number of cases from the present twenty patients has to be increased for better testing of the system. From this method we can infer the occurrence of High-risk
Also optimizing each region’s data separately can solve the focal epilepsy problem. The future research is in the direction of a comparison of SVM between heuristic MLP and Elman neural network optimization models.
ACKNOWLEDGMENT
It is our great pleasure to express out deepest sense of gratitude to the Management, Principal of Bannari Amman Institute of Technology, Sathyamangalam, India. We wish to express our sincere thanks to Dr.Asokan, Neurologist, Sri Ramakrishna Hospitals, Coimbatore for providing the EEG signals of the patient
REFERENCES
[1] Pamela McCauley-Bell and Adedeji B.Badiru, “Fuzzy Modeling and Analytic Hierarchy Processing to Quantify Risk levels Associated with Occupational Injuries- Part I: The Development of Fuzzy-Linguistic Risk Levels”, IEEE Transaction on Fuzzy Systems, 1996,4 ( 2): 124-31.
[2] R.Harikumar, Dr. (Mrs). R.Sukanesh and P.A. Bharathi, “Genetic Algorithm Optimization of Fuzzy outputs for Classification of Epilepsy Risk Levels from EEG signals,” I.E. India Journal of Interdisciplinary panels, Vol.86, no.1, pp.12-20 May 2005.
[3] Donna L Hudson, “Fuzzy logic in Medical Expert Systems”, IEEE EMB Magazine, November/December 1994,13(6): 693-698.
[4] S.Haykin, “Neural networks a Comprehensive Foundation”, 2nd Ed. Prentice- Hall Inc. 1999.
[5] Mu-chun Su, Chien –Hsing Chou, “A modified version of the k-means clustering algorithm with a distance based on cluster symmetry”, IEEE Transactions on Pattern Analysis and Machine Intelligence June 2001, 23 (6): 674-680.
[6] Qing song, Wenjie Hu, and Wenfang Xie, “Robust Support Vector Machine With Bullet Hole Image Classification”, IEEE Transaction on SMC Part C, 2002,32 ( 4):440-448.
[7] Sathish Kumar, “Neural Networks, A Classroom Approach”, McGraw-Hill New York, 2004.
[8] Richard O. Duda, David G. Stroke and Peter E. Hart, “Pattern Classification”, 2nd Ed , A Wiley-Interscience Publication, John Wiley and Sons, Inc, 2003.
[9] Jehan Zeb Shah, Naomie bt Salim, “ Neural Networks and Support Vector Machines Based Bio-Activity Classification”, Proceedings of the 1st Conference on Natural Resources Engineering & Technology 2006, 24-25th July 2006: Putra Jaya, Malaysia, 484-491.
[10] V.Vapnik, “Statistical Learning Theory”, Wiely Chichester, GB,1998. [11] Mark van Gils, “Signal processing in prolonged EEG recordings
during intensive care”, IEEE EMB Magazine November/December 1997,16(6): 56-63.
Paramet ers
Fuzzy Techniqu
es Without Optimizat
ion
RBF SVM for gamma =1
RBF SVM for gamm a=50
RBF SVM for gamma =100
Polynom ial SVM Order=2
Perfect Classific ation
50 95.32 96.99 97.81 97.51
Missed Classific ation
20 0.52 --- 0.416 0.416
False Alarm
10 4.16 3.01 1.77 2.0826
Weighte d Delay in secs
4 1.937
6
1.939 1.98 1.9752
Perform ance Index
40 95.1 96.89 97.66 97.43
Sensitivi ty
83.33 95.82 96.99 98.22 97.91
Specifici ty
71.42 99.43 100 99.57 99.57
Quality Value
[image:6.595.43.281.257.517.2]