Volume 3, No. 2, March-April 2012
International Journal of Advanced Research in Computer Science
RESEARCH PAPER
Available Online at www.ijarcs.info
ISSN No. 0976-5697
Mapping Concept of Equitable Regional Develoment Using C4.5 Classification Method
Tb. Ai Munandar*
Information Technology Faculty – Informatics Eng. Dept Universitas Serang Raya (UNSERA)
Banten Province - INDONESIA [email protected]
Harsiti
Information Technology Faculty – Information Syst. Dept Universitas Serang Raya (UNSERA)
Banten Province - INDONESIA [email protected]
Roy Amrullah Ritonga
Information Technology Faculty – Informatics Eng. Dept Universitas Serang Raya (UNSERA)
Banten Province - INDONESIA [email protected]
Abstract: The concept of data mining has now been developed in various disciplines to conduct excavations on a number of data so as to produce useful new information in the process of decision support. In this study discussed the application of data mining concepts of statistical data in the province of Banten - Indonesia to determine the level of development of an area or district. C.45 classification method used in this study to analyze statistical data and Banten province to develop an equitable application of the concept of web-based regional development. The final results of this study form a concept map applications web-based distribution of development that is able to analyze a number of statistical data that consists of four indicators, namely, human development index, education index, gross domestic income and the population so that applications can be developed to identify the two counties that still require special handling of the provincial government, namely Pandeglang and Lebak. The results of this identification that can be used as a reference for the head area of decision support to determine the future work program in relation to the distribution of development.
Keywords: data mining, equitable development, classification C4.5, decision support, statistical data
I. INTRODUCTION
The concept of data mining is increasingly being used in various fields both in the application process technology and academic research as a method of processing data to determine the quality of graduate students an educational institution or, to determine the curriculum needs to be applicable in the future [1],[2],[3],[4],[5],[6]. In the health sector, data mining is widely used especially in the decision support process to determine the symptoms or certain types of diseases. This is done in order to improve health services in hospitals [7], [8], [9], [10], [11], [12], [13], [14].
Data mining evolved in the field of internet and data stream mining to detect the presence of internet worms as well as online transactions are illegal [15],[16],[17],[18],[19],[20]. In the field of agriculture, the concept of data mining is used to perform classification of farmland and classification of plant species and attributes of the mushrooms [21], [22]. While in the field of transportation, data mining is used to manage scheduling system bus as it did in the southeastern U.S [23].
There are many other areas that are developed by adopting the concept of data mining, decision support systems and geographic information systems. For example, in the East Kutai Regency of Kalimantan, adopting the concept of data mining to support the performance of government employees to be more effective and efficient [24]. By looking at the development of data mining, research and develop data mining to analyze statistical data to determine the level of government distribution of development.
II. LITERATURE REVIEW
A. Concept Of Development:
Development as a concept of political, economic and social development in the direct process of a nation's desired changes will involve all the thinking, science and technology. The 21st century is marked by rapid changes in various aspects of human life, as a result of the development of Information Technology. The implication, in the planned change effort, known as development, social and cultural issues, socioeconomic and political science will be merged in a single study that is in the realm of Sociology and Anthropology. Development issues not only refer to quality aspects, but also quantity.
Development is defined as a series of measures planned and implemented by governments, agencies or international organizations; national or local is manifested in the forms of policies, programs, or projects, which are planned to change the ways of life or culture of a society so that citizens can live better or more prosperous than before the existence of such development [25].
B. Data Mining:
subsequent decisions based on knowledge gained. On the concept of mathematical learning theory provided a variety of mathematical models that can be used for the analysis of the data mining process to generate new knowledge.
Data mining process is divided into two main parts, namely, interpretation and prediction. Interpretation is more focused on identifying the patterns of data mining to obtain the rules and criteria are easy to understand. The resulting rules have to be original and important, especially in understanding the rules and the emergence of new knowledge resulting from the processing of data mining. While the prediction is to anticipate the value of a random variable so as to estimate the possibilities that will happen in the future.
C. C4.5 Classification Method:
C45 algorithm uses the fact that each data attribute can be used to make the decision to divide the data into smaller subsets. To make decisions, use the attribute with highest information gain. Attributes to be predicted is known as the dependent variable, because its value depends on, the values of all other attributes that help in predicting the dependent variable, known as independent variables in the dataset.
C45 follows the decision tree algorithm follows a simple algorithm. To classify a new item, it first needs to make a decision tree based on the values of the attributes of the available datasets. Thus, every time I meet a set of items (training set) will identify the attributes of the clearest examples is based on the highest information gain. Now, if the data value of the ambiguity is not found, then the search will end at the branch and set it as the value of the goods.
The following is the algorithm used in the C45 to construct a decision tree, select the attribute as the root, create a branch for each value, for cases in branch and repeat this process for each branch until all branches have cases in the same class. To select an attribute as the root based on the highest gain value from existing attributes. Formula used to calculate the gain as shown in the formula below:
∑
= − = n i i i S Entropy S S S Entropy A S Gain 1 ) ( * | | | | ) ( ) , ( (1) Where:S : The set of case A : Attribute
n : Number of Partition Attribute A | Si | : Number of Cases In The Partition - i | S | : Number of cases in S
As for the calculation of entropy values, we can use the equation below: pi pi S Entropy n i * log * ) ( 1 2
∑
= − = (2) Where:S: The set of case n: number of partitions S pi: The proportion of S
III. DATA DEFINITION
Instrument data used in this study are the data from the Central Statistics Agency (BPS) Banten Province who was taken in the period from 2002 to 2009 and has been classified in accordance with the needs of research. The indicator data are used as follows:
a. Data Human Development Index (HDI), both the district and provincial levels of Banten.
b. Education Index Data (EID), both the district and provincial levels of Banten.
c. Gross Regional Domestic Product (GDP), both the district and provincial levels of Banten.
d. The number of population, both the district and provincial offerings in accordance with the timeframe used in this study.
The fourth data above serve as the test attribute is again classified into sub-attributes for each attribute that is in accordance with the specified criteria.
IV.RESEARCH METHOD
C4.5 classification method used in this study to analyze the statistical data Banten province. Before the analysis phase, there are steps included research done collecting and classifying data phase, phase analysis using the C45 classification and stage of development, including software requirements analysis, design, coding to testing phase to some system functionality is developed.
V. DESIGN SYSTEM
In design system we will present the functionality of the system, hierarchy of the system and describes some example of design system of the application.
A. Functionality of the System:
In general, applications are developed to have the functionality of the system as follows:
a) Function Login.
This function is used by user applications to be included in the system to be used.
b) Data Display Function Testing.
This function is used to display test data obtained from the primary statistical data.
c) Display Function Classification Rules.
This function is used to display data classification rules that formed after a search of classification rules.
d) Data Display Function Area Statistics
This function used to display statistical data per district / region Banten province.
e) Display functions of the Provincial Statistics
This function is used to display statistical data Banten province, the data retrieved from the primary statistical data being entered or updated by the employee.
f) Primary Data Management function
This function is used to manage the primary data. g) District Info Data Management function.
This function is used to manage data classification rules. h) Search Function Classification Rules.
This function is used to manage and analyze data using data mining and J48 algorithm approach by supporting the decision which will generate new information classification rules based on the initial data (primary data).
This function is used to manage test data using the rules of classification training that has been previously established.
j) User Configuration functions.
This function is used to manage data user has access to the application. This function is intended only super user (decision maker).
k) The System Configuration functions.
This function is used to manage application information, including, application name, logo, information the user's applications and so forth.
l) Profile Change and Password function.
This function is used to make changes to user data information and replacement Password.
m) Exit function.
This function is used to exit the application PKP2W.
B. Hierarchy of System:
[image:3.612.338.576.139.293.2]Applications built consist of 17 hierarchies that start from P00 to P16. Each one shows the menu hierarchy in the system being developed, as shown in Figure 1 with a description of each code hierarchy is shown by Table 1.
Figure 1 Hierarchy System
Table 1 Hierarchy Code Information
Code Information
P00 Menu Utama (Main Menu)
P01 Login
P02 Page Depan (Home)
P03 Display Data Pengujian (Display Testing Data)
P04 Display Aturan Klasifikasi (Display Classification Rules) P05 Display Data Statistik Wilayah (Display Area Statistic Data)
P06 Display Data Statistik Provinsi (Display Province Statistic Data) P07 Penelusuran Aturan Klasifikasi (Classification Rule Search) P08 Testing Data (Data Testing)
P09 Pengelolaan Data Primer (Management of Primary Data0 P10 Pengelolaan Info Kabupaten (Management District Info) P11 Konfigurasi Sistem (System Configurations)
P12 Konfigurasi User (User Configurations)
P13 Ubah Profil dan Password (Profile and Password Edit) P14 Pencarian Data (Search)
P15 Petunjuk Penggunaan (Help) P16 Keluar (Exit)
C. Sample of Design System:
This section presents an example of one design of the application developed. Figure 2 shows the view page to display data statistics of a region.
Figure 2 is a plan view for the Data Display Area Statistics page whose function is to display the statistics of a region in the form of tables and graphs.
Figure 2 Design of System
VI.RESULT AND DISCUSSION
A. C4.5 Classification Analysis:
The next research step is to do the entire process of data mining to produce a number of data as primary data research and grouped into each of the three sub-attributes, namely, LOW, MEDIUM and HIGH. Primary data is then analyzed using a typology Klassen to determine the level of development of an area based on the indicator used. Results of analysis of a set of Klassen's typology of learning data will be analyzed using the C4.5 classification.
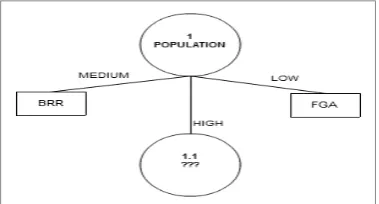
Primary data has been obtained, represented in the form table for more detailed calculations. The initial step decision tree search begins by finding the value of the entropy and the gain of each attribute to look for the highest gain value as the initial node. To calculate entropy and gain value we can use equation (1) and (2).
[image:3.612.61.263.311.493.2]The first calculation results show that the highest gain value of the attribute is owned by POPULATION, which is equal to 1.0882, so that it automatically POPULATION into the root node in this case. While the LOW and MEDIUM attribute value is automatically classify cases into one, so that by looking at the odds of cases against the main class, LOW has a decision FGA and MEDIUM has BRR decision. For attribute values HIGH, still requires the calculation again. While the decision tree as shown in figure 2.
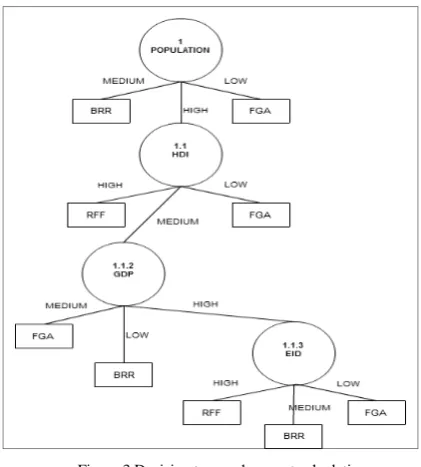
[image:3.612.363.553.617.719.2]Calculation of the gain and the entropy continues until no more could be done in accordance with the sequence search algorithm, so that the final decision tree to be like that shown in Figure 3.
Figure 3 Decision tree node recent calculations
[image:4.612.49.260.104.338.2]From the results of this analysis are then built a web-based application to verify the analysis results with existing algorithms C45. Stages of application development is done by making the analysis and design of application systems, the need for coding functionality to the testing phase. The general picture of the system developed can be seen in the context diagram level 0 as follows (see figure 4):
Figure 4 Context diagram of PKP2W
B. Implementation Result:
Applications built using the programming language PHP with MYSQL database. Interface design using the technique of cascading style sheets (CSS) and Macromedia Fireworks to handle some additional design, while writing code using Notepad + + tool.
This section presents the results of the implementation of application development. Implementation will only show some of the views of the applications have been built like that on show in Figure 5, 6 and 7.
Home page (see Figure 5) will appear if the user (both decision support and user) login process. It should be noted;
that the menus are displayed on the Home will be different between the supporters of the decision by the user. The system has divided the menu into the specific access rights by type of user.
Figure 5 Home Page (Page Depan)
[image:4.612.337.561.391.604.2]Data Display Area Statistics page (Page Data Statistik Wilayah) (see Figure 6) is a page that contains information on statistics of an area, either in table or graphical format. Data is displayed in the order of data. This page appears when a user (both the decision maker and the user) choose the Display Data Area Statistics menu in the menu on the left side.
Figure 6 Data Display Area Statistic Page
In order to display statistical data specific region, the user must select the name that will be displayed and then press the Show button (Tampilkan Data).
[image:4.612.42.282.434.569.2]Handling. In addition, this page will also feature profiles of the territory, along with the development of information HDI and GDP statistical data in graphical form.
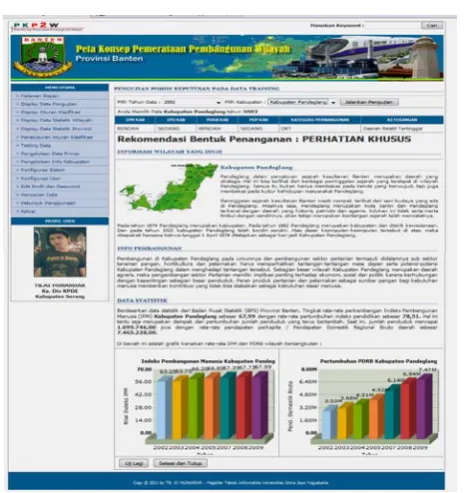
[image:5.612.49.282.120.367.2]To display the test results, user must select the year and name of the data to be tested, followed by pressing the Run Tests Button (Jalankan Pengujian).
Figure 7 Training Data Testing Results Page
C. Testing Of Classification Rules To The Data Set: Tests on the training data is intended to determine the level of accuracy of the classification rules are formed through the search. In the first test, without random sampling, the accuracy values obtained for 77.78%. In the second testing training data taken over four years and obtained values of 75.00% accuracy. While the third test, by taking samples of the first three data for each year of data, obtained values of 94.44% testing accuracy. Last test for the second phase, carried out by taking the first four data for each year of testing data, the accuracy values obtained for 79.17%. From the test results can be seen that the level of accuracy reached 94.44% classification rules (see table 2)
Table 2 Table Test Data
Number
Testing Sum Data Score
Percent accuracy
I 36 28 77.78%
II 24 18 75.00%
III 18 17 94.44%
IV 24 19 79.17%
VII.CONCLUSION
This study successfully developed a concept map application development distribution area (PKP2W) with the concept of data mining algorithm C4.5. Applications are developed to provide a specific treatment recommendation forms to the district according to the existing statistical data. In addition, the application is also able to identify the two counties that still require special handling, namely Pandeglang and Lebak
VIII.REFERENCES
[1]. Ayesha, Shaeela., Mustafa, Tasleem., Sattar, Raza, Ahsan., Khan, Inayat, M., 2010, Data Mining Model for Higher Education System, EuroJurnal Publishing, Volume : 43, Number : 1, Page : 24 – 29
[2]. Delavari, Naeimeh., Phon-Amnuaisuk, Somnuk., Beikzadeh, Reza, Mohammad., 2008, Data Mining Application in Higher Learning Institutions, Journal of Institute of Mathematics and Informatics, Vilnius, Volume : 7, Number : 1, Page : 31 – 54 [3]. Usharani, C., Chandrasekaran, Rm., 2010, Course Planing of
Higher Education to Meet Market Demand by Using Data Mining Techniques – a case of Technical University in India, Journal of IACSIT, Volume : 2, Number : 5, Page : 809 – 814 [4]. Romero, C., Ventura, S., 2006, Educational Data Mining : A Survey From 1995 - 2005, ELSEVIER SCIENCE, Volume : 33, Page : 135 – 146
[5]. Romero, Cristobal., Ventura, Sebastian., Garcia, Enrique., 2007, Data Mining in Course Management Systems:Moodle Case Study and Tutorial, ELSEVIER SCIENCE, Page : 1 – 19
[6]. Al-Radaideh, A, Qasem., Al-Shawakfa, M, Emad., Al-Najjar, I, Mustafa., 2006, Mining Student Data Using Decision Trees, Journal of ACIT, Page : 1 – 5
[7]. Chao, Sam., Wong, Fai., 2009, An Incremental Decision Tree Learning Methodology Regarding Attributes in Medical Data Mining, Journal of IEEE, Page : 1694 -1699
[8]. Baepler, Paul., Murdoch, James, Cynthia., 2010, Academic Anayitics and Data Mining in Higher Education, International Journal for The Schoolarship of Teaching and Learning, Volume : 4, Number : 2, Page : 1 – 9
[9]. Palaniappan, Sellappan., Awang, Rafiah., 2008, Intelligent Heart Disease Prediction System Using Data Mining Techniques, Journal of IJCSNS, Volume : 8, Number : 8, Page : 343 – 350
[10]. Palaniappan, Sellappan., Ling, Sook, Chua., 2008, Clinical Desicion Support Using OLAP With Data Mining, Journal of IJCSNS, Volume : 8, Number : 9, Page : 290 – 296
[11]. Ranjan, Jayanti., 2007, Applications of Data Mining Techniques in Pharmaceutical Industry, Journal of JATIT, Page : 61 – 67
[12]. Shekar, Chandra, D.V., Srinivas, Sesha, V., 2008, Clinincal Data Mining – An Approach for Identification of Refractive Errors. Journal of IMECS, Volume : 1, Page : 1 – 5
[13]. Khan, Shahbaz, Fahad., Anwer, Muhammad, Rao., Torgersson, Olof., Falkman, Goran., 2008, Data Mining in Oral Medicine Using Decision Trees, International Journal of Biological and Life Sciences, Volume : 4, Number : 3, Page : 156 – 161
[14]. Segall, S, Richard., Pierce, M, Ryan., 2009, Advance Data Mining of Leukimia Cells Micro-Array, Journal of Systemics, Cybernetics and Informatics, Volume : 7, Number : 6, Page : 31 – 54
[15]. Minegishi, Tatsuya., Ise, Masayuki., Niimi, Ayahiko., Konishi, Osamu., 2009, Extention of Decision Tree Algorithm for Stream Data Mining Using Real Data, Journal of IEEE SMC Hiroshima Chapter, Page : 208 – 212
[16]. Andersen, G, David., Feamster, Nick., 2006, Challenges and Opportunities in Internet Data Mining, Journal of Parallel Data Laboratory Carnegie Mellon University, Page : 1- 10 [17]. Ikonomovska, Elena., Loskovsa, Suzana., Gjorgjevik, Dejan.,
[image:5.612.49.276.557.638.2][18]. Leu, Fang-Yie., Hu, Kai-Wei., 2008, A Real Time Intrusion Detection System Using Data Mining Technique, Journal of Systemics, Cybernetics and Informatics, Volume : 6, Number : 2, Page : 36 – 41
[19]. Ismail, Ismahani., Marsono, Nadzir, Muhammad., Nor, Mohd, Sulaiman., 2010, Detecting Worms Using Data Mining Techniques : Learning in The Presence of Class Noise, Journal of IEEE Computer Society, Volume : 10, Page : 187 – 194
[20]. Siddiqui, Muazzam., Wang, C, Morgan., Lee, Joohan., 2009, Detecting Internet Worms Using Data Mining Techniques, Journal of Systemics, Cybernetics and Informatics, Volume : 6, Number : 6, Page : 48 – 53
[21]. Bhargavi, P., Jyothi, S., 2009, Applying Naive Bayes Data Mining Technique for Classification of Agricultural Land Soils, Journal of IJCSNS, Volume : 9, Number : 8, Page : 117 – 122
[22]. Eusebi, Clara., Gliga, Cosmin., John, Deepa., Maisonave, Andre., 2008, Data Mining on Mushroom Database, Journal of CSIS, Pace University, Page : 1 – 9
[23]. Patnaik, Jayakrihsna., Chien, Steven., Bladikas, Athanassios., 2006, Using Data Mining Techniques on APC Data to Develop Effective Bus Scheduling Plans, Journal of Systemics, Cybernetics and Informatics, Volume : 4, Number : 1, Page : 86 – 90
[24]. Shalahuddin, Muhammad., 2005, Penggunaan Data Mining Untuk Perencanaan Pembangunan Daerah, dalam at bahasa.