Western University Western University
Scholarship@Western
Scholarship@Western
Electronic Thesis and Dissertation Repository
8-11-2017 2:30 PM
Bubble Dynamics and Bed Expansion for Single-Component and
Bubble Dynamics and Bed Expansion for Single-Component and
Binary Gas-Solid Fluidization Systems
Binary Gas-Solid Fluidization Systems
Bowen Han
The University of Western Ontario
Supervisor Jesse Zhu
The University of Western Ontario Co-Supervisor Shahzad Barghi
The University of Western Ontario
Graduate Program in Chemical and Biochemical Engineering
A thesis submitted in partial fulfillment of the requirements for the degree in Master of Engineering Science
© Bowen Han 2017
Follow this and additional works at: https://ir.lib.uwo.ca/etd
Part of the Complex Fluids Commons
Recommended Citation Recommended Citation
Han, Bowen, "Bubble Dynamics and Bed Expansion for Single-Component and Binary Gas-Solid Fluidization Systems" (2017). Electronic Thesis and Dissertation Repository. 4787.
https://ir.lib.uwo.ca/etd/4787
This Dissertation/Thesis is brought to you for free and open access by Scholarship@Western. It has been accepted for inclusion in Electronic Thesis and Dissertation Repository by an authorized administrator of
i
Abstract
Gas-solid fluidized beds are widely used in industrial dry coal preparation to separate waste
from coal (still a primarily important energy source worldwide). It is the density difference
between coal and the waste that enables the separation. Experiments were carried out in a two
dimensional gas-solid fluidized bed. Filtered air at room temperature was used as the
fluidizing gas, while magnetite, sand (two types) and FCC catalyst particles belonging to
Geldart groups A and B were used as bed particles. Image processing and Matlab were
applied for bubble size and velocity measurements. Bubble properties and bed expansion in
fluidized beds of four single-component particles and binary systems were studied. Bubble
size and bubble rise velocity were found to be proportional to the distance above the gas
distributor and excess gas velocity. Bubble diameter is reduced by the addition of lighter and
smaller particles in a binary system. In addition, a new empirical correlation for estimation of
bubble diameter was proposed for single-component and binary fluidization systems. The
results were in good agreement with the experimental data.
Keywords
Coal beneficiation, two-dimensional gas-solid fluidized bed, image processing, bubble size,
ii
Acknowledgements
Foremost, I would like to express my sincerest gratitude and deepest appreciation to my
supervisor Dr. Jesse Zhu for his continuous dedication to my project. Thanks for the amazing
project and generous support, continuous invaluable help during this project.
The appreciation is extended to my co-supervisor Dr. Shahzad Barghi for his valuable
guidance, discussion and support over the research and writing of this thesis. His professional
experience solved many problems and helped throughout the peoject.
I would like to thank Mr. Jianzhang Wen for the assistance of experiment setup and Dr.
Xiaoyang Wei and Dr. Zhijie Fu for their help in Matlab and valuable suggestions for my
project. Special gratitude is given to Mr. Xiangwei Kong and Mr. Boyu Jiang for their
precious help in data analysis. I also would like to take this opportunity to say thanks to my
group mates: Zhi Zhang, Tang Li, Danni Bao, Tian Nan, Haolong Wang, Lin Wang, Zhehao
Jing, Zhuoqing An, Yupan Yun, Yandy Zhou, Nengze Sun, Bhuiyan Mohammad, Wenjun
Luo, Wei Liu, Xiliang Sun and Jiaqi Huang for their support and friendship.
The deepest gratitude goes to my parents and other family members for encouraging me to go
to study here and caring about me in my life. Thank you for supporting me and being around
iii
Table of Content
Abstract ... i
Acknowledgements ... ii
Table of Content ... iii
List of Figures ... vi
List of Tables ... viii
Chapter 1, Introduction and objectives ... 1
1.1 The importance of coal separation ... 1
1.2 Gas-solid fluidization technology applied in dry coal separation ... 2
1.3 Objectives ... 5
1.4 Thesis structure ... 5
Reference ... 7
Chapter 2 Bubble dynamics in 2-D gas-solid fluidized bed ... 8
2.1 Introduction ... 8
2.1.1 Bubble size ... 9
2.1.2 Bubble rise velocity ... 11
2.2 Experimental ... 12
2.2.1 Experimental set-up ... 12
2.2.2 Experimental Methods ... 14
2.3 Results and Discussions ... 16
2.3.1 The minimum fluidization velocity (Umf) ... 16
iv
2.3.3 Bubble size evolution ... 20
2.3.4 Comparison of bubble diameter ... 23
2.3.5 Bubble rise velocity ... 24
2.3.6 Bed expansion ... 28
2.3.7 Development of a new correlation for bubble diameter by the modification of Darton’s equation ... 34
2.3.8 Estimation of the bed density ... 36
2.4 Conclusions ... 37
Nomenclature ... 39
Reference ... 41
Chapter 3 Bubble dynamics and bed expansion in binary gas-solid fluidization ... 42
3.1 Introduction ... 43
3.2 Experimental set-up and methods ... 45
3.2.1 Experimental set-up ... 45
3.2.2 Image processing ... 47
3.2.3 Bubble size ... 49
3.2.4 Bubble rising velocity ... 49
3.3 Results ... 49
3.3.1 The minimum fluidization velocity (Umf) ... 49
3.3.2 Bubble size evolution ... 53
3.3.3 Bubble rise velocity ... 61
v
3.3.5 Bed density estimation of binary gas-solid fluidization systems ... 71
3.4 Conclusions ... 73
Nomenclature ... 75
Reference ... 77
Chapter 4 General conclusions ... 79
Reference ... 82
vi
List of Figures
Figure 1.1 Primary energy world consumption 2015 ---1
Figure 1.2 Primary energy regional consumption by fuel 2015---2
Figure 1.3 Forces acting on a single particle---3
Figure 1.4 The diagram of phases in a gas-solid fluidized bed---4
Figure 2.1 Geldart’s Powder Classification---10
Figure 2.2. Schematic diagram of experimental equipment---13
Figure 2.3 Image processing procedure: (a) Original RGB image (b) Gray image (c) Binary image (d) Image with circles---15
Figure 2.4 Pressure drop as a function of superficial gas velocity---16
Figure 2.5 Bubble diameter growth as a function of bed height and bed width---20
Figure 2.6 Bubble diameter De evolution as a function of the distance above gas distributor H for varying superficial gas velocities---21
Figure 2.7 Bubble diameter De as a function of ungassed bed height Ho---22
Figure 2.8 Bubble diameter De as a function of bed height H---22
Figure 2.9 Bubble diameter evolution with the distance above gas distributor---24
Figure 2.10 Bubble rise velocity as a function of the distance above gas distributor---25
Figure 2.11 Bubble rise velocities of different particles---25
Figure 2.12 Bubble rising velocity as a function of bubble diameter---26
Figure 2.13 Forces acting on a single bubble---27
Figure 2.14 Direct observation-Bed expansion as a function of excess gas velocity---28
vii
Figure 2.16 Bed expansion e3 as a function of excess gas velocity (U-Umf)---31
Figure 2.17 Bed expansion e4 as a function of excess gas velocity (U-Umf)---33
Figure 2.18 Comparison of experimental bubble diameter and predicted bubble diameter---36
Figure 3.1. Schematic diagram of experimental equipment---46
Figure 3.2 Image processing procedure: (a) Original RGB image (b) Gray image (c) Binary image (d) Image with circles---48
Figure 3.3 Pressure drop as a function of superficial gas velocity---50
Figure 3.4 The minimum fluidization velocities of binary mixtures---51
Figure 3.5 Bubble size of binary mixtures as a function of the distance above gas distributor---56
Figure 3.6 Bubble size of single-component particles and binary mixtures---58
Figure 3.7 Bubble distribution of magnetite and binary mixture (sand 20%)---59
Figure 3.8 Bubble diameters calculated from equation (10) compared with experimental data---61
Figure 3.9 Bubble rise velocity as a function of the distance above gas distributor---63
Figure 3.10 A comparison of bubble rise velocities between mixtures and single-component particles---64
Figure 3.11 Bed expansion e1 as a function of excess gas velocity---65
Figure 3.12 Bed expansion e2 as a function of excess gas velocity---65
Figure 3.13 Bed expansion e3 as a function of excess gas velocity---68
viii
List of Tables
Table 2.1 Properties of particles---13
Table 2.2 Correlations for minimum fluidization velocity---18
Table 2.3 Comparison between experimental bed expansion and theoretical bed
expansion---33
Table 3.1 Properties of particles and binary mixtures---47
Table 3.2 Correlations for minimum fluidization velocity---52
Table 3.3 Comparison between experimental bed expansion and theoretical bed
1
Chapter 1, Introduction and objectives
1.1 The importance of coal separation
Coal is still important as a steadily available source of energy worldwide due to its vast
underground resources. Figure 1.1 shows that coal’s market share fell to the lowest level 29.2%
in 2005, but still ranking the second largest energy source. Moreover, Figure 1.2 illustrates that
coal is the dominant fuel in the Asia Pacific region, accounting for 51% of regional energy
consumption - the highest share of any fuel for any region (BP Statistical Review of World
Energy).
Therefore, coal cleaning technology is becoming increasingly important to produce high
quality coal and reduce emission of air pollutants. In the near future, dry coal separation
technology is expected to be the dominant method, replacing the tradidional wet cleaning
technology.
2
Figure 1.2 Primary energy regional consumption by fuel 2015 (percentage) (BP Statistical Review of World Energy).
1.2 Gas-solid fluidization technology applied in dry coal separation
Wet cleaning technology for coal beneficiation had been dominant for the last five decades due
to its high separation efficiency (Yang et al. 2016). However, wet cleaning process requires a
large quantity of water, which is becoming increasingly scarce for people living near coal mines
due to serious water contamination. As an alternative method, dry coal separation technology
exhibits the most important advantage over wet cleaning process-no need for water. The first
fluidized bed applied for coal separation was conducted in a lab utilizing river sand as the
medium solids to separate gangue from coal (Fraser and Yancey 1926). A mixture of fine
magnetite powder and sand particles was also used as the fluidizing medium (lohn 1971). The
density of this mixture is lower than that of magnetite but higher than that of sand particles.
Warren Spring Laboratory (1966) invented a fluidized bed with an inclined vibratory trough,
3
(Beeckmans and Minh 1977) at Western University (UWO) developed a counter-current
fluidized bed cascade (CCFC) system to separate sand from coal. Recently, an air-dense
medium-fluidized bed (ASMFB) designed at China University of Mining and Technology
(1994) has been widely studied due to its high efficiency.
The fluidizing medium inside a gas-solid fluidized bed behaves like a liquid, which allows
particles heavier than the medium to sink to the bottom and particles lighter than the medium
to float to the surface. The Archimedes’ principle perfectly explains this separation
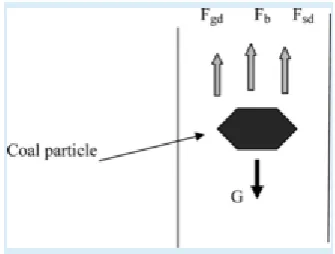
mechanism based on the analysis of various forces acting on the particles as shown in Figure
1.3.
Figure 1.3 Forces acting on a single particle.
where G is the gravity force, Fb is the buoyant force, Fgd is the friction drag force of air and
Fsd is the drag force of dense medium.
The density difference between medium solids and feed particles enables this physical gravity
separation. Therefore, the density of the medium solids plays a vital role in the separation
process. Moreover, the uniformity of bed density can ensure a high separation efficiency,
which is difficult to achieve due to the non-uniformity of bed density caused by bubbles.
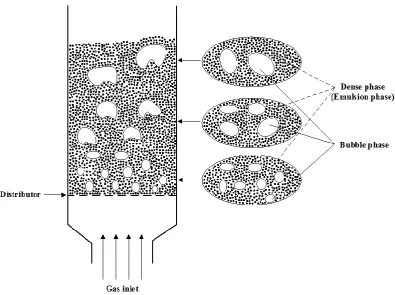
Based on the two-phase theory of gas-solid fluidization shown in Figure 1.4 (Davidson and
4
significantly different properties.
Figure 1.4 The diagram of phases in a gas-solid fluidized bed.
Bubbles inside the fluidized bed continue to rise to the surface from the gas distributor, carrying
solid particles in their wake, which results in non-uniformity of the bed density. Solids mixing
is crucial in coal beneficiation to ensure an efficient separation. Such mixing is induced by
bubbles motion, breakage and coalescence. Particles are dragged upward in the bubbles wake
while particles in the emulsion phase fall downward along the bubble walls. Particles fall in
boundary layer formed around the bubble, however the irregular shape of the bubbles make it
difficult to accurately determine the particles flow quantitatively. Study of particles
micro-mixing which is related to boundary layer and interaction between the gas and particles as well
5
The medium solids usually are comprised of single-component particles with higher density
to proceed the separation, which significantly affects the range of choices of feed coal. In
order to lower the density of medium solids, binary mixtures of particles were introduced.
1.3 Objectives
Corresponding to the non-uniformity of bed density, the bubble behavior in a
two-dimensional gas-solid fluidized bed using different particles is of main concern in this study,
aimed to reach the following objectives:
The relationship between bubble size and particle type, particle size, ungassed bed height
and distance above gas distributor.
The variation of bubble size and bubble velocity at different operating conditions.
A new correlation for estimation of bubble diameter for
single-component and binary fluidization systems.
Develop a method to determine the bed density for single-component and binary
fluidization systems.
1.4 Thesis structure
This thesis consists of four chapters and follows the ‘monograph’ format as outlined by the
Master’s Programs of GENERAL THESIS REGULATIONS by the School of Graduate and
Postdoctoral Studies (SGPS) at the University of Western Ontario (UWO). A summary of
each chapter is provided below.
Chapter 1 consists of general introduction and literature review, including industrial
6
bubble dynamics are elaborated.
Chapter 2 is focusing on the study of bubble properties in 2-D gas-solid fluidized beds with
single-component particles. Details about experiment and image processing technology are
provided.
Chapter 3 reports the bubble dynamics in 2-D gas-solid fluidized bed with binary mixtures.
The variation of bubble size in binary mixtures is presented.
Chapter 4 provides general conclusions. The first part is conclusions of bubble properties as a
function of particle type, particles size, ungassed bed height and the height above the gas
distributor. A new correlation for estimation of bubble diameter was also proposed in the first
part. The second part is comprehensive studies of bubble dynamics and bed expansion in
7
Reference
BP Statistical Review of World Energy 2016, BP, London 2016.
Beeckmans, J. M. and T. Minh (1977), Separation of mixed granular solids using the
fluidized counter-current cascade principle, The Canadian Journal of Chemical Engineering 55: 493-496.
Chen Q. R. and Y. F. Yang(1994), Development of dry beneficiation of coal in China, Coal preparation 23: 3-12.
Douglas, E. and T. Walsh (1966), New type of dry heavy medium gravity separator, Transactions of the Institute of Mining and Metallurgy 75C: 226–232.
Davidson, J. F. and D. Harrison (1963), Fluidized particles, Cambridge university press.
Fraser, J. and H. F. Yancey (1926), Artificial storm of air-sand floats coal on its upper surface, leaving refuse to sink, Coal Age 29: 325-327.
Lohn, P. (1971), Fluidized bed heavy medium separation-A modern dry separation procedure, Aufbereitung Technik 3: 140-146.
8
Chapter 2 Bubble dynamics in 2-D gas-solid fluidized bed
2.1 Introduction
Gas-solid fluidization technology has been widely used in different processes, such as fluid
catalytic cracking, fluidized bed combustion, coating and dry coal separation. Among these
applications, dry coal beneficiation exhibits remarkable advantages over wet cleaning
technology, such as no need for water, less air pollution, no slurry treatment and so on (Dwari
and Rao 2007, Houwelingen and Jong 2004). Density difference as the basic principle
perfectly explains this physical separation. Particles relatively heavier than the bed medium
sink towards the bottom of the bed, while particles lighter than the bed float to the bed
surface (Sahu, Biswal and Parida 2009). Bubble behaviour has a significant effect on the
mass transfer, heat transfer, bed density and chemical reactions. Therefore, knowledge of
bubble dynamics is essential for improving efficiency of gas-solid fluidized bed for industrial
applications. Various measurement systems have been developed to determine the bubble
properties in fluidized beds, including different probes and photography. Several probe
measurement systems, belonging to intrusive measurement technologies, have been utilized
in recent years, which includes needle type capacitance probes (Werther and Molerus 1973),
optical probes (Yasui and Johnson 1958, Andreux and Chaouki 2005) and electro-resistivity
and conductivity probes (Park and Kang 1969). Photography technologies belonging to
non-intrusive measurement technologies, are mainly composed of direct photography (Geldart
1970), X-ray photography (Rowe and Partridge 1965) and electrical capacitance tomography
(Halow, Fasching, Nicoletti and Spenik 1993, McKeen and Pugsley 2003).
9
analysis technology. However, almost all of these studies used lights placed at the back of the
fluidized bed, while a camera was placed at front. In this case, fewer bubbles ware observed
due to the thickness of the bed. Another issue caused by the thickness is that particles
surrounding bubbles may decrease the visibility of the bubbles. 2D fluidized beds,
overcoming these shortcomings, have been widely used for investigations of bubble behavior
in recent years.
In this study, experiments for investigation of bubble properties in a two dimensional
gas-solid fluidized bed were conducted. The behaviour of bubbles was recorded and processed
using image processing technology. The objective of this work is to get bubble distribution,
bed expansion and bubble parameters as a function of the height, particle size, particle type,
and superficial gas velocity using image analysis.
2.1.1 Bubble size
When particles in a fluidized bed are fluidized by an upward flow of gas, bubbles are formed
by excess gas (the superficial gas velocity exceeding the minimum fluidization velocity).
Bubbles generated at the bottom rise through the bed to the surface. During this process,
bubbles continually coalesce and break up reaching a balance between them and evolve at
varying bubble diameter (Horio and Nonaka 1987).
Yasui and Johanson (1958) made the first attempt to study bubble dynamics in fluidized beds
using 4-in and 6-in columns. They derived an empirical correlation for predicting bubble
diameter from the experimental data directly measured using the light probe technique. Five
10
researchers who utilized image analysis technology to study bubble characteristics. Geldart
(1970) derived another formula of bubble size in a 3D bed from data collected from a 2D bed.
A transition of bubble diameter from 2D bed to 3D bed is needed, because their flow
dynamics are different (Ma, Liu and Chen 2015). Mori and Wen (1975) proposed a
correlation of bubble diameter and growth in fluidized beds. Furthermore, the bubble
diameters calculated from this correlation are in good agreement with the bubble sizes
observed. Darton’s equation (Darton et al. 1977) for bubble diameter has been the most
widely used by researchers due to its good coverage under all conditions. However, this
correlation excluded mechanism of bubbles splitting and breakage. Therefore, a continuously
increasing pattern of bubble diameter was obtained from their work (Karimipour and Pugsley
2011). However, in real cases, bubbles splitting and coalescence do exist and are of critical
importance for bubble size evolution. Horio and Wen (1977) pointed out that the equilibrium
bubble size should be the result of a balance between bubble coalescence and break up. For
the cases of group A particles (Geldart 1973, shown in Figure 2.1), splitting and breakage
occur in a high frequency in a fluidized bed of group A particles, which implies that the
correlation of Darton cannot provide the best coverage for group A particles.
10 100 1000 10000
11
Figure 2.1 Geldart’s Powder Classification.
Busciglio and Vella (2010) performed the investigation on bubble size distribution in a 2D
fluidized bed by means of image analysis technology. The same technology was also
employed by Ma et al. (2015) to study bubble behavior of large cohesive particles in a 2D
fluidized bed.
2.1.2 Bubble rise velocity
In recent years, compared to bubble size, fewer studies of bubble velocity have been
conducted by researchers. Davidson and Harrison (1963) developed the most widely used
equation for bubble velocity. Corresponding to this correlation, bubble rise velocity is
dominated by the bubble diameter. Another factor contributing to bubble velocity is the
excess gas velocity. Whitehead et al. (1967) measured the bubble rise velocity using an
optical probe in a 10 cm squared fluidized bed filled up with silica sands at varying excess
gas velocities. They found that average bubble velocity is proportional to the excess gas
velocity and bubbles rose faster in fine sand. Werther (1974) reported the existence of a
maximum bubble rise velocity in several cylinder beds using a needle capacitance probe.
Verma et al. (2014) investigated bubble rise velocity in a 3D fluidized bed with glass,
alumina and low linear density polyethylene (LLDPE) using X-ray tomography technology.
The experimental results of their work showed a good agreement with the simulations. They
also found that the LLDPE particles have higher bubble rise velocity compared to the data
12
2.2 Experimental
2.2.1 Experimental set-up
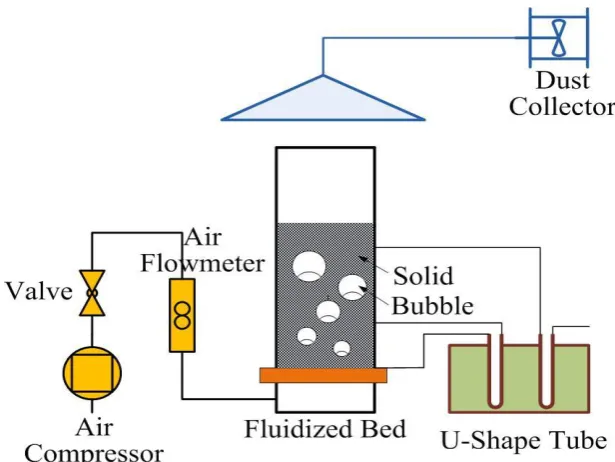
Figure 2.2 shows the schematic diagram of the experimental setup. The fluidized bed designed
for present study on bubble dynamics is made of Perspex (1500 mm height, 370 mm width and
thickness of 19 mm), which provides detail observation of bubble behaviors inside the bed.
There are three pressure measurement ports along the bed wall located at bed height of 0 mm,
180 mm and 550 mm. Two lights were placed in front of the fluidized bed to enhance the
contrast between the bubble and dense phases, allowing more small bubbles being visualized.
The bubble behaviors were recorded by a digital camera (Canon T3i), which was placed on the
opposite side of the bed. All videos were recorded at the steady state condition (complete
13
Figure 2.2. Schematic diagram of experimental equipment.
A sintered plastic gas distributor placed at the bottom of fluidized bed is designed with 10
micron holes. Below the gas distributor is the wind box used to ensure uniform distribution of
inlet gas across the distributor. Air was used as the fluidizing gas and controlled by three air
rotameters ranging from 0 m3/h to 5 m3/h.
Four types of particles were used at bed heights of 300 mm, 450 mm and 600 mm in the
fluidized bed. Particles were fluidized by the upward air at varying superficial gas velocities.
The excess gas velocities (defined as the difference between superficial gas velocity and
minimum fluidization velocity) were kept constant at 1.63 cm/s, 4.37 cm/s and 7.05 cm/s.
Other characteristics of particles have been summarized in Table 2.1. Geldart A particles and
Geldart B particles were used in the experiments, to cover a wider range of particles.
Table 2.1 Properties of particles
Particle type ρp (kg/m3) dp (μm) Geldart type
Magnetite 4650 150-300 B
14
Sand 2650 75-125 A/B
FCC catalyst 1540 75-125 A
2.2.2 Experimental Methods
2.2.2.1 Image processing
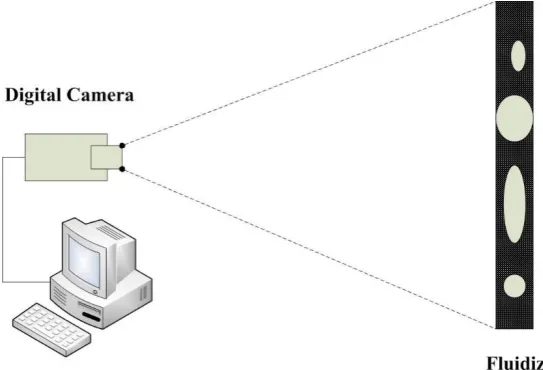
The bubble behavior in the fluidized bed was videotaped after steady state condition was
reached. The camera employed recorded video at a frequency of 29 Hz, which implies 29
frames per second. Each frame is a 1088 X 1920 pixel picture. The pixel ranging from 0 to
255 is called grey-value which indicates brightness. Grey-value 0 is black while grey-value
255 means white. Each position in the picture has its own grey-value. In this way, pictures are
transferred to a matrix, which can be analyzed using MATLAB (Matrix Laboratory).
The experimental procedure for image processing can be summarized into several steps : 1.
Split the video into consecutive frames. 2. Transfer original RGB images into grey images. 3.
Set a threshold to transfer grey images into binary images. 4. Do the subtraction of grey-value
between fluidizing particles images and ungassed particles image to determine bubble
properties. 5. Depict the contour of bubbles and obtain bubble characteristics applying a
package of software ‘Regionprops’. A video used as the base was recorded before air was
introduced into bed. Then grey-value’s difference between the base image and fluidizing
images of every position was obtained. A non-zero grey-value difference implies a position
where bubble exists due to different grey-values between dense phase and bubble phase.
15
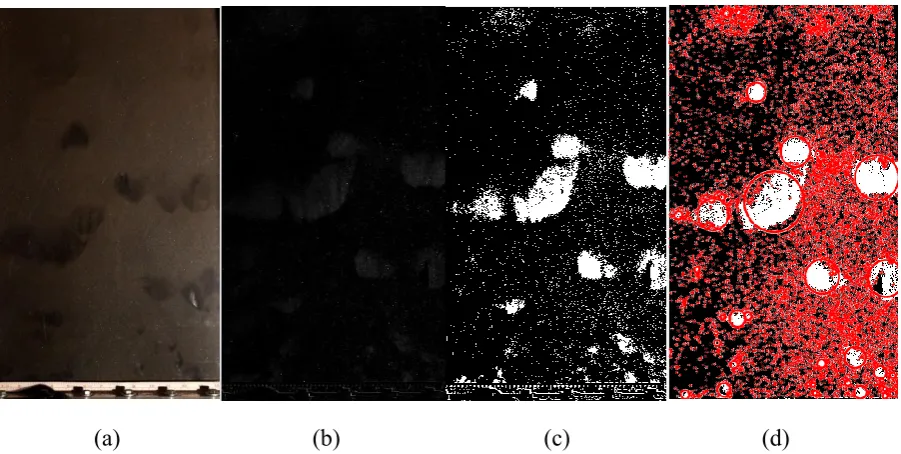
(a) (b) (c) (d)
Figure 2.3 Image processing procedure: (a) Original RGB image (b) Grey image (c) Binary image (d) Image with circles
2.2.2.2 Bubble size
The bubble phase was discriminated from the dense phase based on grey-value difference.
However, a threshold needs to be determined to improve the discrimination between these
two phases because of the disturb of noise points. In this study, the threshold was determined
to be 10 to exclude the impact of noise points. The area of a bubble (Ab) is the number of
pixels forming this bubble. Every single bubble was transformed into a circle with the same
area using a software called Regionprops. According to the bubble area, the equivalent
bubble diameter De can be calculated from the following equation:
𝐷𝑒 = 2√𝐴𝑏
𝜋 (1)
2.2.2.3 Bubble rise velocity
The camera applied in this investigation recorded videos of 29 frames per second. Therefore,
16
(xi, yi) of the bubble center in each frame can be determined automatically by the means of
image processing technology. In this way, the axial distance (yi-yi-1) that every single bubble
moves between every two consecutive frames was obtained. Then the bubble rising velocity
can be calculated from the following equation:
𝑢𝑏 = 𝑦𝑖−𝑦∆t𝑖−1 (2)
2.3 Results and Discussions
2.3.1 The minimum fluidization velocity (U
mf)
The minimum fluidization velocity is the fluid velocity at incipient fluidization of a packed
bed filled up with particles. It is a critical variable for designing fluidized beds. In this work,
the minimum fluidization velocity (Umf) is determined by measuring the pressure drop as a
function of superficial gas velocity (shown in Figure 2.3).
Figure 2.4 Pressure drop as a function of superficial gas velocity.
Pressure drop remainsalmostconstant after superficial gas velocity exceeds certain value.
This value is determined as the minimum fluidization velocity, at which the particles inside
17
have been reported, such as correlations of Narsimhan (1965), Wen and Yu (1966) and
Coltters and Rivas (2004). The equation of Wen and Yu for the minimum fluidization velocity
is described as follows:
𝐴𝑟 = 24.5𝑅𝑒𝑚𝑓2+ 1650𝑅𝑒𝑚𝑓 (3)
where
𝐴𝑟 = 𝑑3𝜌
𝑔(ρ𝑝− ρ𝑔)𝜇𝑔2 (4)
𝑅𝑒𝑚𝑓 =𝑑ρ𝑔𝜇𝑢𝑚𝑓 (5)
The correlation of Coltters and Rivas for the minimum fluidization velocity is given by
𝑈𝑚𝑓 = K𝑋𝛼 (6)
where
X =𝑑2(𝜌𝑝−𝜌𝑔)𝑔
𝜇 (
𝜌𝑓 𝜌𝑔)
1.23 (7)
For metallic ores-gas fluidizing system 101μm<d<1250μm
K = 3.1108 × 10⁻⁸, α = 0.93283 ± 0.03451
For sand-gas fluidizing system 95μm<d<800μm
K = 9.7119 × 10⁻⁷, α = 0.84268 ± 0.01601
For catalyst-gas fluidizing system 25μm <d<2250μm
K = 1.145 × 10⁻⁵, α = 0.71957 ± 0.01422
where ρp is the density of fluid medium, ρg is the density of fluidizing gas, μ is the viscosity
of fluidizing gas, K and a are constants.
According to these correlations, the minimum fluidization velocity depends on particle and
gas properties, such as densities of solid and gas, sphericity, particle diameter, and voidage at
18
experimental Umf is shown in Table 2.2.
Table 2.2 Correlations for minimum fluidization velocity
Umf predicted (cm/s) This work
Particles dp (μm) ρ(kg/m3) Geldart type Wen/Yu Coltters/Rivas Experiment
Magnetite 150-300 4650 B 7.73 6.49 10.6
Sand 150-300 2650 B 4.40 4.72 3.71
Sand 75-125 2650 A/B 0.87 1.20 1.20
FCC catalyst 75-125 1540 A 0.51 0.76 0.51
Table 2.2 shows that magnetite powder has the largest Umf, while FCC catalyst has the
smallest Umf, which implies that FCC catalyst and sand with smaller particle size can be
fluidized easier than magnetite powder and sand with larger particle size. The experimental
minimum fluidization velocity has a good agreement with the results calculated from
correlations in literature.
2.3.2 Bubble size distribution
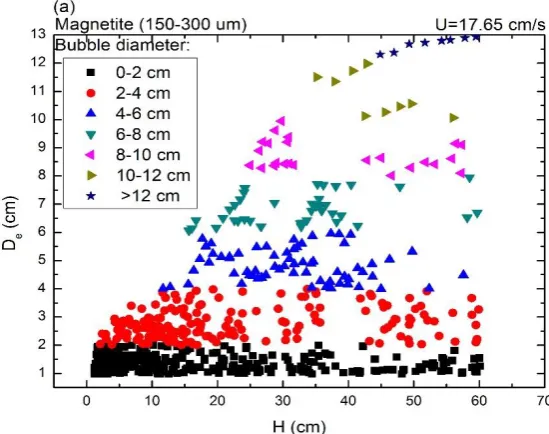
Bubble size growth as a function of the bed height above the gas distributor and bed width
are shown in Figure 2.5. It is clear that bubble diameter for Geldart B particles is increasing
with increasing bed height. Small bubbles covers the whole bed area while large bubbles only
exist in higher locations in the bed. However, in higher levels, population of small bubbles is
smaller compared to that in lower levels. Figure 2.5 (a) shows that small bubbles exist at all
19
Figure 2.5 (b) illustrates that large bubbles exist in the central region, while small bubbles
spread out along the bed width. The whole pattern of Figure 2.5 (b) acts like a triangle which
means bubbles are moving toward to the center and becoming bigger due to the coalescence
in the central region.
According to Figure 2.5 (a), the present trend with a large slope implies that bubble
coalescence tends to occur in the central region at the elevation between 15cm and 45cm,
where small bubbles assemble. After coalescence, bubbles also grow gradually due to the
decreasing hydrostatic bed pressure. Therefore, bubble coalescence is the main reason for
20
Figure 2.5 Bubble diameter growth as a function of bed height and bed width.
2.3.3 Bubble size evolution
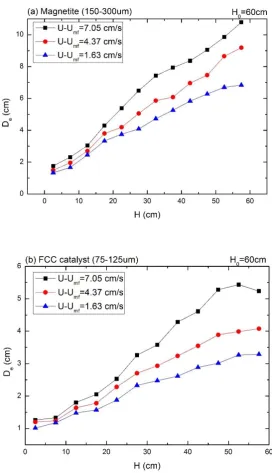
Figure 2.6 (a) shows a remarkable increase in bubble diameter with increasing bed height at
different gas velocities, while Figure 2.6 (b) shows a constant of bubble diameter for FCC
catalyst at higher regions. It is attributed to small particles, which give bubbles more chance
to break up. It is assumed that no bubble coalescence occurs at very high elevation due to
long distances between bubbles. A balance is reached between the breakage of bubbles and
the decreased bed hydrostatic pressure. For Geldart B type particles, bubbles coalesce as they
rise through the whole bed, which makes bubbles grow bigger at higher elevation. These two
Figures also show that bubble size increases when higher gas velocity is introduced. In
addition, a sharper increase of bubble diameter is clearly observed with a higher gas velocity.
It is likely due to more gas at higher gas velocity, which indicates bubbles have more chance
21
Figure 2.6 Bubble diameter De evolution as a function of the distance above gas distributor H
for varying superficial gas velocities
Figure 2.7 illustrates that there is a decrease of bubble diameter with increasing initial bed
height in lower region due to high hydrostatic pressure. In Figure 2.7, FCC catalyst (75-125
μm) with ungassed bed height of 60 cm has a constant value at the end. The bubbles have not
reached the maximum size until 48 cm. Moreover, it is observed that higher initial bed height
22
Figure 2.7 Bubble diameter De as a function of ungassed bed height Ho
Figure 2.8 Bubble diameter De as a function of bed height H
Figure 2.8 shows that Geldart B type particles have bigger bubble size than Geldart A type
particles. In addition, particles with larger size tend to have larger bubble size than smaller
particles. This result are in good agreement with the research of Park et al. (1969) and Yasui,
23
A type particles due to the large particle size, which means more space for the gas to form
large bubbles between particles. However, the optimal fluidization should have large quantity
of small bubbles homogeneously distributed in the bed (Lim et al. 2007). Base on this theory,
fine particles have a better fluidization when the particles are fully fluidized. Compared to the
bubble size of sand particles (150-300μm), magnetite powder has a bigger bubble diameter
due to its relatively higher density. The fluidizing gas supports the weight of particles in the
whole bed when particles are fluidized. In this case, fluidizing gas in magnetite powder is
easier to accumulate and forms bigger bubbles.
2.3.4 Comparison of bubble diameter
Figure 2.9 shows that the experimental bubble diameters are not in good agreement with
results calculated from the correlation of Darton. Bubble diameter from Darton’s equation is
clearly smaller than actual bubble size. The equation of Darton et al. is decribed as follows:
𝐷𝑒 = 0.54𝑔−0.2(𝑈 − 𝑈
𝑚𝑓)0.4(ℎ + 4𝐴𝐷0.5)0.8 (8)
According to this equation, particle properties do not have any effect on the bubble size.
However, as shown earlier, bubble diameter depends on particle size and type. Therefore, a
24
Figure 2.9 Bubble diameter evolution with the distance above gas distributor
2.3.5 Bubble rise velocity
Bubble rise velocity changes with bubble size as bubbles rise through fluidized bed. The
bubble rise velocity can be determined based on bubble diameter and excess gas velocity
(Davidson and Harrison 1963). The correlation of Davidson and Harrison is given by;
25
Figure 2.10 Bubble rise velocity as a function of the distance above gas distributor
Figure 2.10 clearly shows that bubble rise velocity of magnetite powder is increasing with
increasing bed height and excess gas velocity. The increasing bubble rise velocity with bed
height is due to the appreciable coalescence of bubbles as they rise through the bed, which
makes bubbles grow larger and rise faster. The excess gas needs to get out of the fluidized
dense phase in the form of bubbles. According to the mass balance of gas, larger excess gas
velocity leads to larger bubble rise velocity.
26
Figure 2.11 illustrates that magnetite powder has the largest bubble rise velocity while FCC
catalyst has the smallest bubble rise velocity, which is in good agreement with the bubble
diameter. However, bubble rise velocity is increasing with decreasing particle size of sand,
which is in contradiction with the growth pattern of bubble size of sand. Whitehead et al.
(1967) measured the bubble rise velocity using an optical probe in a 10 cm squared fluidized
bed filled up with silica sands at varying excess gas velocities. They found that average
bubble velocity is proportional to the excess velocity and bubbles rose faster in fine sand. In
addition, Rowe and Yacono (1976) also found that bubble rise velocity increased with
decreasing particles size. The reason for this phenomenon is still unknown.
Figure 2.12 Bubble rising velocity as a function of bubble diameter
Figure 2.12 illustrates that bubble size can accelerate the bubble rising velocity, which means
larger bubbles move much faster than small bubbles. Figure 2.13 shows the forces exerting
on a single bubble.
The buoyant force:
27
where
𝑉𝑏 =16𝜋𝐷3 (11)
The drag force:
𝐹𝑑 = 12ρ𝑓𝑢2𝐶𝐷𝐴 (12)
where
A =14𝜋𝐷2 (13)
The gravity force:
G = 𝜌𝑎𝑖𝑟𝑉𝑏𝑔 (14)
Where ρf is density of the fluid, D is the diameter of bubble, u is the velocity of fluid, CD is
the drag coefficient, A is the projected surface area. The gravity force of bubble is so small
that it is neglected in the following calculation.
It is clearly seen that 𝐹𝑏 ∝ 𝐷3 and 𝐹𝑑 ∝ 𝐷2. Therefore the ratio of buoyant force and drag
force is 𝐹𝑏
𝐹𝑑 ∝ D, which indicates bigger upward force with larger bubbles. Therefore, large
bubbles rise faster than small bubbles.
28
2.3.6 Bed expansion
2.3.6.1 Experimental
The bed surface is forced up to a higher level when particles inside the bed are fluidized due to
additional volume occupied by the bubbles. Therefore, bed expansion is of critical importance
to determine the amount of solid and gas bubbles. In this work, two methods were applied to
measure bed expansion. One method is direct observation of expanded bed height, while the
other is through the measurement of pressure drop. Ten pictures were taken during the first
method to obtain average expanded bed height (He) with known initial bed height (H0). Then
the bed expansion can be calculated based on following formula:
𝑒 =𝐻𝑒−𝐻0
𝐻0 (15)
29
Figure 2.15 Pressure drop-Bed expansion as a function of excess gas velocity
It is observed that bed expansion increases with increasing excess gas velocity U-Umf due to
more gas bubbles as shown in Figure 2.14 and Figure 2.15. They also show that sand with
larger particle size has a bigger bed expansion than sand with smaller particle size, which
indicates particles with smaller size give larger bed expansion. Moreover, these two Figures
illustrate that FCC catalyst has the biggest bed expansion. Both FCC catalyst and sand (75-125
μm) belong to Geldart A type particles. According to the results, Geldart A type of particle tends
to have large bed expansions, which is attributed to the large amount of small bubbles of
Geldart A type of particle.
2.4.6.2 Theoretical
Bubbles grow bigger and move faster when they rise through the fluidized bed. Therefore, there
are specific bubble size and bubble rise velocity at each position. An iteration method was used
30
a height of Hi. Each part has its own serial number “n”. Bubble diameter di and bubble velocity
vi in each part can be calculated using bubble size equation of Darton (1967) and bubble
velocity equation of Davidson and Harrison (1963).
Based on mass balance on the gas phase, the number of bubbles in each part can be obtained
using the following equations:
𝐷𝑒 = ∅(U − 𝑈𝑚𝑓)0.204(𝐻𝑖
2 + (𝑛 − 1)𝐻𝑖+ 4𝐴𝐷
0.5)0.759/1.2 (16)
A single bubble volume will be:
𝑉𝑏𝑖 = 14𝜋𝐷𝑖2𝑤 (17)
Then the bubble rising velocity will be:
𝑢𝑏𝑖 = 0.71√𝑔𝐷𝑖+ 𝑈 − 𝑈𝑚𝑓 (18)
The time bubble stays in each part will be:
𝑡 = 𝐻𝑖
𝑢𝑏𝑖 (19)
Then the number of bubbles in each part will be:
𝑛𝑖 =(𝑈𝑔−𝑈𝑉 𝑚𝑓)𝑡
𝑏 (20)
and the dense phase volume will be:
𝑉𝑑𝑖 = 𝐴𝐻𝑖− 𝑛𝑖𝑉𝑏𝑖 (21)
The summation of each dense phase volume will be the volume of ungassed fluidized bed,
which is:
𝑉𝑑 = ∑ 𝑉𝑛1 𝑑𝑖 (22)
The volume of ungassed fluidized bed is H0A . The difference between 𝑉𝑑 and H0A is the
dense phase in expanded area, of which the bed height is H’.
31
Then the bubble volume of expanded area will be n’V’b
The summation of each bubble phase will be:
𝑉𝑏 = ∑ 𝑛𝑛1 𝑖𝑉𝑏𝑖 + n′𝑉′𝑏 (23)
Then the bed volume after expansion will be the summation of dense phase and bubble phase:
𝑉𝑒 = 𝐴𝑤 + 𝑉𝑏, (24)
𝐻𝑒 = 𝑉𝑒
𝐴, (25)
where w is the thickness of the fluidized bed, A is the cross-sectional area of the fluidized bed,
Hi is the initial bed height.
Therefore, the bed expansion e3 will be calculated using equation (15).
Figure 2.16 Bed expansion e3 as a function of excess gas velocity (U-Umf)
Figure 2.16 shows that bed expansion is proportional to the excess gas velocity. However, the
results from theoretical calculation are independent of particle size and particle type.
2.3.6.3 Bed expansion by graphical analysis
32
can be separated into consecutive frames using MATLAB. The number of bubbles (n) and
bubble size (di) of each frame can be determined. Then the total volume of bubble phase can
be calculated:
𝑉𝑏 =14𝜋𝑤 ∑𝑛𝑖=1𝑑𝑖2 (26)
The bed height after expansion will be:
𝐻𝑒 = 𝐻0+𝑉𝑏
𝐴 (27)
Then the bed expansion e4 can be calculated using equation (15).
Figure 2.17 illustrates the bed expansion based on experimental videos. Every single point in
Figure 2.17 represents the average bed expansion calculated from 10 frames. Magnetite
(150-300 μm) and sand (150-(150-300 μm) show the same pattern of bed expansion while sand (75-125
μm) and FCC catalyst (75-125 μm) behave in a different way. The bubbles of sand (75-125 μm)
and FCC catalyst (75-125 μm) are too small to be captured by camera, which leads to errors on
determination of bed expansion.
33
Table 2.3 Comparison between experimental bed expansion and theoretical bed
expansion
Particles Ug-Umf
(cm/s)
Experimental bed expansion
e1 e2
Theoretical calculation
e3 e4
Magnetite
(150-300μm)
1.63 0.089 0.075 0.051 0.065
4.37 0.145 0.085 0.110 0.090
7.05 0.182 0.117 0.158 0.104
Sand
(150-300μm)
1.63 0.032 0.059 0.051 0.067
4.37 0.124 0.117 0.110 0.129
7.05 0.184 0.152 0.158 0.166
Sand
(75-125μm)
1.63 0.098 0.128 0.051 0.026
4.37 0.158 0.160 0.110 0.078
7.05 0.239 0.201 0.158 0.183
FCC catalyst
(75-125μm)
1.63 0.134 0.126 0.051 0.025
4.37 0.179 0.181 0.110 0.072
7.05 0.257 0.215 0.158 0.216
Table 2.3 shows good agreement between experimental bed expansion and theoretical bed
expansion of magnetite particles and sand (150-300 μm) particles while the discrepancy exists
for FCC catalyst and sand (75-125 μm). Both FCC catalyst and sand (75-125 μm) belong to
Geldart A type of particles, which have much smaller bubbles compared to Geldart B type of
34
under low superficial gas velocities.
2.3.7 Development of a new correlation for bubble diameter by the modification
of Darton’s equation
The correlation of bubble diameter proposed by Darton et al. in 1977 has been acknowledged
extensively in the literature. Most experimental data Darton et al. used belonging to Geldart B
type particles, including quartz sand, glass powder, alumina, and carbon to verify their
correlation. Therefore the correlation of Darton cannot provide the best coverage for Geldart
A type particles.
In addition, the theory developed by Darton et al. excluded mechanism of bubbles splitting
and breakage. Therefore, a continuously increasing pattern of bubble diameter was obtained
from their work. However, in real case, bubbles splitting and breakage do exist and are of
critical importance for bubble size evolution. Horio and Wen (1977) pointed out that the
equilibrium bubble size should be the result of a balance between bubble coalescence and
break up.
It is discovered that bubble diameter De is sensitive to several parameters, including excess
gas velocity Ug-Umf, distance above the gas distributor “x”, gas distributor hole diameter AD
and particle size dp. In addition, the particle-fluid density ratio has not been found to affect
the bubble diameter. Therefore, a functional relationship between these parameters and
bubble diameter is proposed:
𝐷𝑒 = ∅(U − 𝑈𝑚𝑓)α(ℎ + 4𝐴𝐷0.5)β (28)
35
the diameter of holes on the distributor, α and β are constants.
In this work, two Geldart A type particles, one Geldart A/B type particles and one Geldart A
type particles were utilized and a large number of experimental data of bubble diameter were
obtained. Based on the large quantity of experimental data analyzed using curve fitting
method in Matlab , a new modified correlation of bubble size is derived as:
𝐷𝑒 = ∅(U − 𝑈𝑚𝑓)0.204(ℎ + 4𝐴𝐷0.5)0.759/1.2 (29)
where
∅ = {
0.252 𝑓𝑜𝑟 𝐺𝑒𝑙𝑑𝑎𝑟𝑡 𝐵 𝑡𝑦𝑝𝑒 𝑜𝑓 𝑝𝑎𝑟𝑡𝑖𝑐𝑙𝑒𝑠 (𝑚𝑎𝑔𝑛𝑒𝑡𝑖𝑡𝑒 𝑎𝑛𝑑 𝑠𝑎𝑛𝑑 (150 − 300𝜇𝑚))
0.153 𝑓𝑜𝑟 𝐺𝑒𝑙𝑑𝑎𝑟𝑡 𝐴 𝑡𝑦𝑝𝑒 𝑜𝑓 𝑝𝑎𝑟𝑡𝑖𝑐𝑙𝑒𝑠 (𝑚𝑎𝑔𝑛𝑒𝑡𝑖𝑡𝑒 𝑎𝑛𝑑 𝑠𝑎𝑛𝑑 (150 − 300𝜇𝑚))
Figure 2.18 shows calculated data against experimental results. Therefore, the proposed
equation is in a good agreement with experimental data within 15% accuracy.
36
2.3.8 Estimation of the bed density
The density of fluidized bed at a certain level is given by:
𝜌̅𝑏𝑒𝑑 = 𝜌𝑏𝑢𝑏𝑏𝑙𝑒× (𝑉𝑏𝑢𝑏𝑏𝑙𝑒
𝑉𝑡𝑜𝑡𝑎𝑙 ) + 𝜌𝑑𝑒𝑛𝑠𝑒 × (
𝑉𝑑𝑒𝑛𝑠𝑒
𝑉𝑡𝑜𝑡𝑎𝑙)
(30)
The gas volumetric flowrate in bubble phase (Davidson, 1985) is as follows:
𝐺𝑏 = (𝑈𝑔− 𝑈𝑚𝑓)A (31)
In the two-phase theory of fluidization, the bubble phase density is very close to the density
of fluidizing gas, then the dense phase density can be taken as:
𝜌𝑑𝑒𝑛𝑠𝑒 = 𝜌𝑝(1 − 𝜀𝑚𝑓) + 𝜌𝑔𝜀𝑚𝑓 (32)
where,
𝜀𝑚𝑓 =𝐻𝑚𝑓𝐻−𝐻0
0 (33)
The gas bubble volume at a certain level is given by
𝑉𝑏 = 𝐴𝑏× ∆ℎ = 𝐺𝑏∆ℎ
𝑢𝑏
(34)
The bubble rise velocity can be calculated using equation (9), which is:
𝑢𝑏 = 0.71√𝑔𝐷𝑒+ (𝑈𝑔− 𝑈𝑚𝑓) (9)
Then equation (34) will be
𝑉𝑏 = 𝐴𝑏× ∆ℎ = 𝐺𝑏𝑢∆ℎ
𝑏 =
(𝑈𝑔−𝑈𝑚𝑓)A∆h
0.71√𝑔𝐷𝑒+(𝑈𝑔−𝑈𝑚𝑓)
(35)
In addition, the dense volume will be
𝑉𝑑 = 𝐴𝑑∆ℎ = (𝐴 − 𝐴𝑏)∆ℎ = (𝐴 − (𝑈𝑔−𝑈𝑚𝑓)A
0.71√𝑔𝐷𝑒+(𝑈𝑔−𝑈𝑚𝑓))∆ℎ (36)
37 𝜌̅𝑏𝑒𝑑= 𝜌𝑏𝑢𝑏𝑏𝑙𝑒× ( 𝑉𝑏𝑢𝑏𝑏𝑙𝑒 𝑉𝑡𝑜𝑡𝑎𝑙 ) + 𝜌𝑑𝑒𝑛𝑠𝑒× ( 𝑉𝑑𝑒𝑛𝑠𝑒 𝑉𝑡𝑜𝑡𝑎𝑙) = 𝜌𝑏𝑢𝑏𝑏𝑙𝑒× ( 𝑉𝑏 𝐴∆ℎ) + 𝜌𝑑𝑒𝑛𝑠𝑒 × ( 𝑉𝑑 𝐴∆ℎ) = 𝜌𝑏( (𝑈𝑔−𝑈𝑚𝑓)
0.71√𝑔𝐷𝑒+(𝑈𝑔−𝑈𝑚𝑓)) + 𝜌𝑑(1 −
(𝑈𝑔−𝑈𝑚𝑓) 0.71√𝑔𝐷𝑒+(𝑈𝑔−𝑈𝑚𝑓)) = 𝜌𝑑+ (𝜌𝑏− 𝜌𝑑)0.71√𝑔𝐷(𝑈𝑔−𝑈𝑚𝑓)
𝑒+(𝑈𝑔−𝑈𝑚𝑓) (37)
Combining equations (37) and (32);
𝜌̅𝑏𝑒𝑑 = 𝜌𝑑 + (𝜌𝑏− 𝜌𝑑) (𝑈𝑔−𝑈𝑚𝑓) 0.71√𝑔𝐷𝑒+(𝑈𝑔−𝑈𝑚𝑓)
= 𝜌𝑝(1 − 𝜀𝑚𝑓) + 𝜌𝑔𝜀𝑚𝑓+ (𝜌𝑔 − 𝜌𝑝(1 − 𝜀𝑚𝑓) − 𝜌𝑔𝜀𝑚𝑓) (𝑈𝑔−𝑈𝑚𝑓) 0.71√𝑔𝐷𝑒+(𝑈𝑔−𝑈𝑚𝑓) = (1 − 𝜀𝑚𝑓)(𝜌𝑝− 𝜌𝑔) (1 − (𝑈𝑔−𝑈𝑚𝑓)
0.71√𝑔𝐷𝑒+(𝑈𝑔−𝑈𝑚𝑓)) + 𝜌𝑔 (38)
where De can be calculated using equation (29), which is
𝐷𝑒 = ∅(U − 𝑈𝑚𝑓)0.204(ℎ + 4𝐴𝐷0.5)0.0.759/1.2 (29)
where
∅ = {
0.252 𝑓𝑜𝑟 𝐺𝑒𝑙𝑑𝑎𝑟𝑡 𝐵 𝑡𝑦𝑝𝑒 𝑜𝑓 𝑝𝑎𝑟𝑡𝑖𝑐𝑙𝑒𝑠 (𝑚𝑎𝑔𝑛𝑒𝑡𝑖𝑡𝑒 𝑎𝑛𝑑 𝑠𝑎𝑛𝑑 (150 − 300𝜇𝑚))
0.153 𝑓𝑜𝑟 𝐺𝑒𝑙𝑑𝑎𝑟𝑡 𝐴 𝑡𝑦𝑝𝑒 𝑜𝑓 𝑝𝑎𝑟𝑡𝑖𝑐𝑙𝑒𝑠 (𝑚𝑎𝑔𝑛𝑒𝑡𝑖𝑡𝑒 𝑎𝑛𝑑 𝑠𝑎𝑛𝑑 (150 − 300𝜇𝑚))
εmf can be calculated using equation (33), which is
𝜀𝑚𝑓 =𝐻𝑚𝑓−𝐻0
𝐻0 (33)
Therefore, the bed density of fluidized bed can be calculated using equation (38), (29) and
(33).
2.4 Conclusions
Bubble dynamics and bed expansion of four types of particles have been investigated in a 2D
gas-solid fluidized bed using image processing technology. Based on the large quantity of
analysis of experimental data, the relationships between bubble characteristics, bed expansion
38
certain patterns could be observed:
(i) Bubble size increases linearly with the distance above gas distributor, particles with a larger
size tend to have a bigger bubble size for a given bed height.
(ii) Bubbles of Geldart A type of particles can reach a maximum size due to more chance of
break-up.
(iii) Bubble rise velocity is proportional to the distance above gas distributor and larger bubbles
rise faster than small bubbles.
(iv) Geldart A type of particles have a bigger bed expansion than Geldart B type of particles
due to huge amount of small bubbles in the bed.
(v) A new correlation of bubble diameter is proposed and it shows a better prediction of bubble
size compared to Darton’s equation of bubble diameter.
(vi) A method for estimation of bed density was developed based on the new correlation of
39
Nomenclature
Ab, A Surface area of a single bubble, cm2
AD The diameter of hole on the distributor, m
dp, d Particle size, μm
D Bubble diameter, m
De Equivalent bubble diameter, cm
e Bed expansion
Fd Drag force, N
Fb The buoyant force, N
g Acceleration of gravity, m/s2
H0 Initial bed height, m
He Expanded bed height, m
H, h Bed height (The distance above gas distributor), m
∆t Time interval between consecutive frames, s
ub Bubble rise velocity, cm/s
Umf The minimum fluidization velocity, cm/s
U Superficial gas velocity, m/s
U Velocity of fluid, m
Vb Bubble volume, cm3
w Bed width, cm
xi Abscissa of bubble center, cm
40
ρp The density of particles, kg/m3
ρg The density of fluidizing gas, kg/m3
ρf The density of fluidizing medium, kg/m3
μ Viscosity of fluidizing gas, Pa.s
Greek letters
ρ
41
Reference
Andreux, R. and J. Chaouki (2005), Behaviors of the bubble, cloud, and emulsion phases in a fluidized bed, AIChE Journal 54: 406-414.
Busciglio, A., Vella, G., Micale, G. and L. Rizzuti (2010), Experimental analysis of bubble size distribution in 2D gas fluidized beds, Chemical Engineering Science 65: 4782-4791.
Coltters, R. and A.L. Rivas (2004), Minimum fluidization velocity correlations in particulate systems, Powder Technology 147 (1-3): 34-48.
Darton, R. C., LaNAUZE, R. D., Davidson, J. F. and D. Harrison (1977), Bubble growth due to coalescence in fluidized beds, Trans. Inst. ChemE 55: 274-280.
Davidson, J. F. and D. Harrison (1963), Fluidized particles, Cambridge university press.
Dwari, R. K. and K. H. Rao (2007), Dry beneficiation of coal-A review, Mineral processing & extractive metallurgy review 28 (3): 177-234.
Geldart, D. (1972), The size and frequency of bubbles in two and three dimensional gas fluidized beds, Powder Technology 4: 41-45.
Geldart, D. (1973), Types of gas fluidization, Powder Technology 7: 285-292.
Horio, M. and A. Nonaka (1987), A generalized bubble diameter correlation for gas-solid fluidized beds, AIChE Journal 33 (11): 1865-1872.
Halow, J. S., Fasching, G. E., Nicoletti, P. and J. L. Spenik (1993), Observation of a fluidized bed using capacitance imaging, Chemical Engineering Science 48: 643-659.
Lim, K. and P. Agarwal (1990), Conversion of pierced lengths measured at a probe to bubble size measures: an assessment of the geometrical probability approach and bubble shape models, Powder Technology 63: 205-219.
Lim, C., Glibertson, M. and A. Harrison (2007), Bubble distribution and behavior in bubbling fluidized beds, Chemical Engineering Science 62: 56-69.
McKeen, T. and T. Pugsley (2003), Simulation and experimental validation of a freely bubbling bed of FCC catalyst, Powder Technology 129: 139-152.
Ma, J., Liu, D. and X. Chen (2015), Bubble behaviors of large cohesive particles in a 2D fluidized bed, Ind. Eng. Chem. Res. 55: 624-634.
42
Journal 21(1): 109-115.
Narsimhan, G. (1965), On a generalized expression for prediction of minimum fluidization velocity, AIChE Journal 11 (3): 550-554.
Park, W. H. and W. K. Kang (1969), The properties of bubbles in fluidized beds of conducting particles as measured by an electroresistivity probe, Chemical Engineering Science 24: 851-865.
Rowe, P. N. and B. A. Partridge (1965), An X-ray study of bubbles in fluidized beds, Institution of Chemical Engineers 43: 157-175.
Rowe, P.N. and C.X.R. Yacono (1976), The bubbling behaviour of fine powders when fluidized, Chemical Engineering Science 31: 1179-1192.
Sahu, A. K., Biswal, S. K. and A. Parida (2009), Development of air dense medium fluidized bed technology for dry beneficiation of coal – A review, International Journal of Coal Preparation and Utilization 29 (4): 216-241.
Van Houwelingen, J. A. and T. P. R. de Jong (2004), Automatic sorting and control in solid fuel processing: Opportunities in European perspective, Geologica Belgica 7 (3-4): 334-343.
Verma, V. and T.P. Johan (2014), Bubble dynamics in a 3-D gas–solid fluidized bed using ultrafast electron beam X-ray tomography and two-fluid model, AIChE Journal 60 (5): 1632-1644.
Werther, J. and O. Molerus (1973), The local structure of gas fluidized beds —I. A statistically based measuring system, International Journal of Multiphase Flow 1 (1): 103-122.
Whitehead, A.B., Dent, D.C. and G.N. Bhat (1967), Fluidization studies in large gas-solid systems-Part 1: bubble rise rates, Powder Technology 1: 143-148.
Werther, J. (1974), Influence of the bed diameter on the hydrodynamics of gas fluidized beds, AIChE Symp. Ser. 70 (141): 53-62.
Wen, C.Y. and Y.H. Yu (1966), A generalized method for predicting the minimum fluidization velocity, AIChE Journal 12 (3): 610-612.
Whitehead, A.B., Dent, D.C. and G.N. Bhat (1967), Fluidization studies in large gas-solid systems-Part 1: bubble rise rates, Powder Technology 1: 143-148.
Yasui, George and L. N. Johanson (1958), Characteristics of gas pockets in fluidized beds, AIChE Journal 4 (4): 445-452.
43
3.1 Introduction
Gas-solid fluidization technology, as an environmentally friendly alternative, has been widely
applied in many industrial process, among which coal separation exhibits remarkable
advantages over wet cleaning technology, such as no need for water, less air pollution, no slurry
treatment and so on (Dwari, Rao 2007 and Houwelingen, Jong 2004). This specific gravity
separation is achieved based on the difference of densities between medium solids and raw
coal. In industrial process, density of fluidized bed can be adjusted by varying gas velocities.
However, this adjustment controlled by gas velocity is not enough to meet the demand of low
bed density. Therefore, binary mixture was introduced into the medium to substitute for
single-component particles to lower down the bed density. In this way, a wider range of raw coal can
be chosen to avoid energy-consuming pre-treatment processes.
The intense mixing between gas and particles enables gas-solid fluidization to yield higher
mass and heat transfer rate between bubble phase and solid phase. The bubbles are generated
when gas velocity exceeds the minimum fluidization velocity. In gas-solid fluidization, bubble
behaviours have a significant effect on the fluidization quality, which ensures the efficiency of
industrial processes (Lim, Gilbertson and Harrison 2007).
However, there are very few studies about bubble dynamics of mixtures of the particles in the
past. The mixtures of particles can be divided into two categories: the same particles with
different sizes and different particles with the same size. The first mixture is focusing on the
effect of particle size on bubble dynamics, while the second is investigating the effect of
particle density on bubble dynamics. Particles with larger size have the tendency to form bigger
44
thoroughly studied.
There are limited studies on bubble dynamics as a function of fluidized bed properties in
gas-solid fluidization in the literature. Furthermore, most of them are focusing on the bubble
characteristics of single-component beds. Particle size effect seems to be of main concern in
the study of bubble dynamics.
Various measurement systems have been developed to determine the bubble properties in
fluidized beds, including different probes and photography. Several probe measurement
systems, belonging to intrusive measurement technologies, have been utilized in recent years,
which includes needle type capacitance probes (Werther, Molerus 1973), optical probes
(Yasui and Johnson 1958, Andreux and Chaouki 2005) and electro-resistivity and
conductivity probes (Park and Kang 1969). Photography technologies belonging to
non-intrusive measurement technologies, are mainly composed of direct photography (Geldart
1970), X-ray photography (Rowe and Partridge 1965) and electrical capacitance tomography
(Halow, Fasching, Nicoletti and Spenik 1993, McKeen and Pugsley 2003). In recent years,
2D fluidized bed has been widely utilized for the investigation of bubble dynamics in
gas-solid fluidization due to its small thickness, which allows detail observation of bubbles in the
fluidized bed.
Kage et al. (1991) performed the research of bubble sizes and bubble rising velocities in a
gas-solid fluidized bed with mixtures of particles with different sizes but the same density
using optic fiber probes. A new approach of determining bubble diameter in gas-solid
fluidized bed with two-component particles was proposed. Muddle et al. (1994) investigated
45
analysis technology. Special attention was paid to bubble properties and the results showed
that determination of wake angle and wake area was possible. Busciglio et al. (2012) carried
out a series of experiments to measure bubble characteristics in binary mixtures of corundum
and glass particles with different sizes but the same density by means of digital imaging.
They did statistical analysis to describe bubble dynamics.
However, research studying the bubble dynamics of mixtures of particles with the same size
but different densities as a function of fluidized bed properties is scarce. The main goal in this
study is to measure bubble characteristics of binary mixtures of particles with the same size
but different densities using image processing technology. In this work, bubble size, bubble
rising velocity, bubble distribution and bed expansion were measured. Additionally, a
correlation of determining bubble diameter in mixtures of particles with different densities
was developed.
3.2 Experimental set-up and methods
3.2.1 Experimental set-up
Figure 3.1 shows the schematic diagram of the experimental setup. The fluidized bed designed
for present study on bubble dynamics is made of Perspex (1500 mm height, 370 mm width and
thickness of 19 mm), which provides detail observation of bubble behaviors inside the bed.
There are three pressure measurement ports along the bed wall located at bed height of 0 mm,
180 mm and 550 mm. Two lights were placed in front of the fluidized bed to enhance the
contrast between the bubble and dense phases, allowing more small bubbles being visualized.
46
opposite side of the bed. All videos were recorded at the steady state condition (complete
fluidization).
Figure 3.1 Schematic diagram of experimental equipment.
A sintered plastic gas distributor placed at the bottom of fluidized bed is designed with 10
micron holes. Below the gas distributor is the wind box used to ensure uniform distribution of
inlet gas across the distributor. Air was used as the fluidizing gas and controlled by three air
rotameters ranging from 0 m3/h to 5 m3/h.
47
ranging from 150 μm to 300 μm and two single-component particles (magnetite powder, sand)
were chosen. Binary mixtures having four compositions of 20%, 40%, 60% and 80% based on
volume fraction of sand were used in the experiments. These 6 groups of experiments were
studied at varying excess gas velocities of 7.05 cm/s, 4.37cm/s and 1.63cm/s with fixed bed
height of 60 cm. Each binary mixture was fully mixed prior to the experiment. The properties
of particles and binary mixtures are summarized in Table 3.1.
Table 3.1 Properties of particles and binary mixtures
Particle type ρp (kg/m3) dp (μm) Geldart type
Magnetite powder 4650 150-300 B
Magnetite+Sand (20%) 4250 150-300 B
Magnetite+Sand (40%) 3850 150-300 B
Magnetite+Sand (60%) 3450 150-300 B
Magnetite+Sand (80%) 3050 150-300 B
Sand 2650 150-300 B
Table 3.1 shows that densities of binary mixtures are between density of magnetite powder and
density of sand and they are decreasing with increasing volume fraction of sand.
3.2.2 Image processing
The bubble behaviors in the fluidized bed were videotaped after steady state condition was
48
frames per second. Each frame is a 1088 X 1920 pixel picture. The pixel ranging from 0 to
255 is called grey-value which indicates brightness. Grey-value 0 is black while grey-value
255 means white. Each position in the picture has its own grey-value. In this way, pictures are
transferred to a matrix, which can be analyzed using MATLAB (Matrix Laboratory).
The experimental procedure for image processing can be summarized into several steps : 1.
Split the video into consecutive frames. 2. Transfer original RGB images into grey images. 3.
Set a threshold to transfer grey images into binary images. 4. Do the subtraction of grey-value
between fluidizing particles images and ungassed particles image to determine bubble
properties. 5. Depict the contour of bubbles and obtain bubble characteristics applying a
package of software ‘Regionprops’. A video used as the base was recorded before air was
introduced into the bed. Then grey-value’s difference between the base image and images of
the fluidized bed of every position was obtained. A non-zero grey-value difference implies a
position where bubble exists due to different grey-values between the dense and bubble
phases.
(a) (b) (c) (d)
49
image (d) Image with circles.
3.2.3 Bubble size
The bubble phase was discriminated from the dense phase based on the grey-value difference.
However, a threshold needs to be determined to improve the discrimination between these
two phases because of the distraction of noise points. In this study, the threshold was
determined to be 10 to exclude noise points. The area of a bubble (Ab) is the number of pixels
forming this bubble. Every single bubble was transmitted to a circle with the same area using
a software called Regionprops. According to the bubble area, the equivalent bubble diameter
De can be calculated from the following equation:
𝐷𝑒 = 2√𝐴𝑏
𝜋 (1)
3.2.4 Bubble rising velocity
The camera applied in this investigation recorded videos of 29 frames per second. Therefore,
the time interval (∆t) between every two consecutive frames is 1/29 second. The coordinates
(xi, yi) of bubble center in each frame can be determined automatically by means of the image
processing technology. In this way, the axial distance (yi-yi-1) that every single bubble moves
between every two consecutive frames was obtained. Then the bubble rising velocity can be
calculated from the following equation:
𝑢𝑏 = 𝑦𝑖−𝑦𝑖−1
∆t (2)