DOI: http://dx.doi.org/10.26483/ijarcs.v9i1.5124
Volume 9, No. 1, January-February 2018
International Journal of Advanced Research in Computer Science
RESEARCH PAPER
Available Online at www.ijarcs.info
ISSN No. 0976-5697
CLASSIFICATION OF LEAF DISEASES IN APPLE USING SUPPORT VECTOR
MACHINE
G.Sivakamasundari
Assistant Professor, Department of CSE National Engineering College
Kovilpatti, India
Dr.V.Seenivasagam
Professor, Department of Information Technology National Engineering College
Kovilpatti, India
Abstract: India is an agricultural country, and 70% of the population depends on agriculture, hence heavy crop losses due to plant diseases results in loss of several billion dollars annually. This paper mainly concentrates on detection of leaf diseases. In rural areas and in developed countries, the naked eye observation of agricultural experts to detect the plant diseases is cumbersome. It takes too much of cost and time. This paper aims to provide a fast and cheap solution through automatic detection of leaf diseases and thus to improve the yield of the crops by detecting the plant diseases at the earlier stage. Using image processing, we can able to identify the type of disease in plant leaf by analyzing the color and texture feature. In our system first, color transformation is done from RGB to HSV and followed by color feature extraction. In color feature analysis, the color distribution of pixels is represented by the mean and standard deviation of the image and the local color information is represented by a binary bitmap. For texture feature extraction, first green pixels are masked as they are healthy region. This is followed by segmentation using K means clustering and identification of significant segments. From the selected segments, the Gray level co-occurrence matrix (GLCM) is found. From GLCM, the texture features are extorted. Using SVM diseased plant is discriminated from the healthy plant and classified based on diseases. Classification accuracy is measured through the performance measures such as precision and recall.
Keywords: Color Transformation, Masking, Feature Extraction, Segmentation, Classification
I. INTRODUCTION
Plant disease can be defined as abnormal changes in the physiological processes brought about by any biotic or abiotic factor(s) which ultimately threatens the normal growth and reproduction of a plant. Several reasons for plant diseases are low temperature, high temperature, unfavorable soil moisture, unfavorable pH, mineral deficiencies and so on.
Plant diseases may be broadly classified as infectious or non-infectious. The infectious are bacterial, fungal and viral diseases. The non-infectious are caused due to the unfavorable environmental condition. In addition to that, the diseases can be classified into Rusts, Smuts, Blight, Wilt, Canker, Mildew etc. based on the symptoms.
In an agriculture-oriented country like India, as a result of plant disease, plant production will fall down both in quantity and quality day by day. To overcome this, plant disease identification at the early stage is necessary nowadays. As the naked eye observation technique requires continuous monitoring of the crops by experts, it’s expensive. For this reason, automatic plant disease identification is our research topic to identify the diseases at the early stage. It is also fast, efficient and inexpensive and it is beneficial to monitoring large forms.
Mr. Pramod S. Landge et al[1] used color transformation and neural network to classify the diseases in maize leaves. Supriya S. Patki et al. [2] discussed different plant leave disease detection features and techniques. Jayamala K. Patil et al. have proposed techniques to classify different types of diseases in plant leaves and fruits in his review paper. [3]Among those papers, Features considered for classification are shape, texture, color and morphological features. In plant disease identification, commonly used classifiers are neural networks and SVM. The paper, Detection, and classification of plant diseases, proposed by Niket Amoda et al.[4] used texture feature and neural networks for classification of diseases in tomato leaves. Arivazhagan.s et al. [5] used texture analysis for
detection of an unhealthy region of plant diseases and SVM the classifier.
To identify and classify the grapefruit peel diseases Kim et al. [6] have used low-level features such as color and texture. Spatial Gray-level Dependence Matrices (SGDM) is used to calculate the texture feature and the classification is done using squared distance technique. Grapefruit peel is usually affected by the diseases such as greasy spot, Melanose, Canker, copper burn, and wind scar. Al-Hiary et al. [7] proposed a fast and accurate method which detects and classify the leaf diseases using k-means clustering and neural network classifier.
Sarkar and Wolfe [8] used color features as an indicator of the maturity of tomatoes. The intensities of images are used to classify green and red tomatoes. Texture features are used to evaluate the quality of the fruits.
In the proposed system, First RGB image is transformed into HSV color space and the color feature is extracted from it. Only H component is taken for further analysis while extracting the texture feature [9]. As green part of the leaf is healthy, the green pixels are masked and removed. After extracting the infected portion, it is segmented into a number of blocks of equal size. Then texture feature analysis is done for the selected segments and the resultant feature vector is given as input to the classifier.
In this paper, the proposed system is discussed in detail in section 2, results are discussed in section 3 and conclusion and feature extraction in section 3.
II. PROPOSEDSYSTEM
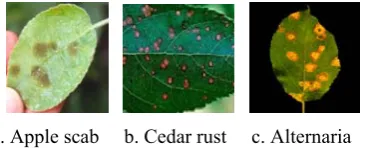
[image:2.595.53.236.53.128.2]
a. Apple scab b. Cedar rust c. Alternaria Fig 1: Various diseases in apple leaf
Identification of leaf disease is done through following procedure.
First, input RGB image is transformed to HSV color space and the color feature is extracted.
For texture analysis, only H component is taken as it contains the useful information for further analysis.
Masking followed by elimination of green pixels, and the resultant image is divided into a number of segments using K means clustering algorithm. The useful segments ie. the cluster with the diseased segments are identified for texture feature extraction. Texture analysis is done using GLCM.
Color feature and texture feature is fed to the SVM classifier as input and it identifies the disease
Fig 2: Proposed Leaf disease identification system
A. Color transformation
A Human visual system can able to distinguish various colors. The color information is used to simplify image analysis. Hue, Saturation, and intensity value are the 3 quantities used to describe any color. As HSV color model is based on human perception, it is preferable than RGB. So, the RGB image is converted into HSV. In HSV,Hue, saturation, and value represent the color, the amount of gray mixed in the color and the brightness of color respectively. The figure gives HSV image and the H, S, and V components separately. We dropped the S and V component and proceed with H-component alone as it the only H-component used for further analysis.
B. Color Feature Extraction
In the image, the color distribution of pixels contains
sufficient information for image analysis. From the mean and standard deviation of pixel colors, the principal color and the variation of pixel color is found. From the varying degrees of pixel colors, the color complexity of the image is found. Mean and standard deviation are the means through which the global properties of the image are represented.
The mean (μ) and the standard deviation (σ) of a color image are defined as follows:
(2)
Where μ = [μH, μS, μV ]T, σ = [σH, σS, σV ]T and Pi indicate
the pixel of the image.
Binary bitmap feature is used to capture the local color information of an image. To obtain the binary bitmap, first the image is divided into several non-overlapping blocks say m, and each block contains n pixels. Then calculate the image mean value and block mean value. The binary bitmap of the image is calculated by comparing the block mean value and image mean value. If block mean values are greater than Image mean, the binary bitmap value for that block is 1. Otherwise, the value is zero.
C. Masking and removal of green pixels
To reduce the processing time, we removed the healthy areas and concentrate only on the affected area. As green color pixel represents the healthy region, they are first identified and masked.
For masking, the following procedure is followed.
Calculate the threshold value for green pixels.
Assign zero to R, G, and B components of the pixels, if its intensity below the threshold.
Eliminate the pixels with zero values.
Thus the infected portion of the leaf is left and it gives more accurate disease classification with reduced the processing time.
D. Segmentation and obtain useful segments
K means clustering algorithm is used to segment the image into a number of clusters. Then the cluster with the diseased portion is identified and further considered for texture analysis.
E. Texture feature extraction
Gray-Level Co-Occurrence Matrix (GLCM) or gray level spatial dependence matrix is used for texture analysis. GLCM is a statistical method that examines the texture. Texture refers the spatial relationship of pixels in the image.Texture features like Contrast, Energy, Local homogeneity, Cluster shade, and cluster prominence are computed for the H-component.
I) Contrast: This statistic measure shows the amount of color variation in neighboring pixels. Contrast is highly interrelated with the variation of highest and lowest values of neighboring pixels.
II) Energy: This statistic is also called uniformity or angular second moment. It measures the textual uniformity ie. pixel pair repetitions. Energy reaches maximum value 1. High energy values occur when grey level distribution has a constant/periodic form. III) Local Homogeneity: Dissimilarity and Contrast result
in larger numbers for more contrast windows. If weights decrease away from the diagonal, the result will be larger for windows with little contrast. IV) Cluster Shade: Correlation is a measure of gray level
linear dependence between neighboring pixels and entropy is a measure of the texture randomness. The post-RT parotid glands had decreased correlation and increased entropy.
V) Cluster Prominence: Symmetry of the image is
calculated by Cluster prominence. In GLCM matrix, if there is a peak around the mean values, the cluster prominence value will be low. If the cluster
Input Image
Color Transformation
Masking and removal of green
i l
Classification Texture Feature
[image:2.595.54.286.333.435.2]prominence is low, the image is symmetric. Otherwise, the image is asymmetric.
(3)
(4)
(5)
(6)
(7)
F. Classification using SVM
SVM is a discriminative classifier and follows supervised learning. SVM can be implemented efficiently and it’s also proved its excellent performance in high dimensional problems and small data sets, hence it is chosen as a classifier in the proposed system. SVM is defined by separating hyperplane. SVM classifier is trained by the training data. After training, SVM constructs an optimal hyperplane which classifies the test data, ie. the new samples. In two dimensional spaces, the hyperplane is divided by a line and each side of it represents a class. The test samples may fall either side. The aim is to find on which side the data point belongs to. The training samples that are nearest to the hyperplane are called support vectors. In SVM, the p-dimensional vector represents the p data points. From that, we can able to determine whether such levels can be formed by a (p−1) dimensional hyperplane. The extracted texture features and target values are given as input to the SVM classifier during training. The features of test image are given at the time of classification. Based on the knowledge gathered in training, the SVM classifier identifies disease of the test image. It classifies the input image into four classes. Three of them represent the diseased leaf and the remaining one represent the healthy one.The diseases are Alternaria, Apple scab and Cedar rust in apple.
III. RESULTSANDDISCUSSION
The apple leaf images in the RGB format are converted into HSI format. The color features ie. the color moments are extracted from the HSI image. After masking and removal of green pixels from the H component, KNN classifier is used to segment the image. From the segmented image, the texture features are extracted from gray level co-occurrence matrix (GLCM).The texture features considered are contrast, energy, local homogeneity, shade, and prominence. With these set of co-occurrence features and the color moments, the plant diseases are detected. The co-occurrence features for the leaves are extracted and compared with the corresponding feature values stored in the feature library.
The classification efficiency is calculated by the performance measures accuracy, precision, and recall.
A. Accuracy
The accuracy is defined as the proportion of correct predictions out of the total number of predictions. It is determined using
Accuracy = [TP+TN] / [TP+TN+FP+FN] (8)
B. Recall ratio
The recall or true positive rate (TP) is defined by the proportion of correct positive predictions out of total positive predictions.
Recall=TP / [TP+FP] (9) C. Precision
The precision is defined by the proportion of the correct positive predictions out of total correct predictions.
Precision=TP / [TP+TN] (10)
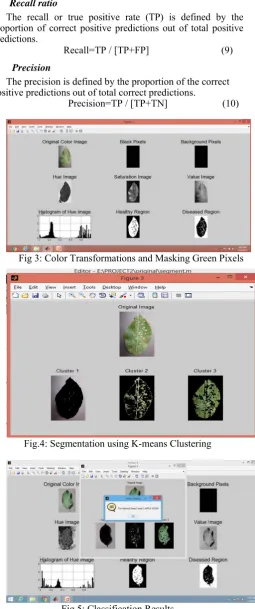
[image:3.595.315.571.57.668.2]Fig 3: Color Transformations and Masking Green Pixels
[image:3.595.39.277.91.243.2]Fig.4: Segmentation using K-means Clustering
[image:3.595.319.578.382.656.2]Table 1: Performance analysis comparison
Feature Performance measures
Recall Precision Accuracy
in %
Texture 0.91 0.87 92.22
Color 0.91 0.89 92.67
Texture &
[image:4.595.48.297.70.191.2]Color 0.89 0.91 92.67
Table 2: Classification Accuracy based on Texture
Leaf Performance measures
Apple Ceder
Apple Scab
Healthy Accuracy in %
Apple Ceder 11 0 0 100
Apple Scab 2 7 0 77.77
[image:4.595.29.280.218.337.2]Healthy 0 0 5 100
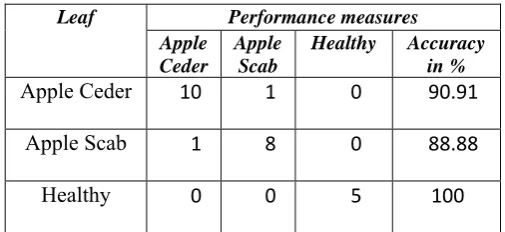
Table 3: Classification Accuracy based on Color
Leaf Performance measures
Apple Ceder
Apple Scab
Healthy Accuracy in %
Apple Ceder 10 1 0 90.91
Apple Scab 1 8 0 88.88
Healthy 0 0 5 100
Table 4: Classification Accuracy based on Color and Texture
Leaf Performance measures
Apple Ceder
Apple Scab
Healthy Accuracy in %
Apple Ceder 11 0 0 100
Apple Scab 1 8 0 88.88
[image:4.595.319.567.247.417.2]Healthy 0 0 5 100
Fig 6: Classification Accuracy based on Texture
Fig 7: Classification Accuracy based on Color
Fig 8: Classification Accuracy based on Color and Texture
IV. CONCLUSIONANDFUTUREENHANCEMENT
Detecting and classifying the plant leaf diseases based on color feature and texture feature is explained in this paper. Thus the proposed algorithm was tested on the apple leaf. We have taken three specific diseases in apple leaf. The proposed approach minimizes the computational effort in identifying and classifying the leaf diseases. By this method, that risk of losing the crop is minimized by identifying the plant disease at the earlier stage.
[image:4.595.28.281.369.485.2] [image:4.595.320.568.453.609.2]V. REFERENCES
[1] Mr. Pramod S. Landge, Sushil A. Patil, Dhanashree S. Khot, Omkar D. Otari, Utkarsha G. Malavkar, ” Automatic Detection and Classification of Plant Disease through Image Processing”, International Journal of Advanced Research in Computer Science and Software Engineering, Volume 3, Issue 7, July 2013.
[2] Supriya S. Patki, Dr. G. S. Sable,” Cotton Leaf Disease Detection”, IOSR Journal of VLSI and Signal Processing (IOSR-JVSP) Volume 6, Issue 3, Ver. I
[3] Jayamala K. Patil1, Raj Kumar, Advances in image processing for detection of plant diseases, Journal of Advanced Bioinformatics Applications and Research, Vol2, Issue, pp35-141June-2011.
[4] Niket Amoda, Bharat Jadhav, Smeeta Naikwad, Detection and classification of plant diseases by image processing, International Journal of Innovative Science, Engineering & Technology, Vol. 1 Issue 2, April 2014.
[5] Arivazhagan.S, Newlin Shebiah*.R, Ananthi.S, Vishnu Varthini.S, Detection of unhealthy region of plant leaves and classification,
[6] Dae Gwan Kim, Thomas F. Burks, Jianwei Qin, Duke M. Bulanon, Classification of grapefruit peel diseases using color texture feature analysis, International Journal of Agricultural and Biological Engineering, 2009; 2(3): 41
[7] H. Al-Hiary, S. Bani-Ahmad, M. Reyalat, M. Braik, and Z. ALRahamneh,” Fast and Accurate Detection and Classification of Plant Diseases”, International Journal of Computer Applications, 2011 (0975 – 8887).
[8] Sarkar and Wolfe, “Feature extraction technique for sorting tomatoes by computer vision”, American Society of Agricultural and Biological Engineers, 1985.(0970-0974)