Volume 10, No. 3, May-June 2019
International Journal of Advanced Research in Computer Science RESEARCH PAPER
Available Online at www.ijarcs.info
ISSN No. 0976-5697
SCHIZOPHRENIA DETECTION USING EEG SIGNAL PROCESSING TO SHOW
THE NONLINEAR STRUCTURE OF THE BRAIN ELECTRICAL ACTIVITY
Kabari Ledisi G. Dept. of Computer Science, Ignatius Ajuru University of Education,
Port Harcourt, Nigeria
Obinna, Eva N. Dept. of Computer Science, Ignatius Ajuru University of Education,
Port Harcourt, Nigeria
Abstract: The human brain is a very important organ in the human body and there are a lot of disorders associated with it. Electroencephalography (EEG) which is a measurement of potentials that reflect the electrical activity of the human brain have been found to be very useful in detecting brain disorder. Schizophrenia is an abnormal brain disorder that disrupts the brain’s ability to perceive and interpret reality to think and to feel. It is basically the condition when a person starts having difficulties in interpreting reality. They confuse their perceived thoughts with the actual happenings. This work aimed at demonstrating EEG signal processing to show the nonlinear structure of the brain electrical activity. In order to do this demonstration, abnormal EEG dataset of schizophrenia patients was extracted from kaggle database. Using Microsoft Excel, the extracted schizophrenia EEG dataset was plotted to show the nonlinear structure of the brain electrical activity. Thus comparing the electrical activity of the normal brain and that of the abnormal brain, a disorder can be easily detected.
Keywords: Electroencephalography, Electrodes, Schizophrenia, Human brain, Signal processing, Microsoft excel.
I. INTRODUCTION
An electroencephalogram (EEG) is an important clinical tool to assess human brain [1]. Electroencephalography (EEG) is a measurement of potentials that reflect the electrical activity of the human brain [1]. Using the EEG gives a readily available test that provides evidence of how the brain functions overtime [1]. EEG is widely used by physicians and scientists to study brain functions and to diagnose neurological disorders. EEG datasets are collected by a system [1].
Signal processing is concern with analysis, synthesis, and modification of signals. It is easily defined as functions conveying information about characteristics and attributes of some phenomenon like sound, images and biological measurement. It is subfield in mathematics, information science and electrical engineering [2]
This work aimed at using Microsoft Excel to demonstrate abnormal brain EEG signal processing to show the nonlinear structure of the brain electrical activity. Microsoft Excelis a spreadsheet developed by Microsoft for Windows, maCOS, Android and IOS.
II. BACKGROUNDOFTHESTUDY
A. Anatomy of the Brain
The cerebrum divided into two hemispheres is the largest part of the brain. Under the cerebrum is the brainstem having cerebellum sitting behinds it. The cerebral cortex is the outermost layer of the cerebrum and it consists of four lobes. These are: the frontal, parietal, temporal and occipital [3]. The forebrain, midbrain and hindbrain are the three sections that the human brain develops from, each of these contains
fluid-becomes part of brainstem and the hindbrain gives rise brainstem and the cerebellum region [3].
In the human brain, the cerebral cortex is greatly enlarge and is considered the seat of complex thought. Visual processing takes place in the occipital lobe. The temporal lobe processes sound and language. It includes the hippocampus and amygdala that play roles in memory and emotion [3]. The parietal lobe integrates input from different senses and is important for spatial orientation and navigation. The brainstem consists of the medulla oblongata, pons and midbrain and is connected to the spinal cord [3].The brainstem primarily relay information between the brain and the body, supplying some of the cranial nerves to the face and head. It also control the heart, breathing and consciousness [3].
[image:1.612.347.517.615.715.2]B. Abnormal Brain Disease (Schizophrenia)
Schizophrenia is an organic brain disease, which affects approximately one in 100 people at some time during their lives [4]. Promising and capable young adolescence or early adulthood people are often devastated by Schizophrenia and transforming them individuals who requires a high degree of care and support throughout their lives. Schizophrenia disrupts the brains ability to perceive and interpret reality to think and to feel. Schizophrenia has nothing to do with split personality or multiple personality or bipolar disorder. Schizophrenia has long bewildered psychiatrists and terrified the layperson, seeming to appear without warning to devastate developing minds poised on the threshold of adult life [4]. Schizophrenia is basically the condition when a person starts having difficulties in interpreting reality. They confuse their perceived thoughts with the actual happenings. A person with schizophrenia will show a sudden but significant change in his or her behavior as well as symptoms like delusions, hallucinations, abnormal speech, extremely erratic behavior, an absence of emotional responsiveness, in appropriate emotional reactions, impoverished speech and a potentially dangerous loss of the desire or ability to care for himself or herself [4].
Schizophrenia is caused by disturbance in development of brain but how and why is still not known. Researchers and scientists believe that it may has something to do with either genetics or some head injury in past that causes damage to brain. It is a very complex disease and research is still going on to know its causes and potential treatments [4].
Many different approaches have been used to investigate its causes and it is now established beyond doubt that schizophrenia is a biological disorder, although environmental factors have a critical role in the etiology of schizophrenia.
Although, there are many controversies and mysteries concerning the research of schizophrenia, presently there is lots of evidence indicating crucial differences in the brain structure and function in people with schizophrenia [4]. Some of these differences can be seen in the frontal lobes and temporal lobes.
C. Frontal Lobes
Schizophrenia patients often show an impaired performance on test of functioning of the frontal lobes [4]. Functional imaging studies in many researches on schizophrenia patients reported abnormal frontal lobe activity. However, the evidence from structural imaging studies is much less conclusive about the frontal lobes as no consistent pattern of pathology has yet emerged [4].
D. Temporal Lobes
[image:2.612.317.552.56.218.2]There is a great deal of smaller temporal lobe structure in schizophrenia patients. Studies found reduced volume of the hippocampus and amygdala components of the limbic system, a network of structures involved in control pf mood and emotion [4]. A region of Superior Temporal Gyrus (STG), which is heavily involved in language functions, has been reported to be smaller in schizophrenia patients. For example, it was reported that the volume of Heschl’s Gyrus which contains the primary auditory cortex and the Planum Temporale. The severity of positive symptoms such as auditory hallucinations has been indicated to be associated with the volumes of these language areas [4].
Figure 2. Brain Structure in Schizophrenia [4]
E. EEG Signals
EEG is an effective non-invasive tool for understanding the complex dynamical behavior of the brain and for monitoring different physiological states of the brain, neurological disorders. Scalp EEG has been employed as a clinical tool for the analysis and healing of the brain disease [5].
Devices like magnetic resonance (MR), brain tomography (BT) are used to diagnose the structural disorders of brain, for observing some special illnesses like epilepsy [1]. The electrical activity of active nerve cells in the brain produces currents spreading through the head [1]. These currents also reach the scalp surface, and resulting voltage differences on the scalp can be recorded as the electroencephalogram (EEG) by electrodes on or inside the brain with 10-20 electrode placement system. This 10-20 lead system provides information of how the brain functions overtime. Most commonly it is used to show the type and location of the activity in the brain during a seizure. Also, it is used to evaluate people who are having problems associated with brain function [1]. These problems might include confusion, coma, and tumors, with long-term difficulties with thinking or memory, or weakening of specific parts of the body. EEG is a recording of the brains electrical activity, made from the scalp [1].
Figure 3. The Pattern of Surface Electrode Placement Following that of the Universal System 20-10 [6]
F. Frequency Brand of EEG Signals
The brain waves recorded from the scalp have small amplitude of approximately 100µV.
The frequencies of these brain waves range from 0.5 to 10Hz, and their characteristics are highly dependent on the degree of activity of the cerebral cortex.
Generally, in normal persons, the brain waves may be classified as belonging to one of four wave group. 1. Delta (δ)-The delta waves includes all the waves in the EEG below 3.5Hz. They occur in deep sleep, in child hood, and in serious organic brain disease. 2. Theta (θ)-The theta waves have frequencies between 4 and 7 Hz [1]. These occur mainly during the child hood, but they also occur during emotional stress in some adults. 3. Alpha (α)-The Alpha waves are rhythmic waves occurring at a frequency range between 8 and 13Hz, which are found in all normal persons when they are awake in a quiet, resting state of cerebration. 4. Beta (β)-The Beta waves are very low amplitude, and high frequency range between 13 and 30Hz. They are affected by mental activity [1].
G. Microsoft Excel
Microsoft Excel features calculation, graphing tools, pivot tables, and a very widely applied spreadsheet for these platforms, and it has replaced Lotus 1-2-3 as the industry standard for spreadsheets. Excel forms part of Microsoft Office and has the basic features of all spreadsheets [7] using a grid of cells arranged in numbered rows and letter-named columns to organize data manipulations like arithmetic operations. Microsoft Excel has a battery of supplied functions to answer statistical, engineering and financial needs. It can display data as line graphs, histograms and charts, and with a very limited three-dimensional graphical display. Microsoft Excel allows sectioning of data to view its dependencies on various factors for different perspectives (using pivot tables and the scenario manager)[8]. It has a programming aspect, Visual Basic for Applications, allowing the user to employ a
differential equations of mathematical physics, [9] [10] and then reporting the results back to the spreadsheet.
III. MATERIALS ANDMETHOD
In order to demonstrate EEG signal processing to show the nonlinear structure of the brain electrical activity an abnormal dataset was extracted from kaggle database. This dataset (ERPdata.csv) are EEG readings from schizophrenia patients.
A. Description of Fields Used in ERPdataset
The ERPdata (Event Related Potential data) is a derived data that includes averages for 9 electrode sites that has been analyzed. The 9 electrode includes Fz (Midline Frontal), FCz (Midline Frontal Central), Cz (Midline Central), FC3 (Frontal Central 3), FC4 (Frontal Central 4), C3 (Central 3), C4 (Central 4), CP3 (Central Parietal 3), CP4 (Central Parietal 4).
B. Abnormal Brain Dataset
Table I contains EEG readings from ERP dataset of Schizophrenia patients, extracted from Kaggle database.
[image:3.612.315.552.322.725.2]C. Demonstration of ERPdataset
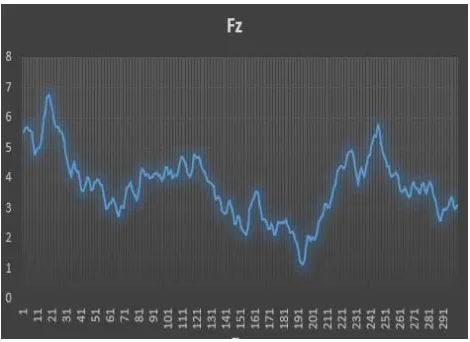
[image:5.612.314.549.116.287.2]The ERPdata in Table I ranges from 2 to 301; which implies that the data used to demonstrate this EEG signal, ranges from 1 to 300.
Figure 4. Graphical Demonstration of FZ Electrode
Figure 5. Graphical Demonstration of FCz Electrode
[image:5.612.316.546.313.467.2] [image:5.612.316.545.502.666.2]Figure 7. Graphical Demonstration of FC3 Electrode
Figure 8. Graphical Demonstration of FC4 Electrode
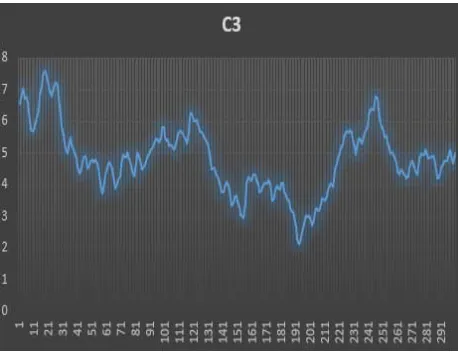
[image:6.612.316.547.55.246.2]Figure 9. Graphical Demonstration of C3 Electrode
[image:6.612.59.288.56.247.2]Figure 10. Graphical Demonstration of C4 Electrode
Figure 11. Graphical Demonstration of CP3 Electrode
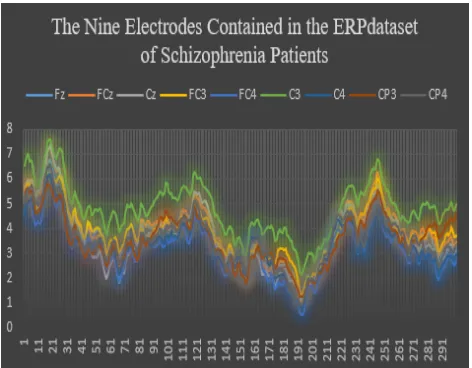
[image:6.612.316.546.280.473.2] [image:6.612.60.290.282.473.2] [image:6.612.316.545.505.683.2] [image:6.612.60.289.507.683.2]Figure 13. Graphical Demonstration of ERPdataset of Schizophrenia
(Abnormal Brain Disorder) Patients
IV. RESULTSANDDISCUSSION
Fz, FCz, Cz, FC3, FC4, C3, C4, CP3, CP4 graphical representation shows that the data used are data extracted from patients who has an abnormal brain disorder. This is because the readings of each of the 9 electrodes are below 7Hz. In a
normal EEG brain reading, the frequencies of an adult when awake is 8Hz and above. Waves with a frequency of 7Hz or
less often are classified as abnormal in awake adults, they normally can be seen in children or in adults who are asleep.
V. CONCLUSION
The human brain plays a major role in the human body and should be preserved from every hazardous agent. Every individual should cultivate the habit of doing a routine check to know their health status in order to cob any ailment that could lead to schizophrenia or other symptoms that could lead to other brain disorder like stroke. EEG is a very good medical tool for understanding the complex dynamical behavior of the brain and for monitoring different physiological states of the brain, neurological disorders. This work demonstrated EEG Signal Processing to show the nonlinear structure of the brain electrical activity using Microsoft Excel. Microsoft Excel is a good tool for demonstrating EEG signal processing to show the nonlinear structure of the brain electrical activity. In future this demonstration can be done using Mat Lab or Python Programming Language, and analysis can be done using any of the machine language model.
VI. REFERENCES
[1] Khurshid and Barkatullah, “Entropy and Power Analysis of Brain Signal Data by EEG Signal Processing”. International Journal of Engineering Development and Research. Volume 4, Issue 3│ISSN: 2321-9939, 2016.
[2] Signal Processing – Wikipedia retrieved from https://en.wikipedia.org >wiki > signal_... on 25/10/ 2018.
[3] T. Lewis, “Human Brain: Facts, Functions & Anatomy”. Livescience, 2018.
[4] Thesilverbird.com: Schizophrenia-Symptoms, Causes & Treatment of Schizophrenia retrieved from
https://www.thesilverbird.com/schizophrenia-symptoms-causes-treatment/ on 25/10/2018.
[5] A. Subasi, E. Ercelebi, “Classification of EEG Signals Using Neural Network and Logistic Regression”. Computer methods and programs in biomedicine; 78:87- 99, 2005.
[6] M. Chandani and A. Kumar, “EEG Signal Processing for Epileptic Seizure Prediction by Using MLPNN and SVM Classifiers”. American Journal of Information Science and Technology. 2(2), PP. 36-41. Doi: 10.11648/ j.ajist.20180202.12, 2018. [7] A. Harvey, “Excel 2007 For Dummies. Wiley”. ISBN
0-470-03737-7., 2006.
[8] G. Harvey, “Excel 2007 Workbook for Dummies” (2nd ed.). Wiley. p. 296 ff. ISBN 0-470- 16937- 0., 2007.
[9] De Levie, Robert, “Advanced Excel for scientific data analysis” Oxford University Press. ISBN 0-19- 515275- 1, 2004.
[10] Bourg, M. David, “Excel scientific and engineering cookbook”. O'Reilly. ISBN 0-596-00879-1, 2006. [11] Roach, “EEG data from basic sensory task in
chizophrenia button press and auditory tone event related potentials from 81 human subjects”.
![Figure 1. The Human Brain (Normal Structure of the Human Brain) [3]](https://thumb-us.123doks.com/thumbv2/123dok_us/676149.1074895/1.612.347.517.615.715/figure-human-brain-normal-structure-human-brain.webp)
![Figure 2. Brain Structure in Schizophrenia [4]](https://thumb-us.123doks.com/thumbv2/123dok_us/676149.1074895/2.612.317.552.56.218/figure-brain-structure-schizophrenia.webp)
![Table I. ERPdataset of Schizophrenia [11]](https://thumb-us.123doks.com/thumbv2/123dok_us/676149.1074895/3.612.314.553.310.715/table-i-erpdataset-schizophrenia.webp)