© 2014, IJCSMC All Rights Reserved
552
Available Online atwww.ijcsmc.comInternational Journal of Computer Science and Mobile Computing
A Monthly Journal of Computer Science and Information Technology
ISSN 2320–088X
IJCSMC, Vol. 3, Issue. 2, February 2014, pg.552 – 557
RESEARCH ARTICLE
Outlier Mining for Removing the Anomalies in
High Dimensional Data Using ARVDH Algorithm
Krupa Mary Jacob
1, K.Sangeetha
2, S.Karthik
3Department of Computer Science and Engineering, SNS College of Technology, Anna University, India
1
[email protected]; [email protected]; 3 [email protected]
Abstract— In Data mining outliers are one of the main threats for efficient information retrieval from databases. Outliers are also known as Anomalies. Mining of outliers from the normal data is very important and scope of this is very high. Anomaly detection can be found in applications such as credit card fraud detection, intrusion and insider threat detection in cyber-security, detection of fault, or malignant diagnosis. Anomalous data present in database is harmful for the processing of information and usage of that information. Viscous data contain erroneous information and it may contain dangerous code for carking the whole system where it is stored. The main drawback of the existing system is, it does not support data with Multiclustering for removing viscous data. To avoid this problem we propose one algorithm which is Algorithm for Removing the Viscous data in High Dimensional data (ARVDH). Simple and efficient steps are used to remove outliers form information
Keywords— Outliers; Outlier mining; Fraud detection; High Dimensional data; ARVDH Algorithm
I. INTRODUCTION
Outlier detection[1] refers detection of data or any thing that deviate from the expected behaviour. This unexpected behaviour is called as anomalies. Anomalies occur in different type. there are mainly three type of anomalies. They are point anomaly, contextual anomaly and collective anomalies. Definition for outliers are Hawkins (1980) –An observation (few) that deviates (differs) so much from other observations as to arouse suspicion that it was generated by a different mechanism[2]Barnett and Lewis (1994)[3]-An observation (few) which appears to be inconsistent (different) with the remainder of that set of data Application of outlier detection are Fraud detection, Network intrusion detection, Satellite image analysis Structural defect detection, Loan application processing, Discovery of astronomical objects, Motion segmentation, Detection of unexpected entries in databases. The approaches for finding the outliers are statistical test, depth based approach, deviation based approach, distance based approach, and high dimensional approach. The cluster based approach that used for outlier detection follows this step for it.
© 2014, IJCSMC All Rights Reserved
553
II. RELATEDWORKS
Most of studies on outlier detection were conducted in the of statistics. These studies can be broadly classified into two categories. The first category is distribution-based, in which a standard distribution (e.g. Normal, Poisson, etc.) is used to the data best. Outliers are defined based on the probability distribution. Over one hundred tests of this category, called discordancy tests, developed for different scenarios (see [6]). A key drawback of these categories that most of the distributions used are univariate. There are some tests that are multivariate (e.g. multivariate normal outliers). But for many KDD applications, the underlying distribution is unknown. The problem is fitting the data with standard distributions is costly, and may not produce satisfactory results.
The second category of outlier studies in statistics is depth-based. In this each data object is represented as a point in a k-d space, and is assigned a depth. With respect to outlier detection, outliers are more likely to be data objects with smaller depths. There are many definitions of depth that have been proposed (e.g. [7], [8]). In theory, depth-based approaches could work for large values of k. In practice, while there exist efficient algorithms for k = 2 or 3 ([8], [9], [10]), depth-based approaches become inefficient for large datasets for k ³ 4. This is because depth-based approaches rely on the computation of k-d convex hulls which has a lower bound complexity of W(nk/2) for n objects. Recently, Knorr and Ng proposed the notion of distance-based
outliers [11], [12]. Their notion generalizes many notions from the distribution-based approaches, and enjoys better computational complexity than the depth-based approaches for larger values of k. . In [13] the notion of distance based outliers is extended by using the distance to the k-nearest neighbor to rank the outliers. A very efficient algorithms to compute the top n
outliers in this ranking is given, but their notion of an outlier is still distance-based. Given the importance of the area, fraud detection has received more attention than the general area of outlier detection. Depending on the specifics of the application domains, elaborate fraud models and fraud detection algorithms have been developed (e.g. [14], [15]). In contrast to fraud detection, the kinds of outlier detection work discussed so far are more exploratory in nature. Outlier detection may indeed lead to the construction of fraud models. Most clustering algorithms, especially those developed in the context of KDD (e.g. CLARANS [16], DBSCAN [17], BIRCH [18], STING [19], WaveCluster [20], DenClue [21], CLIQUE [22]), are to some extent capable of handling exceptions. The main objective of a clustering algorithm is to find clusters, they are developed to optimize clustering, and not to optimize outlier detection. The exceptions (called “noise” in the context of clustering) are typically just tolerated or ignored when producing the clustering result. Even if the outliers are not ignored, the notions of outliers are essentially binary, and there is no quantification as to how outlying an object is. Notion of local outliers share a few fundamental concepts with density-based clustering approaches. However, our outlier detection method does not require any explicit or implicit notion of clusters.
III.OUTLIER DETECTION
Outlier detection is the search for items or events which do not conform to an expected pattern [3]
There are three categories of anomaly detection techniques exist.
A. Supervised Anomaly Detection: In this labels available for both normal data and anomalies.
B. Semi-supervised Anomaly Detection: In this type of anomaly detection labels available only for normal data
C. Unsupervised Anomaly Detection: In this no labels assumed. Based on the assumption that anomalies are very rare compared to normal data
Several anomaly detection techniques have been proposed in literature. Some of the popular techniques are:[4]
a) Distance based techniques
b) One class support vector machines.
c) Replicator neural networks.
d) Cluster analysis based outlier detection.
e) From learned association rules.
IV.ANOMALY DETECTION IN HIGH DIMENSIONAL DATA
To detect the anomalies in High dimensional data, the high dimensional data is reduced to lower dimensions.
© 2014, IJCSMC All Rights Reserved
554
reduction or dimension reduction is the process of reducing the number of random variables under consideration, can be divided into feature selection and feature extraction. Feature selection approaches try to find a subset of the original variables. Feature extraction transforms the data in the high-dimensional space to a space of fewer dimensions
In Anomaly detection the data should transfer from the source to the target. The source means the raw data that contain unwanted data and anomalies. The target means the processed data in which the anomalies are detected. For that Data Extraction Transformation and Loading(ELT) Process is required.[5] For data cleansing Parsing, Correcting, Standardizing Matching, and Consolidating of data need to perform
A. Anomaly Score
Anomaly Score is used to find the amount of anomalies present in the data. If the anomaly score is higher than the threshold value then that data is considered as anomalous. If the anomaly score is less than the threshold the that data is considered as a normal data
V. PROPOSED METHOD
In the proposed model, the anomaly detection is done through the ARVDH algorithm. In this algorithm the method of finding the anomalies is:
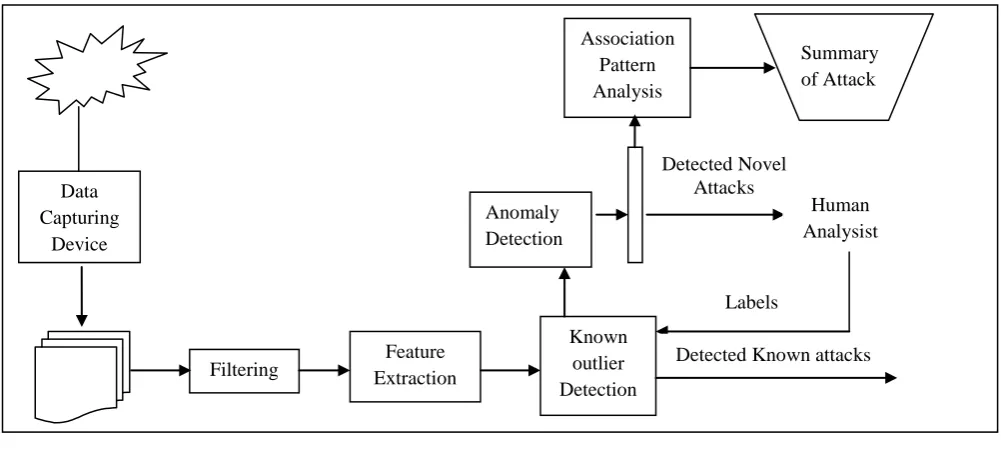
First step is capturing the data using the data capturing device. Second, from the captured data filter that to remove the unwanted data. Then particular feature of the data is extracted from the filtered data. Check that any known outliers are present in the data or not. If known anomaly is there then it is known outlier detection. If the outlier is unknown then go for the Anomaly Detection.
B. Anomaly Detection
To find the anomalies in the data, first step is: Find Anomaly Score. After finding the anomaly score a threshold value is set. If the anomaly score is higher than the threshold value, the data set is considered as anomalous data. Then detected the novel attack. This is used to find the new type of attacks in the system. After finding the anomaly in the data human analyst is done. While finding an anomaly in the system the administrator can analysis the action. If new type of anomaly is detected, then label it as an anomaly by doing this we can find that anomaly in faster manner in next time. Do this process to whole data set. So new anomalies that are find is labeled as detected. For detected anomalies association Pattern Analysis is done and summary of attack is documented.
The local outlier factor[5] is based on a concept of a local density, where locality is given by nearest neighbors, whose distance is used to estimate the density. By comparing the local density of an object to the local densities of its neighbors, one
Data Capturing
Device
Anomaly Detection
Known outlier Detection Feature
Extraction Filtering
Association Pattern Analysis
Summary of Attack
Human Analysist Detected Novel
Attacks
Labels
Detected Known attacks
© 2014, IJCSMC All Rights Reserved
555
can identify regions of similar density, and points that have a substantially lower density than their neighbors. These are considered to be outliers. The local density is estimated by the typical distance at which a point can be "reached" from its neighbors. The definition of "reach ability distance" used in LOF is an additional measure to produce more stable results within clusters.
To detect the abnormal behaviour of the data the various steps involved are data capturing, filtering, feature extraction ,anomaly detection, finding anomaly scores, association pattern analysis, human analysis, Detected known attacks. The outlier detection steps are represented in figure 1
While doing the wed search large amount of data is coming .To identify the outliers form the normal data is very important in the web search.
Algorithm used in this paper is Algorithm for Removing the Viscous data in High Dimensional data (ARVDH).
Algorithm : Algorithm for Removing the Viscous data in High Dimensional data(ARVHD) This algorithm is divided into three parts
Algorithm 1 : BuildDataSet
Algorithm 2 : DimensionalityReduction(min, max, k) Algorithm 3 : Anomaly Detection
Algorithm 1 : BuildDataSet(min, max, k) Inputs:Data Set
k – data set[]
Output: Anomalous Data set
1: if k == Labeled
2: return Known Anomaly
3: else
4:return Anomaly Detection()
Algorithm 1 is used for building the data set for anomaly detection. .k is the variable used to find the anomalies detected is new one or it is already detected and saved as an anomaly in the database
Algorithm 2 : DimensionalityReduction(min, max, k)
//For High Dimensional Data 1:If dimension>1
2: randomly select a dimension q
3: p ← (maxq + minq)/2 //Dimensionality Reduction 4: {Build two data set (Left & Right) from a split into two equal-volume half-spaces.}
5: temp ← maxq; maxq ← p
6: Left ← BuildSingleDimens(min, max, k + 1)
7: maxq ← temp; minq ← p
8: Right ← BuildSingleHS-Tree(min, max, k + 1)
9: return Dimens(Left,Right, SplitAtt ← q, SplitV alue ← p, r ← 0, l ← 0)
10:
end if
Algorithm 2 is used for dimensionality reduction. If the data for anomaly detection is a high dimensional data, dimensionality reduction is required for find the anomaly. Dimensionality Reduction is done until the data is in the form of process able form
Algorithm 3 : Anomaly Detection(ψ, t) Inputs: ψ – data set Size, t – anomaly score
Output: s - anomaly score for each streaming instance x
1: Build data set : Initialise Work Space and call Algorithm 1 for each data set
© 2014, IJCSMC All Rights Reserved
556
each item x in the first ψ instances of the stream
3: Count ← 0
4: while data stream continues do
5: Receive the next streaming point x
6: s ← 0
7: for each data T in dataSet do
8: s ← s + Score(x, T ) {accumulate scores}
9: AnomalyDetection (x,false) {update dataSet l in T }
10: end for
11: Report s as the anomaly score for x
12: Count++
13: if Count == ψ then
14: Update score :s ← s+l for every data set with non-zero score or l
15: Reset score ← 0 for every node with non-zero
16: Count ← 0
17: end if
18:
end while
Algorithm 3 is for finding the anomalies in the prepared data set. I n the anomaly score is calculated. In this a threshold value is set. If the anomaly score is greater than the threshold then it is considered as anomaly. For calculating the score a count is set in the algorithm. By this manner anomalies are tacked
VI.CONCLUSIONS
In this paper anomaly detection of data with high dimension and the steps for finding anomalies in that type of data is discussed. Algorithm for Removing the Viscous data in High Dimensional data is described in this paper which helps to find anomalies in high dimensional data .This algorithm is divided into three parts for preparing data set. For dimensionality reduction, and for anomaly detection. This algorithm can use in a fast and efficient manner
ACKNOWLEDGMENT
I take immense pleasure in expressing my humble note of gratitude to Dr.S.Karthik, Professor & Dean, Dr.T.Kalaikumaran, Professor & Head, Prof. R.M Bhavadaraini(Senior Grade), Mrs.K.Sangeetha, Assistant Professor, Department of Computer Science and Engineering, SNS College of Technology ,Anna University, India for their valuable suggestions and guidance and for their immediate counselling in solving all our problems that arise in the course of completion of this paper successfully.
REFERENCES [1] D.M Hawkins, “Identification of Outliers” Chapman and Hall, 1980
[2] Barnett V., Lewis T., Outliers in Statistical Data. John Wiley, 1994
[3] Konrad Rieck, Ulf Brefeld” Toward Supervised Anomaly Detection” Journal of Artificial Intelligence Research 46 (2013)
235-262
[4] Md Abdul Maleq Khan” Fast Distance Metric Based Data Mining Techniques Using P-trees: k-Nearest-Neighbor
Classification and k-Clustering A Thesis Submitted to the Graduate Faculty Of the North Dako ta State University Of Agriculture and Applied Science December 2001
[5] Shaker H. Ali El-Sappagh a,*, Abdeltawab M. Ahmed Hendawi b, Ali Hamed El Bastawissy” A proposed model for data warehouse ETL processes” Journal of King Saud University – Computer and Information Sciences (2011) 23, 91–104
[6] Barnett V., Lewis T.: “Outliers in statistical data”, John Wiley,1994
[7] Tukey J. W.: “Exploratory Data Analysis”, Addison-Wesley,1977
© 2014, IJCSMC All Rights Reserved
557
[9] Ruts I., Rousseeuw P.: “Computing Depth Contours ofBivariate Point Clouds, Journal of Computational Statistics and Data Analysis, 23, 1996, pp. 153-168.
[10] Johnson T., Kwok I., Ng R.: “Fast Computation of 2- Dimensional Depth Contours”, Proc. 4th Int. Conf. on Knowledge
Discovery and Data Mining, New York, NY,AAAI Press, 1998, pp. 224-228.
[11] Knorr E. M., Ng R. T.: “Algorithms for Mining Distance-Based Outliers in Large Datasets”, Proc. 24th Int. Conf. onVery
Large Data Bases, New York, NY, 1998, pp. 392-403.
[12] Knorr E. M., Ng R. T.: “Finding Intensional Knowledge of Distance-based Outliers”, Proc. 25th Int. Conf. on Very Large Data Bases, Edinburgh, Scotland, 1999, pp. 211-222.
[13] Ramaswamy S., Rastogi R., Kyuseok S.: “Efficient Algorithms for Mining Outliers from Large Data Sets”, Proc. ACM SIDMOD Int. Conf. on Management of Data, 2000.
[14] Fawcett T., Provost F.: “Adaptive Fraud Detection”, Data Mining and Knowledge Discovery Journal, Kluwer Academic
Publishers, Vol. 1, No. 3, 1997, pp. 291-316.
[15] DuMouchel W., Schonlau M.: “A Fast Computer IntrusionDetection Algorithm based on Hypothesis Testing of Command
Transition Probabilities”, Proc. 4th Int. Conf. on Knowledge Discovery and Data Mining, New York, NY, AAAI Press,
1998, pp. 189-193
[16] Ng R. T., Han J.: “Efficient and Effective Clustering Methods for Spatial Data Mining”, Proc. 20th Int. Conf. on Very Large Data Bases, Santiago, Chile, Morgan Kaufmann Publishers, San Francisco, CA, 1994, pp. 144-155.
[17] Ester M., Kriegel H.-P., Sander J., Xu X.: “A Density-Based Algorithm for Discovering Clusters in Large Spatial
Databases with Noise”, Proc. 2nd Int. Conf. on Knowledge Discovery and Data Mining, Portland, OR, AAAI Press, 1996,
pp. 226-231
[18] Zhang T., Ramakrishnan R., Linvy M.: “BIRCH: An Efficient Data Clustering Method for Very Large Databases”, Proc. ACM SIGMOD Int. Conf. on Management of Data, ACM Press, New York, 1996, pp.103-114.
[19] Wang W., Yang J., Muntz R.: “STING: A Statistical Information Grid Approach to Spatial Data Mining”, Proc. 23th Int. Conf. on Very Large Data Bases, Athens, Greece, Morgan Kaufmann Publishers, San Francisco, CA, 1997, pp. 186-195. [20] Sheikholeslami G., Chatterjee S., Zhang A.: “WaveCluster: AMulti-Resolution Clustering Approach for Very Large Spatial
Databases”, Proc. Int. Conf. on Very Large Data Bases, New York, NY, 1998, pp. 428-439.
[21] Hinneburg A., Keim D. A.: “An Efficient Approach to Clustering in Large Multimedia Databases with Noise”, Proc. 4th Int. Conf. on Knowledge Discovery and Data Mining, New York City, NY, 1998,pp. 58-65.
[22] Agrawal R., Gehrke J., Gunopulos D., Raghavan P.: “Automatic Subspace Clustering of High Dimensional Data for Data
Mining Applications”, Proc. ACM SIGMOD Int. Conf. on Management of Data, Seattle