IN THIS
ISSUE
Trends in Range Managemenf Educafion.... _________.__.____________________--- Thadis W.Box Cosf of Tree Removal Through Chemicels
C. 0. McCorkZe, Jr., A. H. Murphy, Lynn Rader, and D. D. Caton
Seeding Wesfern Wheafgrass wifh Increasing Rafes of Perennial Ryegrass or Smoofh Brome in Waferways..._...___._____J. L. Launchbaugh
Vegefafional Responses Following Winged Elm and Oak Confrol in Oklahoma...R. L. Dalrymple, Don D. Dwyer, and P. W. Santelmann
Aerial Applicafion of Herbicides for Confrol of Sand Sagebrush
R. W. Bovey
The Relafion of Grazing fo Planf Succession in fhe Tall Grass Prairie
William T. Penfound
Sixweeks Fescue as a Deferrenf fo Blue Grama Ufilizafion
D. N. Hyder and R. E. Bement
Technical Nofes:
Effecf of Liffer Treafmenf on Germinafion of Species Found Under Manzanifa (ArctostaphyZos)....George E. Glendening and C. P. Pase
Some Yield Characferisfics of Range as Influenced by Soil Type and Weafher ___________ ______________._.___..----.-.---.____.---____---.---.._---.---- Hugh E. Cosby
Evidence of Hybridizafion Befween Cerfain Browse Plan&
Arthur D. Smith
Effecf of Time of Ferfilizer Applicafion on fhe Seed and Forage Yield of Russian Wild Ryegrass_...T. Lawrence and M. R. Kilcher Managemenf Nofes:
Infegrafed Managemenf of Public and Privafe Lands....DiZZard H. Gates
Effecfs of Droufh on Mesquife..._...___._________.____MeriZ G. Carter
Planf Display Board Sells Good Managemenf.._...Robert F. Pearson, Jr.
Book Reviews: The Oregon Deserf (Robert E. Wilber); The Trail Drivers of Texas (B. W. Allred); Range Research Mefhods (Laurence E. Riordan and Dean E. Medin); Agrosfology (Gene F. Payne); Roofs in
fhe Soil (R. S. Campbell) _____________________.___________________________________._.___.___.______~_____________ Currenf Liferafure _______________________ ________ ____________________ ____ _________________________________________._____~_____
News and Nofes...____._...
Infernafional..._~._____..~._~___.___~._.~__._._._..______._._._._._._...
Range Sfudenf Roundup... ____ ___________________________________________.~._.._._~._.._____._.__._.~.~._~~_~_ Wifh fhe Secfions..._..._... _____ _________________________________________..___._._._________._.._.~_._._.__ Leffer fo fhe Edifor... ________ ____ _____ ________________________________________~~__._._._~_._._.~___.____.___.___..__.
Sociefy Business ________________________________.___.______~_______.__.___.__________~~____________________.__._.._.__~_.~._._._~
237
242
245
249
253
256
261
265
266
269
272
274 275 276
277 260 264 265 266 290 292 293
Cover Photo-Lands
for Integrated Management
Photo by Dillard H. Gates, see sioryJournal of
Volume 17, No. 5
September, 1964
RANGE MANAGEMENT
Trends in Range Management Education
THADIS W. BOXProfessor o j Range Management, Texas Technological College, Lubbock, Texas
Highlight
This survey indicaies that fofal enrollment and demand for range graduates are increasing. Fewer siudenfs are looking fo the govern- meni for employment as more jobs in private industry become available. If the current trend continues, there should be plenty of studenis from range schools fo fill range jobs. The range profession must aci to see that all students who call themselves range men have training acceptable to the profession.
Range management is one of
the fastest growing areas of bio-
logical science. Rangelands cover
some 700 million acres in the
United States, and the range
management profession is called
upon to furnish trained person-
nel to increase production on
these lands.
During the past few years,
there was a severe shortage of
men with range management
degrees. Frequently employers
were forced to hire poorly
trained men or men trained in
fields other than range manage-
ment. Holscher, et al. (1963)
predict that the demand for col-
lege trained range men will in-
crease throughout the 1960’s. A
recent report to the Society of
Range Management at Wichita,
Kansas, indicated that the Feder-
al government alone hired some
100 range graduates a year. Even
with the cutback in Federal em-
ployment, there is still a con-
stant demand for range manage-
ment graduates.
The Range Management Edu-
cation Council appointed a com-
mittee in February 1964 to com-
pile statistics on the availability
of range management students
and the trends in the supply of
range management personnel
from the various schools. This
paper reports the findings of that
survey.l It is presented to the
profession in order to bring
about a better understanding of
the problems in range education.
Questionnaires were sent to
all Range Management Educa-
tion Council members asking for
statistics. In addition,
each
RMEC member was asked to
compile a list of non-member
schools that offered range train-
ing in its state. All college cata-
logs on file at the Texas Techno-
logical College Library were
searched for evidence of range
training and questionnaires were
sent to all schools whose catalog
indicated at least one course in
range management.
In addition,
questionnaires
IThis is a condensation of a report by the author, Charles E. Poulton,
and Joseph H. Robertson. The au- thor is grateful for review by Drs.
Poulton and Robertson and the en-
tire Range Management Education Council. Thanks are due to the many representatives o j educational institutions who supplied material for the report. However, the author assumes complete responsibility for errors, omissions, or mis-interpre- tation of material.
237
were sent to junior colleges
listed in the Health, Education,
and Welfare publication
of
colleges t e a c hin g agriculture
(Brunner, 1960) to determine if
any junior colleges were teach-
ing range management or offer-
ing pre-range management coun-
seling.
The survey revealed that 18
institutions offered range man-
agement degrees recognized by
the Range Management Educa-
tion Council,
13 additional
schools offered range degrees or
sufficient courses in range man-
agement to meet civil service
standards, 32 additional schools
taught some range work, but not
enough to meet civil service
standards, and 16 colleges of-
fered pre-range
management
counseling.
238
sm
Table 1. Enrollmeni by classes af Range Managemenf Educafion Council Schools during 1963-64.
School Fresh. Soph. Jr. Sr. Grad.
Univ. of Arizona 5 16 9 10 19
Brigham Young Univ. 17 15 8 7 2
Univ. of California 2 2 6 5 6
Colorado State Univ. ___. 15 25 15 2
Ft. Hays State College 12 15 16 18 4
Univ. of Idaho --__ ___. 13 11 6
Montana State College ____ 13 7 8 2
Montana State Univ. _._. ____ 8 10 2
Univ. of Nebraska 3 2 6 6 ___.
New Mexico State Univ. 18 13 12 14 2
Univ. of Nevada ____ 1 2 1 14
Oregon State Univ. 4 3 8 5 11
So. Dakota State Univ. ____ 6 3 5
Texas A & M Univ. 22 11 11 26 -‘;
Texas Tech. College 11 17 18 14 6
Utah State Univ. 13 16 26 48 22
Washington State Univ. 4 4 7 4 ____
Univ. of Wyoming 5 5 10 10 1
TOTAL 115 148 197 217 100
1 Graduate students not reported.
Records at most institutions
show that junior, senior, and
.graduate s t u d en t s eventually
graduate. Therefore, only these
students were used in compiling
trends. Enrollment in advanced
classes increased by about one-
half in the last five years (Table
2). Junior enrollment increased
56%, senior 51oJ0,
_and graduate
61%. Table 2 shows consistently
more seniors than juniors the
previous year. Likewise, the
junior classes reported in Table
1 are generally larger than pre-
vious sophomore classes. These
data reflect the large number of
students transferring into range
management from other dis-
ciplines, some even as late as
their senior year. A recent grad-
uating class of 14 range manage-
ment students at Texas Techno-
Table 2. Trend in enrollmenf figures of junior, senior, and graduafe range sfudenfs af RMEC schools during fhe pasf five years.
Year Junior Senior Graduate
1960 131 139 62
1961 132 143 64
1962 176 152 71
1963 194 171 85
19641 197 217 100 IEstimates based on reports of
schools in April, 1964.
logical College had only one stu-
dent who had started his college
work in his major field. In addi-
tion, many graduate students in
range management do their un-
dergraduate work in some close-
ly related field.
Although senior enrollment
for the past 5 years was up 51a/o,
this increase was not uniformly
distributed
among schools.
Schools reporting a substantial
increase during the past 5 years
are California, 33%
;Ft. Hays
State College, 39%; University of
Nebraska, 100%; New Mexico
State University, 100%
;South
Dakota State College, 25%; Tex-
as A & M University, 73%
;Texas
Technological College,
360%;
and Utah State University, 41%.
All but two of these schools are
in the Plains or Southwest,
where less emphasis is placed on
government employment than in
the mountain and far-western
schools. Enrollment increases
were greatest in states with rel-
atively large amounts of private-
ly owned land.
The majority of range gradu-
ates are produced by a few
schools. One school, Utah State
University, had 22% of the
seniors in the survey. The top
6 schools furnished 62% of the
seniors and 10 schools had 82%
of the senior enrollment.
The number of degrees in
range management from the 18
RMEC member schools steadily
increased during the past 5
years. A total of 643 B.S. de-
grees, 135 MS. degrees, and 38
Ph.D. degrees were awarded
during the period 1960-64 (Table
3). Schools vary from a high of
127 B.S. degrees to a low of 3
during the 5 year period. Six
schools awarded 71% of the
masters degrees, although 16 of
the 18 schools offer graduate
work in range management. Un-
dergraduate degrees in range in-
creased 48% during that time,
masters degrees, 88%, and Ph.D.
degrees remained relatively stat-
ic (Table 4). The increase in un-
dergraduate degrees in 1964 over
1963 was the greatest for the 5
year period.
Table 3. Tofal number of degrees granfed by RMEC member schools,
1960-64.
School B.S. M.S. Ph. D. ____-
Univ. Arizona1 22 15 6 Brigham Young Univ.2 4 ____ ____ Univ. of California1 16 14 5 Colorado State Univ.2 74 9 ---. Ft. Hays State Coll.2 57 21 __._ Univ. of Idaho1 31 7 ---- Montana State Coll.2 31 6 ____ Montana State Univ.2 24 2 _.__ Univ. of Nebraska” 9 1 .___ N. Mex. State Univ.2 23 2 _.__ Univ. of Nevada2 3 6 ____ Oregon State Univ.1 10 5 4 So. Dak. State Univ. 21 ____ ____ Texas A &M Univ.1 80 10 6 Texas Tech Colleges 40 2 ____ Utah State Univ.1 127 19 7 Wash. State Univ. 20 ____ ____ Univ. of Wyoming1 50 16 10
TOTAL 643 135 38
IInstitution offers Ph.D. and MS. 2Institution offers M.S. only. Table 4. Degrees granfed in range
managemenf af RMEC member schools during fhe pasf five years.
Year B.S. M.S. Ph.D.
1960 106 16 5
1961 124 27 6
1962 128 33 10
1963 128 25 9
1964 157 34 8
RANGE EDUCATION 239
Seven
RMECschools offer doc-
torate degrees in range manage-
ment. Six of the schools gave
from 4 to 10 doctorates. One
school, the University of Idaho,
awarded no Ph.D. degrees dur-
ing the 5 year period. However,
their doctorial program began in
1960 and they have 4 Ph.D. can-
didates nearing completion of
their work.
Enrollment af Non-RMEC Schools Offering Major Work
in Range Management
Not only are enrollments in-
creasing in most RMEC schools,
but large numbers of students
are qualifying for civil service
employment
at non-RMEC
schools. Civil service require-
ments are so low that only six
hours of “range management”
plus some supporting work will
“qualify” an individual for range
work.
Thirteen schools reported that
they offered work qualifying
graduates for civil service posi-
tions in range management. The
amount of work in range man-
agement varied greatly between
the schools. Apparently some
rather strong curricula, perhaps
equal to those now in the Range
Table 5. Junior and senior students enrolled in courses leading to civil service qualification af non-RMEC schools during 1963-64.
Hrs. School Jr. Sr. Range Abilene Christian
College (Tex. ) 10 6 12 Arizona State College 8 6 12 California Polytechnic
College 14 12 6.67 (San Luis Obispo)
Humboldt State
College (Calif.) 20 15 6 Kansas State College 8 3 9 McNeese State
College (La.) 15 15 6 North Dakota State ____ 18 12 Oklahoma State Univ. 9 9 16 Iowa State Univ. 8 8 6 Southwest Texas State 7 5 9 Stephen F. Austin
(Tex.) ____ __._ .___ Sul Ross State (Tex.) 4 4 8 Univ. of Arkansas 2 1 6
survey, it is impossible to report
subject matter coverage in the
courses.
Eight non-RMEC
schools listed Stoddart
and
Smith (1955) as their text for
one of the courses, three listed
Sampson (1952), two Humphrey
(1962)) two Hitchcock (1950))
and several others listed local
flora or forestry texts. From the
selection of texts alone, it can be
meeting civil service qualifica-
tions in range management were
in non-RMEC schools. The non-
member school with the largest
senior enrollment had more
seniors than all but 3 of the
member schools. Four non-mem-
ber schools had senior enroll-
ments greater than 11 member
schools.
Almost all non-RMEC schools
showed interest in the Council.
Only 2 of the schools surveyed
gave a flat “no” to the question
of possible interest. Most of the
schools showed interest in im-
proving their curricula.
The 100 seniors and 104 juniors
in non-RMEC schools may be ex-
pected to fill a large portion of
the range jobs available. Some
graduates may be well qualified;
others may have received only a
minimum amount of range work
from a teacher who has never
had a range course himself, has
never conducted research in
range, nor has attended a single
professional meeting in range
management.
Since most schools are inter-
ested in improving their curricu-
la, there is a fertile field for the
RMEC in working with these
institutions. Likewise, an aver-
Management Education Council
assumed that course work varies
age of ‘7 new Ph.D.‘s is turned
exist.
Others simply offer
greatly among schools.
out in range each year who could
enough range courses to qualify
The title of the degrees and be used to teach in these insti-
their graduates for government
the administrative department
tutions.
positions. Actual course offer-
ings in range varied from the
minimum of 6 semester hours to
16 semester hours (Table 5).
In all schools except one, the
range management courses are
offered in the home institution.
Stephen F. Austin College re-
ported that beginning in 1965 its
forestry students would be sent
to Texas A & M University for
one semester for special training
in range management.
In most
cases, the range courses are
taught by one individual, al-
though some schools did indicate
that two or more instructors
were used.
Since syllabi of courses were
not specifically requested in the
in charge of the curriculum
varied greatly among non-RMEC
schools. Only one offers a degree
in range management. Five give
the degrees in agronomy with an
option in range management, 3
give degrees in forestry, 2 in
general agriculture, and one
each in wildlife management
and botany. Six of the 13 schools
are in states which do not have
institutions offering a major in
range management.
Other
schools are in states having one
or more schools offering range
management degrees. All ex-
cept one are state supported
schools.
Almost one-third of the total
senior enrollment, 102 students,
Schools Teaching Range as a Service Course
A total of 32 schools reported
some range work as a service
course for other disciplines
(Table 6). Ten schools reported
range courses taught in the for-
estry departments, 8 schools
taught range in the agronomy
program, 8 taught it as animal
science, and 2 taught it as
botany.
240
BOX
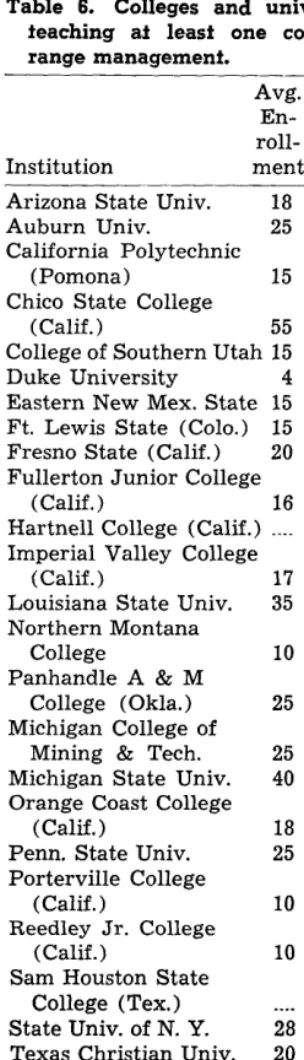
Table 6. Colleges and universities
teaching
afleasf one course in
range management.
range management ranged from
2 to 5 semester hours. Many
times it was difficult to tell what
is taught in the courses. Ten
schools listed Stoddart
and
Smith (1955) as their major
text, 3 listed Sampson (1952))
and others listed various texts in
agronomy, forage crops, wildlife
management, and forestry.
Institution
Avg. Se- En- mester roll- Hrs. in ment Range Arizona State Univ. 18
Auburn Univ. 25 California Polytechnic
(Pomona) 15
Chico State College
(Calif.) 55
College of Southern Utah 15 Duke University 4 Eastern New Mex. State 15 Ft. Lewis State (Colo.) 15 Fresno State (Calif.) 20 Fullerton Junior College
(Calif.) 16
Hartnell College (Calif.) ____ Imperial Valley College
(Calif .) 17
Louisiana State Univ. 35 Northern Montana
College 10
Panhandle A & M
College (Okla.) 25 Michigan College of
Mining & Tech. 25 Michigan State Univ. 40 Orange Coast College
(Calif.) 18
Penn. State Univ. 25 Porterville College
(Calif.) 10
Reedley Jr. College
(Calif.) 10
Sam Houston State College (Tex.)
State Univ. of N. Y. 28 Texas Christian Univ. 20 Univ. of Georgia 40 Texas A & I College 15 Univ. of Missouri ____ Univ. of Washington 10 Univ. of West Virginia ____ West Texas State Univ. 15 Univ. of
British Columbia ____ Univ. of Chihuahua ____
3 3.33 4 3 3.33 2 3 3.33 3 4 3 3 3 3.33 4 3 3 3 3 3 4 3 3 3 3 3 3 5 2 3 ._-_ .___
questionnaire, but many wrote
letters explaining their offering
in range. Professor
George
Thompson of Iowa State Univer-
sity indicated that he had sur-
veyed forestry schools in the
U. S. on their range offerings
and was preparing a paper for
the Journal of Forestry report-
ing his results.
Credit for service courses in
An average of 501 students per
year are exposed to range man-
agement as a service course in
schools not offering major work
in range management. No at-
tempt was made to determine
the number of students taking at
least one range course in schools
offering major work in range
management. However, it is ap-
parent that well over 1000 stu-
dents are exposed to some work
in range management each year.
Evidently, there is much varia-
tion in the type of work that stu-
dents receive in their “range
management” courses.
Foreign Universities Offering
Range Training
Catalogs from the University
of British Columbia and the Uni-
versity of Chihuahua indicate
that courses in range are taught
in those institutions. In addition,
several special programs are
offered in the Middle East, Afri-
ca, and South America. How-
ever, since programs in other
countries are considerably dif -
ferent from those in the United
States, no attempt was made to
determine the equivalent semes-
ter hours taught.
Range Work in Junior Colleges
Little can be reported on range
work in junior colleges. First,
few of the questionnaires were
returned. Second, there is no
standard pre-range course such
as for pre-medical, pre-veteri-
nary, or even pre-forestry stu-
dents.
Seven junior colleges teach a
course in range management.
Another 16 reported that they
offer pre-range work. In most
cases this pre-range work con-
sists of basic science courses plus
counseling from the instructor
as to the degree requirements in
range management at some
school with which the instructor
is familiar. Many times this
school may be his alma mater
or
some nearby college. It appeared
that pre-range counseling was
offered only where the agricul-
ture or botany teacher was range
oriented and had some exposure
to the field himself.
Junior colleges offering pre-
range counseling are located in 5
states: 6 in California, 6 in Tex-
as, 2 in Utah, and one each in
Colorado and Nebraska. Several
other junior colleges indicated
that they did not separate their
pre-range students from the pre-
forestry curriculum, which is
much better established.
Vocafional Training in Range
Texas Christian University has
a unique program in range man-
agement. Although it offers only
one college credit course in
range, it has a yearly range man-
agement institute for vocational
training. The program does not
carry college credit, and is de-
signed especially for students de-
siring a terminal program at the
vocational level. Normally 20
students per year take the exten-
sive, practical training and re-
turn to their ranches.
Several junior colleges wrote
notes indicating plans for initiat-
ing two year terminal training in
range management.
Judging
from the comments of junior col-
leges and the success of the Tex-
as Christian University program,
there is a need for vocational
training in range for students
who, for some reason, cannot
take a college degree.
One apparent difficulty in the
vocational approach is that it
handicaps the able student who
later decides to take a degree in
range management.
Texas
cannot be counted toward a de- gree. If additional vocational programs are initiated, admin- istrators in charge of the pro- grams must be extremely care- ful in their counseling in order to prevent subsequent loss of time and credit to students who may eventually continue their range work for college credit.
Some Problems in Range Education
Range management enroll- ment in the United States has shown a considerable increase during the past 5 years. In addi- tion to a 51% increase in senior enrollment in RMEC member schools, range work in non- member schools has grown steadily.
Students from non-RMEC schools now make up almost one third of the total enrollment. While many of the schools have good curricula, there is much variation in the offerings. Judg- ing from the reported texts used in range courses, the concept of range varies from agronomy, wildlife, or forestry to that com- monly held by RMEC member schools. An employer, when hir- ing from some schools, may not know whether he is getting a range man or a man qualified by six semester hours of something called range management taught by a professor of dairy science.
Apparently, the strong de- mand for range trained individ- uals has led to some minimal of- ferings and low standards. Civil service standards are set to allow maximum availability of person- nel. Many times, as in the case of range, these minimum stand-
RANGE EDUCATION
ards are below that acceptable to the profession. These minimum standards then become the maxi- mum for some institutions seek- ing employment for their stu- dents.
The problem becomes more acute when the availability of qualified professors for the range programs is considered. There are 63 schools in the United States teaching at least one course in range manage- ment. Many schools have sev- eral range men on their staff. Only 38 doctorates have been awarded in the past 5 years, and only a limited number prior to that time. Research institutions compete for the terminal degree candidate. Consequently, many schools which should hire a range Ph.D. settle for an agrono- mist, a botanist, or a forester and the problem of range education is confounded rather than solved. Even among RMEC schools the problem is acute. The move of only one man in a key school may set off a reaction that will ultimately involve 4 or 5 schools. This demand for experienced range teachers has established a tendency in some schools offer- ing service courses to have non- range personnel teach range courses rather than run the risk of serving as a training ground for professsors in range schools. Even though total enrollment in range schools is increasing, demand for range graduates is also increasing. Fewer students are looking to the government for employment as more jobs in private industry become avail- able. If the current trend con-
241
tinues, there should be plenty of students from range schools to fill range jobs. Competition for the good student will probably increase as more private jobs be- come available, and the poor stu- dent may have to take a second choice job.
The large number of students from schools with apparently low standards will also be in the employment market. The range profession must take action to see that all students, regardless of school, who call themselves range men have training accept- able to the profession. This will involve education of educators themselves that minimum civil service standards are not accept- able standards for measuring a range manager.
LITERATURE CITED
BRUNNER, HENRY S. 1960. Enrollment and degrees in agriculture at insti- tutions of higher eudcation. Publ. 03-56006, U. S. Dept. of Health, Education, and Welfare, Washing- ton, D. C. 70 pp.
HEADY, HAROLD F. 1961. Range cur- ricula. Jour. Range Mangt. 14: 301-314.
HITCHCOCK, A. S. 1950. Manual of grasses of the United States. U. S. Dept. Agr. Misc. Publ. 200. 1051 pp. HOLSCHER, CLARK, LEON R. NADEAU,
AND GERALD THOMAS. 1963. Em-
ployment outlook for range man- agers. Occupational Outlook Quar- terly 7: 1-4.
HUMPHREY, R. R. 1962. Range Ecol- ogy. Ronald Press, New York. 247 PP.
SAMPSON, A. W. 1952. Range Man- agement principles and practices. John Wiley. New York. 570 pp. STODDART, L. A. AND A. D. SMITH.
1955. Range Management. Mc- Graw-Hill. New York. 2nd Ed. 433 pp.
Range Plant Judging Contest
Cost of Tree Removal Through Chemicals’
C. 0. McCORKLE, JR., A. H. MURPHY, LYNN RADER, AND D. D. CATONPro jessor o j Agricultural Economics and Agricultural Economist in the Experiment Station and on the Gian- nini Foundation, University of California, Davis; Spe- cialist in the Experiment Station and Superintendent of
Hopland Field Station, University of California; Range
Economist, Division of Range Management, Forest Ser- vice, U. S. Department of Agriculture, Washington, D. C.;
and Agricultural Economist, Farm Production Economics
Research Division, Economic Research Service, U. S. De- partment of Agriculture, Department of Agricultural Economics, University o j California, Davis.
Highlight
Four things musi be known fo esiimafe cost of chemical free freaf-
menf : labor performance raies, quantify of material, wage rafe, and unit cost of material. La;bor and ma- terial requirements are related fo free diameter, siand density, and species treated.
Density of tree cover is a
major determinant of forage pro-
duction in woodland-grass
ranges. Heavily wooded areas
support only a sparse herbaceous
understory of less desirable for-
age species; whereas, open wood-
lands with widely scattered trees
may be as productive as open
range. Thus, removal of trees
from denser areas may result in
both improved forage quality
and increased forage production.
Murphy and Crampton (1964)
reported that forage yield under
chemically
treated blue oak
(Quercus douglasii)at Hopland
exceeded that of open ground
the growing seasons following
treatment. Natural revegetation
may be relied on or seeding with
desirable forage species may be
carried out to vegetate cleared
areas. Although trees may be
removed by felling or by the use
of bulldozers, these methods are,
under certain conditions, pro-
hibitive in cost. Estimated costs
of $80 to $200 have been reported
by the California Agricultural
Extension Service (Berry, et al.,
1955). Accordingly, much at-
tention has been focused on the
use of chemicals as a more eco-
nomical method of removing
trees (Johnson, et al., 1959 and
Leonard, et al., 1956).
This article is concerned with
the cost of chemical tree treat-
ment based on data collected at
the University of California’s
Hopland Field Station in south-
eastern Mendocino County be-
tween December 1959 and April
1960. Four l-acre plots of densely
wooded grass range were treated
with 24-D applied by injector-
type applicators. The diameter,
species, treatment time, and
moving time between trees were
recorded for each plot and re-
gression analyses of these data
provided estimates of the influ-
ence on treatment and moving
time of species, diameter of trees,
and density of stand.
Material and Labor Costs
Costs of such treatment in-
clude chemical materials and
labor. Per acre costs for mate-
rials vary with the type and con-
centration of chemicals used as
well as with the number and
diameter of trees treated. The
use of 2,4-D at the rate of 0.075
ounce of actual chemical per
inch of diameter has proved to
be effective for most of the trees
and larger shrubs in woodland
grass areas (Leonard, et al.,
1956).
IGiannini Foundation Paper No. 254. 2Includes making axe frills and ap-
plying chemicals or using injector-
type applicators.
242
Per acre costs for labor in-
clude time spent in actual appli-
cation of chemicals,2 in moving
between trees, and in mixing
chemicals and filling chemical
applicators. In addition, there is
time wasted or lost. Regression
analysis indicates that the di-
ameter and species of trees
treated largely influence the
time necessary for actual chemi-
cal application (Table 1). First,
the data indicate that treatment
time for all species increases
linearly with increases in the di-
ameter of trees treated. Second,
by holding diameter constant, it
is clearly evident that there are
significant differences in treat-
ment time between species, aris-
ing from their individual growth
habits. For example, blue oaks
and small diameter black oaks
are quickly treated because they
have relatively thin bark and
isolated main stems.. Large di-
ameter black oaks, however,
have long treatment times be-
cause their thick and spongy
bark not only impede penetra-
tion to the cambium layer but
also clog the chemical ports of
the injector tool. Live oaks and
madrones also have long treat-
ment times because they grow in
clumps with as many as 8 main
stems coming from a limited
base area. And, during the
treatment of any one stem, adja-
cent stems obstruct and thus
prolong frilling and applying
chemicals. (Thick bark on large
diameter live oaks make treat-
ment additionally time consum-
ing.)
Manzanitas have long
treatment times because they
often grow low and parallel to
the ground, making treatment
on the undersides of the main
stems a slow process.
Additional regression analysis
indicates that the time spent
moving between trees varies
COST OF TREE REMOVAL
Table 1. Labor fime for chemical applicafion in seconds per free. Diameter of trees - inches
Species 4 5 6 7 8 9 10
Blue oak 11.7 14.3 17.0 19.6 22.3 25.0 27.6 Black oak 12.9 19.0 25.1 31.2 37.2 43.3 49.4 Live oak 23.5 30.1 36.7 43.3 49.9 56.5 63.1 Madrone 28.2 31.8 35.5 39.1 42.7 46.3 50.0 Manzanita 25.3 31.3 37.3 43.3 __ _.-_ ____._ ____._
density. However, moving time does not increase proportionally with density. For example, as the number of trees per acre in- creases five times the moving time increases only three times.
The labor required in mixing chemicals and filling applicators, including lost or wasted time, averaged about 35 percent of the total labor time per acre.
Effect of Species, Diameter, and Density
Relationships between tree species, diameter, and total per acre costs are indicated in Table 3. For all species, estimated per acre costs increase with in- creases in the diameter of trees treated. For small diameters, total per acre costs of treating live oaks, madrones, and man- zanitas are consistently higher than those for treating blue oaks and black oaks of comparable di- ameters. However, at large di- ameters, per acre costs of treat- ing black oaks approach those for treating large diameter, live oaks, madrones, and manzanitas. These cost estimates are based on a density of 120 trees per acre, labor costs at $1.50 per hour, 2,4-D applied at a rate of 0.075
Table 2. Effect of number of frees freafed on moving fime.
Number of trees Moving time in treated per acre minutes per acre1
50 5.5
100 8.1
150 10.7
200 13.3
250 15.9
IMoving time in minutes (Y) as a function of number of trees treated (X) on the Hopland experiment can be expressed as Y = 2.95 + 0.052 X; r = 0.86; t = 8.305.
ounce per inch of tree diameter at a cost of $1.05 per pound.
The effect of tree density on cost of treatment is illustrated in Table 4. Estimated per acre cost of treating blue oaks of the same average diameter increases from $2.45 when 50 trees are treated to $7.20 when 150 trees are treated Table 4, part A). This increase in cost results from the longer time spent moving between trees in the denser stand and from the greater cost of materials used in treating the larger total diam- eter of the denser stand. The cost of treating 50 blue oaks with average diameter of 20 inches is $6.63 while the cost of treating 150 blue oaks with average di- ameter of 6.6 inches (holding total diameter of all trees the same) costs $6.85 (Table 4, part
243
B). Theoretically, the cost of mater’ials in both treatments is the same since the total diam- eters treated are identical. Granting this, the difference in cost of treatment results mainly from the increased moving time within the denser stand.
Discussion
In summary, four things must be known to estimate the cost of chemical tree treatment: labor performance rates, quantity of material used, the wage rate, and the unit cost of the material used. Wage rates and material costs are generally easily ascer- tained. Labor performance rates and material requirements have been shown to be determined by diameter of trees treated, the density of the stand, and the spe- cies and are typically estimated in terms of hours and gallons per acre respectively. No allowance for variation in labor productivi- ty has been incorporated in the cost estimates included in Tables 3 and 4 though this additional variable can be easily intro- duced.
As is often the case with other
Table 3. Cosf per acre for chemical free treafmenf by species and diameters1 Total per acre cost of treatment
.____.
Diameter of Blue Black Live
trees treated oak oak oak Madrone Manzanita ---__ (Dollars) - - - -
3 2.69 2.54 3.22 3.74 3.60
5 4.23 5.15 5.34 5.41 5.35
7 5.77 6.95 7.37 7.09 7.07
9 7.30 8.75 9.43 8.75 ______
11 8.85 10.56 11.50 10.42 ______
IThese estimated costs are based on the following conditions: density of 120 trees per acre, labor at $1.50 per hour, and 2,4-D applied at a rate of 0.075 ounce per inch of tree diameter at a cost of $1.05 per pound.
Table 4. Effect of number of frees per acre and average free diameter on costs of chemical freafmenf of blue oak.
A -- B
Blue oak trees Average Total cost of Average Total cost of- per acre diameter diameter treatment diameter diameter treatment -- -- (Number) - (Inches) - - (Dollars) - - (Inches) - - (Dollars)
50 7 350 2.45 20.0 1,000 6.63
75 7 525 3.65 13.3 1,000 6.68
100 7 700 4.85 10.0 1,000 6.75
125 7 875 6.00 8.0 1,000 6.80
244
McCORKLE ET AL
types of range improvement
practices, little information is
available on which to base ex-
pectations of increased grazing
capacity following tree removal.
Darrow and McCully (Darrow,
et al., 1959) report a fivefold in-
crease in forage production with
complete treatment and a two-
fold increase with partial treat-
ment. Average yields per acre
of oven dry forage, for 3 years
after treatment, increased from
222 pounds to 504 and 1,290
pounds for partial and complete
treatment, respectively. Follow-
ing the treatment of a stand of
blue oaks with 2,4-D Johnson et
al., (1959) report that density of
herbaceous vegetation increased
from 35 percent to 70 percent
and contained a higher propor-
tion of desirable annual grasses.
And, average production of dry
matter per acre increased from
278 pounds to 1,409 pounds. Simi-
larly, although forage produc-
tion was not measured, visual
observations on the Hopland
plots show pronounced increases
in the quantity of forage grasses
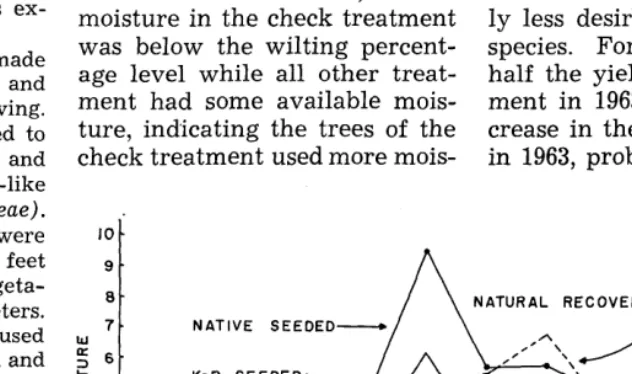
(Figure 1).
Tree removal, as a type of
range improvement, yields no
significant change in season of
use where increased production
is through natural revegetation.
However, observations do indi-
cate that green forage under a
tree canopy is available earlier
as well as later than the forage
in open areas. Thus, while forage
production was not measured in
connection with data reported
here, it seems that although total
forage production can be
in-creased by complete tree remov-
al, leaving a few trees may result
in a somewhat longer grazing
season on green feed.
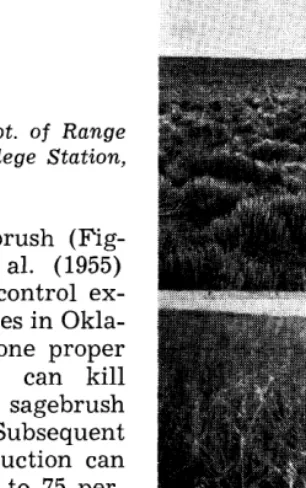
FIGURE 1. Left: Two different sections prior to treatment in December 1959. Right: Same
sections, respectively, in January 1963, three years after treatment. Note increase in
understory vegetation.
Summary
Density of tree cover, a major
determinant of forage produc-
tion in woodland-grass ranges,
treatment of individual trees.
can be changed by chemical
Labor and materials costs, the
requirements
I
essential cost components, are
are functionally
related to diameter of trees
determined by the quantity of
treated, density of stand, and
species treated. Therefore, costs
pkr acre to treat trees can be re-
labor and materials used and
lated to these same variables
their prices. Labor and material
and, additionally, to the prevail-
ing wage rates and cost of chem-
ical material used.
. me
LITERATURE CITED BERRY, L. J., V. P. OSTERLI, L. L.
DAVIS, AND F. J. HILLS. 1955.
Agronomy notes for farm advisors working with field, forage, oil, range, and seed crops. Univ. of Calif. Agr. Ext. Serv. pp. 9-12.
range improvement in the post DARROW, ROBERT A. AND WAYNE G.
Texas Agr. Exp. Sta. Serv. Bulle- MCCULLY. 1959. Brush control and oak-blackjack oak area of Texas. tin 942. College Station, Tex. 16 pp. JoHNsoN, WALTER, CYRUS M. MCRELL,
RAYMOND A. EVANS, AND L. J. BERRY. 1959. Yield and aualitv of annual grass forage following 2,4-D appplication on blue oak trees. Jour. Range Mangt. 12:18-20. LEONARD, 0. A., AND W. A. HARVEY.
1956. Chemical control of woody
plants in California. Calif. Agr. Exp. Sta. Bulletin 775: 18-19. MURPHY, ALFRED H. AND BEECHER
CRAMPTON. 1964. Quality and yield of forage as affected by chemical removal of Blue oak (Quercus douglasii). Jour. Range Mangt. 17: 142-144.
Do you have an extra Journal, January, 19643
Seeding Western Wheatgrass with Increasing
Rates of Perennial Ryegrass or Smooth Brome
in Waterways’
J. L. LAUNCHBAUGH
Pasture Management Specialist, Fort Hays Branch, Kansas AgricuZturaZ Experiment Station, Hays, Kansas.
Highlight
Western wheatgrass was planted at 8 lbs. per acre with increasing rates of perennial ryegrass and smooth brome in a new waterway. Perennial ryegrass increased until the second or third season, then was replaced by western wheafgrass. Smooth brome increased and domi- nated all plots. If seems advisable fo use short-lived, unadapted plants such as perennial ryegrass as com- panion species fo western wheat- grass.
Western wheatgrass
(A g r o - pyron smithiiRydb.) occurs as
a major dominant in many west-
ern Kansas waterways. Atkins
(1957) reported that although
slow to become established, west-
ern wheatgrass eventually pro-
duces a dense, thrifty sod more
suitable for waterway protection
than many tame grasses. Tame
grasses establish quit kly but
often require intensive manage-
ment to maintain adequate cover
(Cooper, 1957).
Since rapid coverage and last-
ing soil protection are both de-
sirable in establishing grassed
waterways, planting a tame spe-
cies with western wheatgrass in
the proper combination was pos-
tulated as a means of obtaining
both objectives i.e. rapid initial
coverage by a tame species and
in time, permanent coverage by
western wheatgrass
through
plant succession. This study com-
pares plantings
of western
wheatgrass seeded at a constant
rate with increasing rates of
each of two tame grasses having
different growth habits, namely
perennial ryegrass (Lolium pe-
renneL.)-a bunchgrass,
and
lcontribution No. 189, Fort Hays
Branch, Kansas Agricultural Ex-
periment Station, Hays, Kansas.
smooth brome (Bromus inermis
Leyss.)-a
sod forming species.
Specific objectives were to de-
termine the effects of tame-spe-
cies planting rates on first-year
seedling numbers, and to record
foliage cover and species com-
position changes in relation to
initial stands under waterway
conditions. Results of planting
in 1959 and cover changes during
five successive growing seasons
are reported and discussed.
Experimental Area and Methods
Luebs (1962) described the ex-
perimental area on the Fort Hays
(Kansas) Branch Experiment
Station at Hays. The soil is silty
clay loam, representative
of
many upland areas in north-cen-
tral Kansas. The site had a crop-
ping history of wheat, sorghum,
and summer fallow for nearly 50
years previous to this experi-
ment. Native vegetation on sim-
ilar soils consists of buffalograss
(Buchloe
dactyloides
[Nutt.]
Engelm.) , blue grama (Bouteloua
gracilis
[H.B.K.] Lag. x Steud.),
and western wheatgrass in vary-
ing mixtures. Species composi-
tion is influenced to a large ex-
tent by intensity of livestock
grazing (Launchbaugh, 1957).
Mean annual precipitation for
the area is 22.94 inches, with an
average of 17.74 inches during
the growing period, April to Oc-
tober. There were significant
moisture deficits the first five
months of 1962 and from October,
1962, to July, 1963, otherwise
drought periods were infrequent
and of relatively short duration,
especially during months of most
active plant growth. Summer
temperatures generally
were
245
slightly lower than the mean,
while winter temperatures fre-
quently were 10 to 15 degrees
below long-time means.
A waterway was shaped and
berms constructed during the
winter of 1957-58. Although the
site possessed natural drainage,
it was necessary to move several
inches of topsoil from the center
to the berms to create a uniform
channel. Thus in shaping, site
qualities of the channel were
altered in relation to the side
slopes where topsoil was depos-
ited. Ellis forage sorghum was
sown thickly on the waterway in
July, 1958. Average production
was approximately 4,000 pounds
of dry matter per acre, which
was left undisturbed for seedbed
cover. Grass was planted April
15, 1959, using a four-row plot
drill equipped with double-disk
planters, packers, and V-belt
seed conveyors to distribute
known quantities of seed evenly
in a prescribed length of row.
Seed placement was 1/2 to 3/4 inch
deep in one-foot row spacings.
The experiment consisted of two
whole plots (in which the seed-
ing rate of western wheatgrass
was constant at 8 pounds per
acre) and eight subplots each
for perennial
ryegrass
and
smooth brome at increasing rates
from 0 to 24 pounds per acre in
combination with western wheat-
grass. Planting rates in pounds
per acre and in terms of calcu-
lated viable seeds (PLS) per
foot of row are shown in Table
1. Subplots were 12 rows, 16 feet
long. The planting mixtures
were replicated in three random-
ized blocks for each whole plot.
Two replications were located on
the sloping sides of the water-
way where soil was deposited
and the third in the channel area
where topsoil was removed.
Planting was done at right angles
to the longitudinal axis of the
waterway.
246 LAUNCHBAUGH
Table 1. Rafes of companion species planfed with wesiern wheafgrass seeded af a consfanf rafe of 8 pounds per acre or approximafely 12 PLS per foof of row.
Approximate PLS Planting rates per foot of row of companion p erennial Smooth
species ryegrass brome
(lb./A.) - - (number) - -
0 0 0
% 2 1
1 4 2
2 8 4
4 16 8
8 32 16
16 64 32
24 96 48
IPure live seed estimated from puri- ty and germination analyses.
ments of each row, and foliage cover estimates by species based on the means of six independent ocular estimates per subplot by two observers each fall for five seasons.
Results
tained from one to 10 western wheatgrass seedlings per 13 feet, in most instances with no appar- ent relationship to the abun- dance of companion seedlings. Both companion grasses pro- duced seedling numbers in linear proportion to the planting rates, with highly significant positive correlation coefficients of over .90. Average number of viable seeds needed to obtain one seed- ling by species follows: perennial ryegrass, 17; smooth brome, 21; and western wheatgrass, 56. Con- siderable differential in the abil- ity of the various species to emerge and persist under similar field conditions is indicated, or questionable relationships exist between seed quality analyses and responses to field planting conditions. In addition to produc- ing more seedlings per unit of viable seed, the tame species produced considerably more uniform stands than did western wheatgrass.
First-year Seedling Numbers. -Seedlings of all species began to appear by late April, 1959, and continued to emerge during May. Total numbers on September 1, 1959, are shown in Table 2. Ini- tial stands of western wheatgrass were highly variable and were influenced significantly only by the highest seeding rates of pe- rennial ryegrass and smooth brome. Individual rows con-
Foliage Cover and Species Composition.-All species in- creased by tillering. Figure 1 shows the changes in foliage cover during five successive growing seasons. Important dif- ferences in total cover were manifest during the first and second seasons when plots con- taining western wheatgrass alone and the lower populations of tame species had much less cov-
Table 2. Firsf-year seedlings resulfing from planting western wheafgrass af a consfani rafe in separafe mixtures wifh fwo companion species af various rates.
Planting rates Seedlings produced by: of
companion species
Western Perennial Western Smooth wheatgrass ryegrass wheatgrass brome (lb./A.) - ---
0 25
r/2 36
1 28
2 42
4 37
8 21
16 19
24 3
(Number/100 feet of row) - - - L
0 26 0
25 16 5
38 18 9
51 14 18
132 14 27
236 21 116
394 15 137
442 8 213
L.S.D. .05 1% _._... 13 __-.__
r( seeding and seedling rate number ) _-.. .99** _-._ .94’”
erage than those with the higher densities of perennial ryegrass or smooth brome. By the end of the third season, coverage was nearly the same regardless of companion species seeding rate. Thereafter, total foliage cover apparently was influenced by growing conditions rather than original seedling numbers.
Species composition changes during the five years were in- fluenced by companion species and initial proportion of seed- lings. Western wheatgrass was relatively very low in amount at the end of the first growing sea- son, especially at the higher seeding rates of perennial rye- grass and smooth brome. How- ever, the wheatgrass increased consistently at the expense of perennial ryegrass and was the only species present after four growing seasons. Western wheat- grass associated with various amounts of smooth brome, on the other hand, increased in per- centage to the third and fourth growing seasons then decreased in relative coverage. At the end of the fifth growing season, smooth brome dominated all plots where it occurred in the planting mixture except those at the half pound per acre rate. There it nearly equalled western wheatgrass.
Discussion
WATERWAY PLANTINGS
COMPANION SPECIES WESTERN PERENNIAL SEEDING
WHEATGRASS RYEGRASS
RATE WESTERN SMOOTH (LB./A.) WHEATGRASS BROME
100
1
FiCURE 1. Annual chang:s in foha g;r: cover and composition of western wheatgrass alone
and in s:pxate combination; with various planting rates of perennial ryegrass and
smooth brome.
significant reductions in num- ber and development of asso- ciated perennial grass plants. When already well established, annual ryegrass crowded out a large number of perennial grass seedlings throughout the grow- ing season and retarded develop- ment of those that survived.
Rapid spread of persistent plants is desirable in all newly
seeded stands. This is a primary objective in revegetating a waterway where excess runoff must be carried with minimum soil loss. The cover of western wheatgrass alone and with the lower rates of either companion species did not equal the desir- able coverage resulting from high rate combinations until the end of the third growing season.
I6 50
24 50
0 ;---;---...“““\‘\,,\y
1959 1960 1961 1962 1963
247
Studies by McWilliams (19%) have shown that yields from light seeding rates are lower in new stands, but increase and be- come equal to or greater than yields from heavier seeding rates as the stands age. Presumably narrower row spacing would have compensated somewhat for paucity of stand within the row and resulted in more comparable total cover by the end of the second season regardless of ini- tial stand. However, it appears that first-year stands of west- ern wheatgrass, because of sparse populations and tillering, seldom would offer erosion protection comparable to mixtures with species that tiller profusely and are leafier. Older stands of west- ern wheatgrass, unless grazed or mowed and raked cleanly, con- tain accumulated old plant resi- due in addition to current growth and appear to provide effective erosion protection under water- way conditions.
248
ryegrass may have been more adversely affected by drought than either western wheatgrass or smooth brome. The fifth-sea- son drought was about equally detrimental to both western wheatgrass and smooth brome.
The aggressiveness of smooth brome agrees with observations by Atkins (1957)) that on water- ways where soil fertility and permeability were favorable for the growth of tame grasses, in- crease in native grasses was slow in competition with smooth brome. Cooper (1957) stated that tame grasses such as smooth brome, in contrast to native spe- cies, eventually need intensive management including fertiliza- tion to maintain adequate cover for waterway requirements. A longer period of observation is necessary to determine the com- parative staying qualities of western wheatgrass and smooth brome under the condition of this
study.
These plantings, characteristic of newly reseeded areas, had varying densities of first-season annual weeds including kochia (Kochia scopuria [L.]
Schrad.) ,
pigweed (Amaranthus spp.) , and several minor species. Weed densities were not high enough to smother the grass seedlings nor to influence their develop- ment significantly. If weed pop- ulations do not prevent the es- tablishment of a desirable grass cover, their presence in the early stages may serve some purpose by adding to the total vegeta- tion cover. Weeds persisted dur- ing the second year in plots with open grass cover, but were es- sentially absent from all plots thereafter.Significant differences existed between replications in initial
LAUNCHBAUGH
grass seedling numbers and sub- sequent total vegetation cover. The plots were located so that each slope below the berms con- stituted two replications and the channel area, a third. In each instance, seedling numbers and foliage cover estimates were lower in the center replication than in adjacent locations. Top- soil transfer during waterway construction and consequent alteration of site potential prob- ably accounted for the differ- ences observed.
Summary and Conclusions Western wheatgrass was planted at a constant rate in separate combinations with in- creasing rates of perennial rye- grass and smooth brome in a newly shaped waterway at Hays, Kansas. Data on first-year stands and plant cover changes during five successive growing seasons are presented.
Western wheatgrass seedling numbers varied but were low- ered significantly only by the highest rates and seedling den- sities of both companion species. Seedling numbers of companion grasses were in linear proportion to the number of viable seeds planted.
Foliage cover of western wheatgrass alone and with the lower seeding rates of tame grasses was less until the third growing season compared with plots containing higher seeding rates of introduced grasses. Total foliage cover was not influenced by original planting rates after the third growing season.
Two trends in plant succession were observed. Perennial rye- grass increased in foliage cover until the second or third season, then began to decline and was
replaced completely by western wheatgrass before the end of the fifth growing season. Smooth brome, in contrast, increased rap- idly and dominated the plots at all rates except the lowest by the end of the fifth growing season.
In view of these findings it appears that high initial cover- age may be achieved by includ- ing tame species at high seeding rates with western wheatgrass. For plant succession to culminate in western wheatgrass domi- nance within a few years, it seems advisable to use a short- lived, unadapted species such as perennial ryegrass as the com- pan i on species, otherwise adapted, more aggressive tame species may delay or prevent the desired trend in plant suc- cession.
LITERATURE CITED ATKINS, M. D. 1957. Permanent
waterways. Crops and Soils 10 (2) : 14-15.
COOPER, H. W. 1957. Some plant ma- terials and improved techniques used in soil and water conserva- tion in the Great Plains. Jour. Soil and Water Conserv. 12: 163-168. LAUNCHBAUGH, J. L. 1957. The effect
of stocking rate on cattle gains and on native shortgrass vegeta- tion in west-central Kansas. Kan. Agr. Exp. Sta. Bul. 394. 29 pp. LUEBS, R. E. 1962. Investigations of
cropping systems, tillage methods, and cultural practices for dryland farming at the Fort Hays (Kansas) Branch Experiment Station. Kan. Agr. Exp. Sta. Bul. 449. 114 pp. MCWILLIAMS, JESSE L. 1955. Effects
of some cultural practices on grass production at Mandan, North Da- kota. U. S. Dept. Agr. Tech. Bul. 1097. 28 pp.