Available online: https://edupediapublications.org/journals/index.php/IJR/ P a g e | 2757
Lung Pattern Classification for Interstitial Lung Diseases
Using a Deep Convolutional Neural Network
K Yajusha& Dr.M.Narsing Yadav
PG Scholar1, Professor2 Department of Electronics and Communication Engineering, MRIET,Hyderabad,TS,India1,2
Abstract:-
- Lung nodules is a circle or oval that is often found on chest radiograph (X-ray) or computed tomography (CT) scan. Lung nodules usually do not cause a symptom, usually found incidentally on chest Xray or CT. Diagnosis process performed by observing CT Scan. The further process by taking a sample of tissue in the lungs and perform laboratory tests. This procedure is not effective. The aim of this study was develop software to detect lumps on pulmonary CT scan images are nodules or artery. This study consists of five steps. The first step is to build user interface. The second is to develop software for lung segmentation using Active Shape Model. The third is to develop software for candidate pulmonary nodules segmentation using mathematical morphology. The fourth is detection of pulmonary nodules using Support Vector Machine (SVM). The fifth is a 3-D visualization of pulmonary nodules using volume rendering.
Key Words:
ASM, Mathematical Morphology, NN
I-INTRODUCTION:
Available online: https://edupediapublications.org/journals/index.php/IJR/ P a g e | 2758 Cryptococcus’s, oraspergillosis. The possibility
of inflammation is not caused by an infection, but a result of rheumatoid arthritis, Wegener's granulomatosisSarcoidosis. Among other causes are congenital anomalies (birth defects) as cystic lung and pulmonary malformations [5]. If there is a suspicion of lung cancer, it will be diagnosed in more advanced with chest X-ray and CT Scan. In the X-ray will reveal a picture of a tumor or a liquid, while the CT scan, you will see a tumor, fluid or lymph node enlargement.
Furthermore, to ensure nodules or not to be held laboratory tests of samples of sputum and phlegm. It is also taken of lung tissue or gland, for laboratory test. Diagnostic process as above is not effective. Therefore we need a software that can automatically detect lung nodules. Several studies relating to the detection of nodules automatically among others [6] - [11]. The aim of this study is to develop a pulmonary nodule detection software. This study consists of five steps. The first step is to build user interface.
The second is to develop software for segmentation of lung using Active Shape Model (ASM). The third is, to develop software for segmentation candidate pulmonary nodules using mathematical morphology. The fourth is
detection of pulmonary nodules using NN. The fifth is a 3-D visualization of pulmonary nodules. The end result is a software that can detect an existing image in CT lung nodule or artery
II-MATERIALS:
The data used in this study is the CT images of 30 patients. Image sliced in axial CT scan. Image size of 505x427 pixels, and a thickness of 0.5 - 10 mm
Available online: https://edupediapublications.org/journals/index.php/IJR/ P a g e | 2759 thresholding parameter (T). For the proposed
method we have used dynamic thresholding technique discussed . The value of thresholding parameter is calculated using the formulae discussed below to each pixel and it ’s neighborhood pixel. The thersholding values we are getting low specification value.
Fig -1:Lung ct scan image with axial sices
3. METHODS
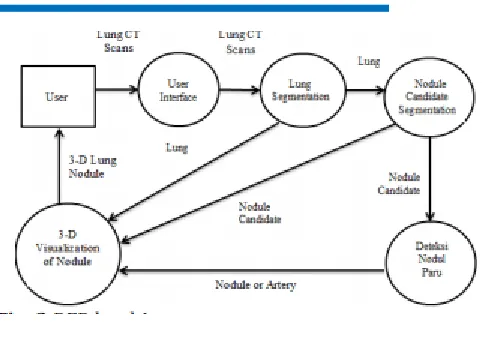
Software development for the detection of pulmonary nodules can be explained by using Data Flow Diagrams (DFD) as in Figure 2. Data Flow Diagrams (DFD) level 1 illustrates the flow of information and transformation which is applied when the data is moved from input to output. At the DFD level 1 detection system of pulmonary nodules present, there is only one entity that is friendly, and there are five processes, namely the process of making the user interface, the process of segmenting the lung, pulmonary nodule segmentation process, the process of detection of pulmonary nodules and pulmonary nodule visualization process
Fig -2:DFD level 1
Nodule Candidates Segmentation
Method used for segmentation of nodule candidate is mathematical morphology [14] - [16]. Step-by-step process of segmentation
candidate pulmonary nodules using
Available online: https://edupediapublications.org/journals/index.php/IJR/ P a g e | 2760 will be carried out Mathematical morphological
processes.
b. Edge Detection Edge detection of objects is
an operation to detect significant changes in gray level of an image. Changes in the level of intensity is measured by a gradient image. For example, an image f (x, y) is a two-dimensional function, the gradient vector of x and y, respectively, are a first derivative with respect to x and y that can be written in the form of an equation
c. Threshold
Thresholding is a process of separation of the pixels based on its degree of gray. Pixels that have a gray level less than the prescribed limit will be given a value of 0, while gray pixels that have a greater degree than the limit will be changed to value 1.
d. Dilation
Dilatation function is added for each pixel on the outskirts of a binary object that is an area that has a value of 1. Where dilatation added 8 pixels interconnected to the surrounding objects. And dilation is a process of combining the dots background (0) become part of the object (1). The use of dilation is put the pivot point S at point A. Give the number 1 for all points (x, y) that is exposed to or affected by the structure of S in that position. Dilation equation shown in Equation
D(A,S)=A+S (8)
e. Fill Images Area To fill image area used
algorithms based on morphological
reconstruction. Definition of the image area is an area of dark pixels surrounded by lighter pixels. After the image location is determined, the next operation is to fill location (image area) using four neighboring connection background for the image of input 2-D and 6-connected background neighbors for 3-D input. Output of this process is an area surrounded by brightly colored pixels will have a value of one.
Erosion
Erosion function is to eliminate 8 pixels of the binary object associated with the periphery of the object. Erosion is the elimination of the object point (1) become part of the background (0). The use of erosion is place the pivot point S at point A is. If any part of S which are beyond the pivot point A deleted or used as background. Erosion is shown with equation
E(A,S)=AxS
g. Multiplication Image multiplication
Available online: https://edupediapublications.org/journals/index.php/IJR/ P a g e | 2761 (11) with Th ≥ 1 F(x,y) is the original image,
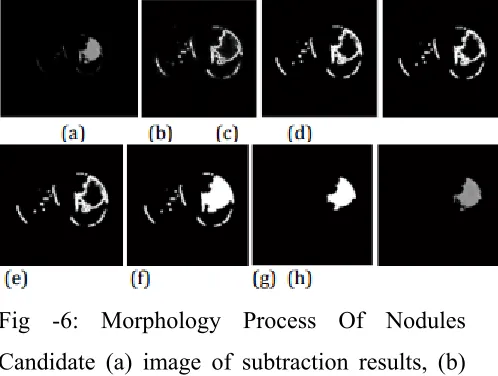
and Nf (x, y) is image of multiplication of intensity of the original image with a value of Th. In this study, process of multiplication is a multiplication of image of the mask candidate nodules result of erosion process results, with image results in a reduction of complement. Results of candidate nodule segmentation using mathematical morphology can be seen.
Fig -5: Subtraction process of image (a) Lung Image, (b) Negative Image, (c) Subtraction Results Between a and b image.
Fig -6: Morphology Process Of Nodules Candidate (a) image of subtraction results, (b) results of edge detection with convolution prewitt, (c) image of threshold
Lung parenchyma fields segmentation
Some radiologists of Postgraduate Institute of Medical Education & Research (PGIMER), Chandigarh, INDIA suggested to remove the mediastinum part (central Part) from lung images as it is difficult to determine the malignancy at that place even for medical professionals. To view the same, the lung parenchyma fields are separated. The process of lung parenchyma field’s segmentation is according to the following steps
Optimal Thresholding: The image is
thresholded to extract low-density tissue region (e.g. Lung parenchymas) from fat area.
Background removal: The surrounding air,
identified as low–density tissue, is removed. 3. Cleaning: It is performed to fill the holes in the binary image.
Lung mask: To extract lungs from
background, lung mask is created.
Lung Extraction: Output of step 4 is subtracted
from the original image to provide separated lung parenchymas for further processing.
Local binary pattern formulation
Available online: https://edupediapublications.org/journals/index.php/IJR/ P a g e | 2762 its discriminative power and computational
simplicity. Given an image I of size n × m grayscale pixels and we denote with I() gray level of the th pixel of the image I, the LBP operator is calculated at each pixel by evaluating the binary differences of the values of a small circular neighborhood(with radius R) around the value of a central pixel . Mathematically, the LBP value of current pixel is given:
Where
gc: gray value of the center pixel
gp: gray values of the circularly symmetric neighborhood
gp (p= 0, . . .,P-1).
P: Image Pixels in the circle of radius R(R > 0) that form a circularly symmetric neighbor set respectively 2p : binomial factor for each sign s(gp- gc)
A histogram is generated to represent the texture image after finding the LBP code of each pixel in the image. LBP derivation with example using 3x3 neighborhood. In this, each LBP is regarded as a micro-texton4 . Local textons include spots, flat areas, edges, line ends and
corners. the different texture primitives detected by the uniform patterns of LBP. In the figure 4, gray circle indicates center pixel, Black and white circles correspond to bit values of 0 and 1 in the different patterns of the operator.
Neural Networks
The network classifies input vector into a specific class because that class has the maximum probability to be correct. In this paper, the PNN has three layers: the Input Layer, Radial Basis Layer and the Competitive layer. Radial Basis Layer evaluates vector distances between input vector and row weight vectors in weight matrix. These distances are scaled by Radial Basis Function nonlinearly. Competitive Layer finds the shortest distance among them, and thus finds the training pattern closest to the input pattern based on their distance.
Fig.neural network analsis on retina
.
Available online: https://edupediapublications.org/journals/index.php/IJR/ P a g e | 2763
Accuracy:- Accuracy is also used as a statistical
measure of how well a binary classification test correctly identifies or excludes a condition. among the total number of cases examined. To make the context clear by the semantics, it is often referred to as the "rand accuracy. It is a parameter of the test.it shows in the command window..
Acc=(Tp+Tn)/(Tp+Tn+Fp+Fn)
Sensitivity:-In medical diagnosis,
test sensitivity is the ability of a test to correctly identify those with the disease (true positive rate).
Sensitivity =Tp/(Tp+Fn).
Specificity:-Whereas test specificity is the
ability of the test to correctly identify those without the disease (true negative rate).
Specificity =Tn/(Tn+Fp).
CONCLUSION
Based on the tests, it can be concluded that software detection of pulmonary nodules by using neural networks proved capable of being used as a model for the detection of lung nodules.
ACKNOWLEDGEMENT
We would like to thank the Ministry of Research and Technology of Republic Indonesia, through Director General of Higher Education, which has helped fund our research through competitive grants research program in 2015. We also thank the Hospital Dr. Moewardi Surakarta, especially the radiology department, which has allowed us to do some research.
REFERENCES
[1] U.S. Cancer Statistics Working Group, United States Cancer Statistics: 1999–2012 Incidence and Mortality Web-based Report. Atlanta (GA): Department of Health and Human Services, Centers for Disease Control and Prevention, and National Cancer Institute, 2015. [2] Horn, L; Pao W; Johnson DH, Chapter 89, In Longo, DL; Kasper, DL; Jameson, JL; Fauci, AS; Hauser, SL; Loscalzo, J. Harrison's Principles of Internal Medicine (18th ed.). McGraw-Hill. ISBN 0-07-174889-X, 2012. [3] Lung Carcinoma: Tumors of the Lungs, Merck Manual Professional Edition, Online edition. Retrieved 15 August 2007.
[4] Lu C, Onn A, Vaporciyan AA et al., "78: Cancer of the Lung". Holland-Frei Cancer Medicine (8th ed.). People's Medical Publishing House. ISBN 978-1- 60795-014-1, 2010.
[5] Collins, LG; Haines C; Perkel R; Enck RE
Available online: https://edupediapublications.org/journals/index.php/IJR/ P a g e | 2764 management, American Family Physician
(American Academy of Family Physicians) 75 (1): 56–63. 2007. [6] Golosio B, Masala GL, Piccioli A, Oliva P, Carpinelli M, A novel multithreshold method for nodule detection in lung CT. Med Phys 36(8): 3607–3618, 2009. [7] Messay T, Hardie R, Rogers S, A new computationally efficient CAD system for pulmonary nodule detection in CT imagery. Med Image Anal 14(3): 390–406, 2010.
[8] Riccardi A, Petkov TS, Ferri G, Masotti M, Campanini R, Computer-aided detection of lung nodules via 3D fast radial transform, scale space representation, and Zernike MIP classification. Med Phys 38(4): 1962– 1971, 2011.
[9] Camarlinghi N, Gori I, Retico A, Bellotti R et al, Combination of computer-aided detection
algorithms for automatic lung nodule
identification. Int J CARS 7(3): 455–464, 2011. [10] Tan M, Deklerck R, Jansen B et al., A novel computeraided lung nodule detection system for CT images. Med Phys 38(10): 5630– 5645, 2011.
[11] Hardie RC, Rogers SK, Wilson T, Rogers A., Performance analysis of a new computer aided detection system for identifying lung nodules on chest radiographs. Med Image Anal 12(3): 240–258, 2008.
[12] T. F. Cootes, A. Hill, C. J. Taylor, and J. Haslam, The use of active shape models for
locating structures in medical images, Image Vis. Computing, vol. 12, no. 6, pp. 355–366, 1994.
[13]Sri Widodo, Wijiyanto, Lung Field Segmentation On Computed Tomography
Image Using Active Shape Model,
JurnalKursor, UniversitasTrunojoyo, Volume 7, Nomor 2, Juli 2013, pp 99-108, 2013.
[14] Yu-qian, Zhao, etc, “Medical Images Edge
Detection Based on Mathematical
Morphology”, Proceedings : IEEE Engineering in Medicine and Biology 27th Annual Conference Shanghai, China, September 1-4, 2005. [15] Angenent, S., Eric Pichon, and Allen
Tannenbaum, Mathematical Methods in
Medical Image Processing, Buletin of the American mathematical society, 2000
. [16] Charles RG, Edward RD, Morphological methods in image and signal processing. Prentice Hall, New Jersey, 1988. International
Research Journal of Engineering and
Technology (IRJET) e-ISSN: 2395-0056 Volume: 02 Issue: 06 | Sep-2015 www.irjet.net p-ISSN: 2395-0072 © 2015, IRJET ISO 9001:2008 Certified Journal Page 360
Available online: https://edupediapublications.org/journals/index.php/IJR/ P a g e | 2765 [18] Cristianini N, Shawe-Taylor J., An
introduction to support vector machines and
other kernel-based learning methods.
Cambridge University Press, Cambridge, 2000. [19] Burges CJC, Tutorial on support vector machines for pattern recognition. Data Min Knowl Disc 2(2): 121– 167, 1998.
Author Profile 1:
Ms. K.Yajusha, completed B.Tech
inElectronics & communication Engineering
in 2015 from Malla Reddy Institute of Engineering and Technology, Affiliated to JNTU-Hyderabad, Telangana, India and M.Tech in Wireless & Mobile, Communications in 2017(pursuing) from Malla Reddy Institute of Engineering and Technology , Affiliated to JNTU- Hyderabad, Telangana, India.Area of interest includes research in IVPAdvanced LTE.
E-mail id:[email protected]
Author Profile 2:
Mr. Narsingh Yadavis currently working as Head of the Department in Malla Reddy Institute of Engineering and Technology, Affiliated to JNTU
Hyderabad,Telangana .He has completed his
B.Tech from Gurunanak Engineeringcollege, affiliated to JNTU Hyderabad University in 2006 and he did mastersMS under universityof California SAN DIEGO .He did his Ph.D(Wireless Networking) , from university of