International Journal of Scientific Research in Computer Science, Engineering and Information Technology © 2017 IJSRCSEIT | Volume 2 | Issue 6 | ISSN : 2456-3307
An Assessment on Effects of Air Pollution Using Machine
Learning
S. Jeya1 , Dr. L. Sankari21Research Scholar, Department of Computer Science, Sri Ramakrishna College of Arts and Science for Women,
Coimbatore, India
2Associate Professor, Department of Computer Science, Sri Ramakrishna College of Arts and Science for Women,
Coimbatore, India
ABSTRACT
Atmospheric pollutants P.M10, SO2, NO2, CO, and Ground level Ozone affect our ecosystems and are harmful to
human health. Air Pollution has been identified to cause several respiratory and heart ailments which lead to thousands of deaths every year. Children are more susceptible to such ailments than adults. Metropolitan areas are worst affected from air pollution caused by industries and automobiles. With the help of statistical models built using machine learning and data mining techniques, computerised medical support systems could be designed to aid in treating diseases triggered by pollution. Also the models can be useful in predicting future pollution trends based on current data in order to help manage and control toxic atmospheric emissions.
Keywords: Air Pollution, Respiratory ailments, Machine learning, Air Quality.
I.
INTRODUCTION
A. Air Pollution : Air pollutants cause a serious negative impact on earth's ecosystems, by altering the earth's atmosphere physically, chemically and biologically. Gases like Sulphur dioxide (SO2),
Nitrogen dioxide (NO2), Carbon monoxide, Methane,
ground Ozone combined with particulate matter and lead are the leading contributors that pollute air and cause smog and acid rains. They also alter the balance of earth's atmosphere and lead to global warming.
Sources of air pollution are mostly anthropogenic; exhausts from automobiles, aircraft, marine vessels, industrial exhausts, burning of fossil fuels, wastes from warfare such as nuclear radiation, toxic gases, germ warfare.[9] Burning of fossil fuels release SO2 and NO2
which contribute to acidification of lakes and streams. Particulate matter (P.M2.5, P.M10) comprised of solids
and liquid droplets floating in the air are a result of combustion. Industrial emissions, automobile exhausts and dumping of chemical solvents in landfill react with existing pollutants to create ground Ozone.
Apart from impacting ecosystems, air pollutants affect human health; ground Ozone reacts with sunlight and
causes lung irritation and asthma. Particle pollution triggers ailments like heart attacks, asthma, emphysema, pneumonia, bronchitis and migraines. Exposure to SO2 and NO2 affects respiratory systems in
children. Air pollutants also deplete atmospheric Ozone which in turn leads to penetration of harmful UV radiation leading to skin and eye cancers. UV radiation also affects vegetation and ecosystems. [10]
The World Health Organization 2016 bulletin 94:487 - 488 proposes, usage of clean energy sources, regulating automobile traffic, banning diesel vehicles, discouraging heavy use of automobiles by increasing fuel taxes and parking fees in order to reduce the overall pollution level.
An artificial intelligent system is capable of learning and improving its performance by experience and examples by applying a ‘machine learning approach’. The following are a few of the ways machine learning is achieved:
1. Supervised Learning is where the system, also termed as a classifier, is built by training with inputs and pre-determined results (labels). The resultant classifier is then tested by predicting output for datasets without providing labels and is validated for accuracy.
2. Unsupervised Learning is where a model is trained without any labels. Clustering is a technique where similar data points are assigned to each cluster.
3. Reinforcement Learning is based on building a model which would present states based on input data. A positive or negative feedback from the environment is provided over time which is incorporated into the model to give accurate results over time, e.g. training robots and playing chess games with AI capable machines. [11]
II.
Machine learning algorithms on
determining impacts by poor air quality
Suitable data mining algorithms help forecast the concentration of pollutants in the air, the analysis of association between the pollutants and the causes, and diseases caused by polluted air. Below mentioned are the techniques considered for research in the case studies quoted in this review:
a. Regression:Regression is a data mining technique used for predicting causality between data points.
Based on the various data characteristics, which would act as training inputs, regression technique can be used to predict or forecast data points of interest. There are various models of regression based on the relationship between the training data and forecast data. Linear, nonlinear, multivariate and non-multivariate are the most frequently used to find causal relationships in analyzing human health related datasets. For example, by analyzing attributes of patients suffering from cancer, a model can be built using regression techniques to diagnose cancer at early stages in future patients, thereby making it easier for treatment options with more success at survival.[12]
b. Data Mining with Neural Networks: Data
analysis techniques like classification, clustering, prediction, pattern recognition and feature mining can be done by models employing neural networks. Neural network based models detect and assimilate relationship between variables from huge mass of data sets.[13] The models use optimization
techniques for determining best optimal output and are closely inspired by human brain architecture.
c. Extreme Learning Machine: Extreme learning machines are emergent models, more advanced than neural networks and support vector machines. Capable of faster learning speeds with less human intervention/training, ELMs can easily converge to local minima than other traditional gradient based algorithms where tuning weights and biases iteratively slower the performance.[14] ELM for
SLFNs (Single-hidden layer feedforward neural networks) unlike the traditional feed forward neural network randomly chooses hidden nodes and determines the output weights at an extremely faster speed and have universal approximation and classification capabilities. With the help of ELM models, health care data can be fed to predict and diagnose respiratory ailments and heart diseases with correlation to pollution.
Some of the data mining applications in related to healthcare are prognosis and diagnosis of diseases; trend estimation of diseases in healthcare insurance sector; identifying high risk patients and effective treatment, medical insurance fraud, prediction of disease progress, hospital resource management and controlling infections in hospitals. There is a huge accumulation of medical data, and at times the heterogeneity of data (image, lab data, doctor prescription, observations, talking to patients, video format data, numerical data) can make processing and storage a challenge. There is a need for organization of different sects of data in healthcare sector. [15]
symptoms for diagnosis, and to determine the effectiveness of drugs.
Challenges go hand in hand with potential benefits of applying data mining techniques in disease forecast and prevention. Success is reliant on availability of clean healthcare data. It is crucial that the healthcare industry diligently capture and store data to benefit from data mining analysis. Possible improvements include standardizing clinical vocabulary and sharing data across organizations. It is also essential to enhance text and image mining techniques in the scope of clinical data mining and analysis. [17] Collection of standardized
and accurate atmospheric data across uniformly distributed geographical regions is essential to determine current pollution levels and also to estimate future trends of atmospheric pollutants in order to keep them in check.
III.
Literature Survey
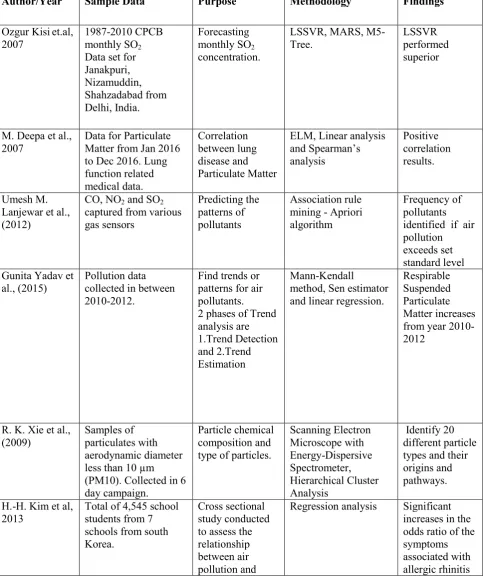
Ozgur Kisi et al., (2017) have forecasted SO2 concentration in parts of Delhi, India by modelling data based on Least square support vector regression (LSSVR), Multivariate adaptive regression splines (MARS), and M5 Model Tree (M5-Tree) techniques. The above models are compared with each other by cross validation method with respect to root mean square error, mean absolute error, and correlation coefficient. Their conclusion suggests that computing models applied in this study proved satisfactory results than the previous studies conducted. [1]
M. Deepa et al., (2017) have proposed Extreme learning machine (ELM) to learn and measure the correlation between PM2.5 and respiratory ailments in
Delhi, India. The data was collected by applying spirometry tests, and sputum sample tests. Correlation between particulate matter and respiratory diseases was identified through Spearman’s analysis. The final result shows a positive correlation between PM and lung diseases in the areas where the study was conducted. [2]
Umesh M. Lanjewar et al., (2012) have proposed association rule mining by applying Apriori algorithm for predicting the patterns of CO, NO2 and SO2
captured from various gas sensors. The frequency of pollutants was identified in a particular area if air pollution exceeds set standard level. [3]
Gunita Yadav et al., (2015) have stated the following statistical methods to find trends or patterns for air pollutants. Two phases of trend analysis are applied - 1.Trend Detection and 2.Trend Estimation. Mann-Kendall method was used for trend detection and Sen Estimator method trend estimation. Having compared the proposed model with linear regression model, the authors conclude that both sen estimator and linear regression are similar in terms of accuracy although performance of sen estimator is better despite the presence of outliers. This study was conducted using pollution data collected in between 2010-2012. The final result indicates that Respirable Suspended Particulate Matter increases from year 2010-2012. [4]
R. K. Xie et al., (2009) have analysed samples of particulate matter collected by Scanning Electron Microscope (SEM) with Energy-Dispersive Spectrometer for chemical composition. Data from SEM collated with Hierarchical Cluster Analysis has been used to identify the particle types chemically and also to identify their sources. [5]
A cross sectional study conducted by H.-H. Kim et al., (2013) assesses the relationship between air pollution and allergic diseases of elementary school children via a survey questionnaire based on International Study of Asthma and Allergies in Childhood. Seven elementary schools were selected in Seoul, Daejeon, Incheon, and Siheung cities in South Korea. The schools were classified based on residential, traffic polluted areas and complex pollutant areas. Regression analysis was applied and asthma, allergic rhinitis, and atopic dermatitis were designated as dependent variable, pollutant concentration as independent variables. The authors concluded that PM, SO2, NO2, and O3, were
found to be associated with allergic diseases in children. [6]
Swati Vitkar (2017) has predicted the future trend on air pollution by applying different data mining algorithms such as Bagging, Linear Regression, Rep Tree, Random Forest, Additive Regression algorithm and SMOreg on data collected from parts of Navi Mumbai, India. By comparing output accuracy,
additive regression is shown closer to the actual values.
[8]
Research works done by various authors using different data mining techniques in the pollution context is given below as a summary for quick perusal to the reader’s in table 1
Summary of literature review Table -1
Author/Year Sample Data Purpose Methodology Findings
Ozgur Kisiet.al, Matter from Jan 2016 to Dec 2016. Lung (PM10). Collected in 6 day campaign.
2013 Total of 4,545 school students from 7 schools from south
allergic disease and the BC and and all disease related data are collected
Secondary data of air pollution for 5 years (2011-15) is collected from MPCB web site for the five zones of Navi Mumbai
Predicted the future trend on air pollution by using existing pattern of air pollution data
Different data mining
The concentration of air pollutants on human health is a cause for grave concern. Real time data on air quality, especially closer to industry sectors and densely populated areas, is useful in determining concentration of various pollutants. Various data mining techniques and models built using machine learning algorithms are useful in determining the correlation between concentration of air pollutants and ill effects on human health. Available results and predictions would aid as a caution against malpractices in industrial emissions, increase public awareness on health and aid government bodies in infrastructure planning.
V.
REFERENCES
[1]. Ozgur Kisi1, Kulwinder Singh Parmar2, Kirti Soni3, Vahdettin Demir4, "Modelling of air pollutants using least square support vector
regression, multivariate adaptive regression spline, and M5 model tree models”, Air Quality, Atmosphere & Health, vol.10, issue 7, pp.873-883, 2017.
[2]. M. Deepa1 & M. Rajalakshmi2 & R. Nedunchezhian2, "Impact of Air Pollution on Respiratory Diseases: Correlation and Classification by Multivariate Data Analysis”, Data-Enabled Discovery and Applications (2017) 1:3. https://doi.org/10.1007/s41688-017-0004-z. [3]. Umesh M. Lanjewar1, J. J. Shah2 , "Air
Pollution Monitoring & Tracking System Using Mobile Sensors and Analysis of Data Using Data Mining”, International Journal of Advanced Computer Research, Vol.2 No.4 Issue-6 Dec.2012.
[4]. Gunita Yadav, Dr. Nitin Mishra, "Air Pollution Trend Analysis Using Sen Estimator Method”, IJARCSSE, Vol. 5, Issue 7, pp.1073-1080, July 2015.
(2009) 2(3):123–131 DOI 10.1007/s11869-009-0039-x
[6]. H.-H. Kim & C.-S. Lee & J.-M. Jeon & S.-D. Yu & C.-W. Lee & J.-H. Park & D.-C. Shin & Y.-W. Lim, "Analysis of the association between air pollution and allergic diseases exposure from nearby sources of ambient air pollution within elementary school zones in four Korean cities”, Environmental Science and Pollution Research, July 2013 vol.20, issue 7, pp 4831–4846 DOI 10.1007/s11356-012-1358-2
[7]. Chao-Hui Leea, Jessie Chia-Yu Chena, Vincent S. Tsenga,b , "A novel data mining mechanism considering bio-signal and environmental data with applications on asthma monitoring”, Computer methods and programs in biomedicine. Jan 2011, 101(1):44-61. doi: 10.1016/ j.cmpb. 2010.04.016.
[8]. Swati Vitkar, "Comparative Analysis of Various Data Mining Prediction Algorithms, Demonstrated using Air Pollution Data of Navi Mumbai”, Research Journal of Chemical and Environmental Sciences, Vol 5 [1], pp. 79-85, February 2017.
[9]. http://www.yourarticlelibrary.com/environment/a ir-pollutants-types-sources-effects-and-control-of-air-pollutants/9964/
[10]. https://www.conserve-energy-future.com.
[11]. Machine learning: the power and promise of computers that learn by example Issued: April 2017 DES 4702 ISBN: 978-1-78252-259-1. [12]. Festim Halili1, Avni Rustemi2, "Predictive
Modelling: Data Mining Regression Technique Applied in a Prototype”, International Journal of Computer Science and Mobile Computing, Vol.5 Issue.8, August- 2016, pg. 207-215.
[13]. Priyanka Gaur, "Neural Networks in Data Mining”, International Journal of Electronics and Computer Science Engineering (IJECSE), Vol.1, No.3, pp. 1449-1453.
[14]. Guang-Bin Huang, Dian Hui Wang, Yuan Lan, "Extreme learning machines: a survey”, International Journal of Machine Learning & Cybernetics, June 2011, vol. 2, issue 2, pp 107– 122.
[15]. Subhash Chandra Pandey, "Data Mining Techniques for Medical Data: A Review”, International conference on Signal Processing, Communication, Power and Embedded System,
2016 IEEE, pp.972-982, DOI: 10.1109/ SCOPES. 2016. 7955586.
[16]. Juliet Rani Rajan1, Chilambu Chelvan A2, "Prognostic system for early diagnosis of paediatric lung disease using artificial intelligence”, Current Pediatric Research 2017 Vol. 21 Issue 1, pp.31-34.
[17]. Shomona Gracia Jacob. R Geetha Ramani, "Data