Proceedings
Genetic association analysis of coronary heart disease by profiling
gene-environment interaction based on latent components in
longitudinal endophenotypes
C Charles Gu*
1,2, Wei (Will) Yang
1, Aldi T Kraja
3, Lisa de las Fuentes
4and Victor G Dávila-Román
4Addresses:1Division of Biostatistics, Washington University School of Medicine, 660 South Euclid Avenue, Box 8067, St. Louis, Missouri 63110, USA,2Department of Genetics, Washington University School of Medicine, 660 South Euclid Avenue, Box 8067, St. Louis, Missouri 63110-1093, USA,3Division of Statistical Genomics, Department of Genetics, 4444 Forest Park Boulevard, Box 8506, St. Louis, MO 63108, USA and4Cardiovascular Imaging and Clinical Research Core Laboratory, Cardiovascular Division, Department of Medicine,
Washington University School of Medicine, 660 South Euclid Avenue, Campus Box 8086, St. Louis, Missouri 63110, USA
E-mail: C Charles Gu* - [email protected]; Wei (Will) Yang - [email protected]; Aldi T Kraja - [email protected]; Lisa de las Fuentes - [email protected]; Victor G Dávila-Román - [email protected]
*Corresponding author
fromGenetic Analysis Workshop 16 St Louis, MO, USA 17-20 September 2009
Published: 15 December 2009
BMC Proceedings2009,3(Suppl 7):S86 doi: 10.1186/1753-6561-3-S7-S86
This article is available from: http://www.biomedcentral.com/1753-6561/3/S7/S86 ©2009 Gu et al; licensee BioMed Central Ltd.
This is an open access article distributed under the terms of the Creative Commons Attribution License (http://creativecommons.org/licenses/by/2.0), which permits unrestricted use, distribution, and reproduction in any medium, provided the original work is properly cited.
Abstract
Studies of complex diseases collect panels of disease-related traits, also known as secondary phenotypes or endophenotypes. They reflect intermediate responses to environment exposures, and as such, are likely to contain hidden information of gene-environment (G × E) interactions. The information can be extracted and used in genetic association studies via latent-components analysis. We present such a method that extracts G × E information in longitudinal data of endophenotypes, and apply the method to repeated measures of multiple phenotypes related to coronary heart disease in Genetic Analysis Workshop 16 Problem 2. The new method identified many genes, including SCNN1B (sodium channel nonvoltage-gated 1 beta) and PKP2 (plakophilin 2), with potential time-dependent G × E interactions; and several others including a novel cardiac-specific kinase gene (TNNI3K), with potential G × E interactions independent of time and marginal effects.
Background
“Endophenotypes” refer to the host of measurements representing physiologic indicators, biochemical assays, and responses to challenges, or the latent components extracted from such data [1]. When derived properly, the latent traits lay more proximal to the causal genotypes
than do clinical phenotypes, and thus, provide poten-tially meaningful but otherwise unobserved context of gene-environment (G × E) interaction. Several recent studies report positive findings with endophenotypes in genetic analysis of complex diseases [2,3]. Our group recently developed a supervised statistical learning
approach for multivariate analysis (SLAM) that uses latent component methods to extract meaningful latent traits for association studies. We have applied this method to the study of hypertension and hypertensive heart disease [4]. The method worked well to identify meaningful latent traits of hypertensive heart disease that led to detection of significant genotype × phenotype associations that were missed by analyses of measured clinical phenotypes.
The repeated measures of multiple coronary heart disease (CHD)-related phenotypes from Genetic Analy-sis Workshop (GAW) 16 Problem 2 are ideal for testing this approach to identify genetic variants that interact with the environment in the development of CHD. For example, systolic and diastolic blood pressure represent continuous and independent risk factors for CHD events [5], and increased blood pressure was associated with pathologic remodeling of the left ventricle [6]. Studies have identified dyslipidemia as a major cause of CHD; therapies that lower serum low-density lipoprotein cholesterol reduce CHD risk [7]. Indeed, metabolic syndrome, which represents a constellation of major risk factors including abdominal obesity, atherogenic dyslipidemia, elevated blood pressure, insulin resistance, and prothrombotic and proinflammatory states, has been shown to increase risk of CHD [8]. Repeated measures on these CHD endophenotypes and their environmental risks (e.g., cigarette smoking) contain valuable information about underlying mechanisms of G × E interactions that is biologically relevant to the development and/or modulation of CHD.
In the present study, we explore such underlying mechanisms using latent components (referred to as
“G × E context”) extracted by an extension of the SLAM approach to analyze the multivariate longitudinal data in GAW 16 Problem 2.
Methods
Data adjustment and quality control
Samples in the“Offspring Cohort” (of the Framingham Heart Study) and data from Visits 1, 3, 5, and 7 were used in this study. The primary phenotype of interest was CHD event, and the data on ten variables including CHD endophenotypes (body mass index, three lipids, blood pressures, and glucose) and environmental covariates (age at visit, cigarette smoking, and alcohol use) were used for latent component analysis. The endopheno-types were checked for normality and outliers, and log-transformed when necessary; this was followed by centering the variables by sex to remove unwanted confounding. The residuals were used as input for all downstream analyses. We used the genome-wide dense
single-nucleotide polymorphisms (SNPs) dataset pro-vided for Problem 2 (~550,000 SNPs typed by Affyme-trix GeneChip® Human Mapping 500 k Array Set). Quality of each SNP array was checked first for low call rate (<95%) and/or abnormal heterozygosity (<0.25 or >0.3); then each SNP on the array was checked for its minor allele frequency (MAF < 0.05), missing rate in the sample (>5%), and deviation from Hardy-Weinberg equilibrium (p < 10-6). Problematic individuals and SNPs were moved from further analysis.
Identifying latent G × E context
Latent component analysis (also known as factor analysis) aims to effectively reduce the number of dimensions (variables) for analysis while minimizing the loss of information. Conventional factor analysis, of which the well known principal-component analysis is a special case, seeks to reduce the dimensionality by expressing the original variables as linear combinations of a smaller number of independent, Gaussian, latent variables (components). However, it tends to neglect meaningful structural information such as clustering in data, which often requires non-Gaussian components and proper treatment of higher order of moments than covariance and correlations. The method of indepen-dent-component analysis (ICA) overcomes this problem by treating observed traits as a mixture of underlying components that are more likely independent, non-Gaussian, and with less complexity than observed ones. It identifies such latent components by maximizing a measure of multivariate non-Gaussianity of linear combinations of original variables [9]. The SLAM approach is built on ICA using supervised validation of extracted components followed by consensus analysis of validated components to identify robust and biologi-cally-meaningful latent traits [4]. For the present study, we extend SLAM by applying multi-level ICA to facilitate analysis of longitudinal multivariate data.
Time-dependent longitudinal G × E context
predictor of CHD, followed by regression of each LLC on genome-wide SNP genotypes to assess its genetic content.
Summary time-independent G × E context
A second-level two-component ICA was then performed on each LLC over the four time points (i.e., visits). For each LLC, we anticipated that one such derived component will capture the main signal of the time-course, while the other absorbs remaining signal and noise. Identification of the signal component was assisted by a clinical expert knowledgeable in the component’s capacity in predicting CHD risks. In the end, this procedure derives time-independent compo-nents (TICs) to capture the time course of G × E interactions in the context defined by each LLC. Note that familial relationship is ignored during ICA extrac-tion and is accounted for in the downstream associaextrac-tion analysis.
Profiling G × E interactions
The identified latent components provide different G × E context useful for teasing out potential G × E interac-tions. The LLCs have repeated measures at each visit, and can be used to facilitate a focused search for SNPs with potential time-dependent G × E interactions. Logistic regression of CHD status was carried out first against SNP genotypes and LLC values, then by an expanded model including the term for SNP × LLC interaction. These analyses were done for each visit, and results were aggregated to spot trends of time-dependent interac-tions. Finally, the TICs represent summary profiling of time-course of G × E interactions for CHD. The detection of SNPs with potential time-independent G × E interac-tions for CHD was then achieved by testing for significant SNP × TIC interactions using logistic regres-sion. In all regression analyses, the generalized estimat-ing equation approach was used to adjust for correlations among family members in the sample.
Results
Samples of 2584 individuals in the “Offspring Cohort” were used in this study. After removing samples missing at least 1 visit (n=403) and those without GWAS data (n=187), we performed genotype quality control and excluded 33 samples due to low call rate (n=22), abnormal heterozygosity (n=5) and population outliers (n=6). A total of 1961 individuals were used in the analyses reported below. To achieve normality, log-transformations were applied to triglyceride, blood glucose, cigarettes smoked per day, and alcohol use per week.
Time-dependent G × E interactions
Repeated measures from Visits 1, 3, 5, and 7 were used to extract time-dependent G × E context, the LLCs for CHD. The extended SLAM procedure was used to extract four LLCs as described previously.
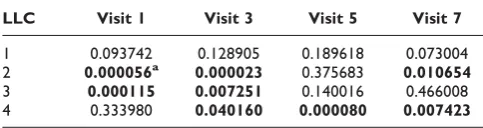
We first tested each LLC as a predictor of CHD. Table 1 shows the results by logistic regression of CHD on LLC at each visit. With the exception of LLC1, the derived components LLC2-LLC4 were all significant predictors of CHD. Both LLC2 and LLC3 are highly significant predictors of CHD at the early two visits, while LLC2 was also fairly significant at Visit 7. LLC4 seemed to have captured a complementary axis that became significant predictor of CHD at later visits when the average age of the Offspring Cohort reaches 53 to 60 years old. Note that LLC1 absorbs remaining variation in the data, and may still contain some G × E information (as confirmed below). We then examined genetic association of SNPs with each LLC by longitudinal regression. There were a number of SNPs with p ≤ 0.05, but few achieved high significance. Most notable ones were all associated with LLC3 (21 SNPs in 9 genes with p ≤1 × 10⁻⁴, data not shown). These results supported the idea that the LLCs may be used as a derived “environment” variable for teasing out potential G × E interactions.
We then tested for SNP × LLC interactions in an expanded model including the interaction terms (CHD~age+LLC+SNP+SNP*LLC). A total of 76 SNPs in 59 genes were found having 96 significant interactions with various LLCs at different time points, at a significance level of a = 1 × 10⁻⁶. A majority of these SNP × LLC interactions (63/96≈66%) were detected in the middle two visits, and close to half were interacting with LLC1. Many of the genes detected are relevant to CHD. In Table 2, we displayed some representatives in details. Some of them, includingSCNN1BandPKP2, are well known candidate genes of CHD.
Time-independent G × E Interactions
As described previously, we then performed second-level ICA on each LLC to extract the component that captures main signal of the time-course underlying the LLC. These components are denoted TIC1 to TIC4. Note that we
Table 1: Logistic regression of CHD on LLCs
LLC Visit 1 Visit 3 Visit 5 Visit 7
1 0.093742 0.128905 0.189618 0.073004
2 0.000056a 0.000023 0.375683 0.010654
3 0.000115 0.007251 0.140016 0.466008
4 0.333980 0.040160 0.000080 0.007423
a
include LLC1 in the second-level ICA analysis, assuming that there may still be G × E information hidden in this
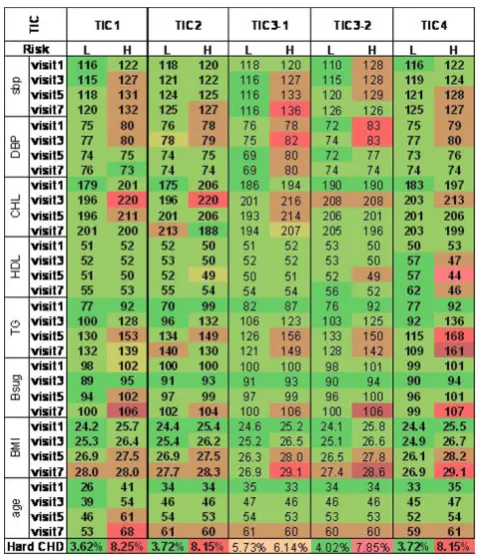
“noise”component. Results of validation analyses of the derived TICs are shown in Figure 1, where their capacity in predicting CHD risks are evident in eight clinical indicators of CHD including blood pressures, lipids, blood sugar, body mass index, and age. It is interesting to note that both of the two components (denoted as TIC3-1 and TIC3-2 in Figure 1) derived from LLC3 may qualify as a “signal” component, although TIC3-2 did better in predicting CHD events.
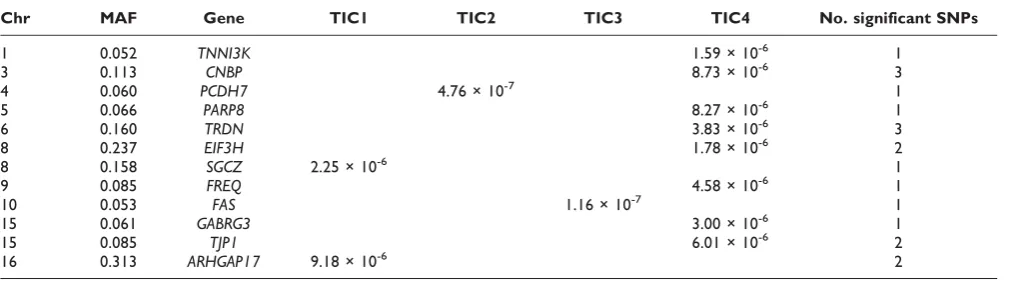
To study effects of potential interactions between SNPs and so-derived TICs, we carried out logistic regression of CHD status on SNP genotypes and an interaction term for SNP × TIC, using two types of models: ones that include main effect of TICs and ones without. We hypothesized that SNPs for which the two models produced similar significance levels imply possibility of“pure”SNP × TIC effects. At a significance level ofa= 10-5, we displayed in Table 3 genes containing such SNPs, for which the inclusion of main effects of TICs did not substantially change the significance level of detected interactions between the SNPs and the time-independent latent components. The maximum of the p-values of the two models were shown for the most significant SNPs in each gene. Among these, the cardiac-specific kinase TNNI3K
interacts specifically with cardiac troponin I and has been found to protect the myocardium from ischemic injury [10].
Discussion
In this study, we showed that the SLAM approach can be extended by including a novel method of two-level latent component analysis to address the challenge of analyzing multivariate longitudinal data of the
correlated phenotypes, endophenotypes, covariates, and environmental factors typically found in genome-wide association studies of complex diseases such as CHD. Repeated measures from Visits 1, 3, 5, and 7 from GAW16 Problem 2 were used to extract LLCs (long-itudinal latent components) that represents differential age- (visit-) dependent risks. The second-level analysis of LLCs extracted time-independent components (TICs) and captured variants with “pure” SNP × TIC interac-tions. The method seemed to have worked well in teasing out variants with promising G × E interactions in CHD, by analyses in derived context that potentially homogenize samples according underlying G × E mechanisms. Note that medication uses were not directly modeled because their effects should be reflected in the measured endophenotypes. The derivation of the longitudinal latent components (LLC) may benefit from Figure 1
Validation of selected TICs. Displayed are mean values of eight clinical indicators of CHD and prevalence of hard CHD in“high-risk”(H) and“low-risk”(L) groups as defined by the TIC in question. sbp, systolic blood pressure; DBP, diastolic blood pressure; CHL, cholesterol; HDL, high-density lipoprotein; TG, triglyceride; Bsug, blood sugar; BMI, body mass index. The component that distinguishes the two groups well are selected as the“signal”component that captures the time-course of LLC relevant to CHD. Bright red colors indicate higher risk for CHD and darker green colors indicate lower risk.
Table 2: Representative candidate genes and SNPs that were detected with significant SNP × LLC interactions (p≤10-6)
Visit
SNP ID Chr MAF Gene 1 3 5 7
SNP_A-4199078 2 0.07 IL1RN LLC1
SNP_A-1788738 4 0.06 KLF3 LLC4 SNP_A-1978322 4 0.06 TACR3 LLC3
SNP_A-2260338 5 0.06 FTMT LLC2 SNP_A-2031704 5 0.15 NSD1 LLC4 SNP_A-1987480 6 0.15 TRDN LLC4 SNP_A-2090526 6 0.06 CITED2 LLC2 SNP_A-4217972 10 0.07 KCNMA1 LLC2
more rigorous mathematical treatment, e.g., survival analysis of time to events of CHD. Finally, further characterization of G × E mechanisms will require identifying the right environment variables after the extended SLAM analysis, followed by explicit modeling of G × E interactions, and will be the topic of our future studies.
List of abbreviations used
CHD: Coronary heart disease; G × E: Gene-environment interaction; GAW: Genetic Analysis Workshop; IC: Independent components; LLCs: Longitudinal latent components; MAF: Minor allele frequency; SLAM: Supervised statistical learning approach for multivariate analysis; SNP: Single-nucleotide polymorphism; TIC: Time-independent component.
Competing interests
The authors declare that they have no competing interests.
Authors
’
contributions
CCG developed the concept and method, participated in analysis, drafted and revised the manuscript, and gave final approval for publication; WY performed analysis and help drafted the manuscript; ATK participated in analysis and manuscript development; LdlF participated in analysis and manuscript development; VGD-R and LdlF revised the manuscript critically.
Acknowledgements
This research is supported in part by NIH grants HL091028, HL071782, and an AHA grant 0855626G. The Genetic Analysis Workshops are supported by NIH grant R01 GM031575.
This article has been published as part of BMC Proceedings Volume 3 Supplement 7, 2009: Genetic Analysis Workshop 16. The full contents of the supplement are available online at http://www.biomedcentral.com/ 1753-6561/3?issue=S7.
References
1. Gottesman II and Gould TD:The endophenotype concept in psychiatry: etymology and strategic intentions. Am J Psych 2003,160:636–645.
2. Almasy L and Blangero J:Endophenotypes as quantitative risk factors for psychiatric disease: rationale and study design. Am J Med Genet2001,105:42–44.
3. Pan WH, Lynn KS, Chen CH, Wu YL, Lin CY and Chang HY:Using endophenotypes for pathway clusters to map complex disease genes.Genet Epidemiol2006,30:143–154.
4. Gu CC, Flores HR, de Las Fuentes L and Davila-Roman VG: Enhanced detection of genetic association of hypertensive heart disease by analysis of latent phenotypes.Genet Epidemiol 2008,32:528–538.
5. Lewington S, Clarke R, Qizilbash N, Peto R and Collins R: Age-specific relevance of usual blood pressure to vascular mortality: a meta-analysis of individual data for one million adults in 61 prospective studies.Lancet2002,360:1903–1913. 6. Huang P, Kraja AT, Tang W, Hunt SC, North KE, Lewis CE,
Devereux RB, de Simone G, Arnett DK, Rice T and Rao DC:Factor relationships of metabolic syndrome and echocardiographic phenotypes in the HyperGEN study. J Hypertens 2008, 26:1360–1366.
7. Expert Panel on Detection, Evaluation, and Treatment of High Blood Cholesterol in Adults: Executive Summary of The Third Report of The National Cholesterol Education Program (NCEP) Expert Panel on Detection, Evaluation, And Treat-ment of High Blood Cholesterol In Adults (Adult TreatTreat-ment Panel III).JAMA2001,285:2486–2497.
8. Gami AS, Witt BJ, Howard DE, Erwin PJ, Gami LA, Somers VK and Montori VM: Metabolic syndrome and risk of incident cardiovascular events and death: a systematic review and meta-analysis of longitudinal studies. J Am Coll Cardiol 2007, 49:403–414.
9. Hyvärinen A and Oja E: Independent component analysis: algorithms and applications.Neural Netw2000,13:411–430. 10. Lai ZF, Chen YZ, Feng LP, Meng XM, Ding JF, Wang LY, Ye J, Li P,
Cheng XS, Kitamoto Y, Monzen K, Komuro I, Sakaguchi N and Kim-Mitsuyama S: Overexpression of TNNI3K, a cardiac-specific MAP kinase, promotes P19CL6-derived cardiac myogenesis and prevents myocardial infarction-induced injury. Am J Physiol Heart Circ Physiol2008,295:H708–H716.
Table 3: Genes containing≥1 SNPs with“pure”SNP × TIC interactions for CHD (a= 10-5), andp-values for most significant SNPs and their MAFs
Chr MAF Gene TIC1 TIC2 TIC3 TIC4 No. significant SNPs
1 0.052 TNNI3K 1.59 × 10⁻⁶ 1
3 0.113 CNBP 8.73 × 10⁻⁶ 3
4 0.060 PCDH7 4.76 × 10⁻⁷ 1
5 0.066 PARP8 8.27 × 10⁻⁶ 1
6 0.160 TRDN 3.83 × 10⁻⁶ 3
8 0.237 EIF3H 1.78 × 10⁻⁶ 2
8 0.158 SGCZ 2.25 × 10⁻⁶ 1
9 0.085 FREQ 4.58 × 10⁻⁶ 1
10 0.053 FAS 1.16 × 10⁻⁷ 1
15 0.061 GABRG3 3.00 × 10⁻⁶ 1
15 0.085 TJP1 6.01 × 10⁻⁶ 2