2018 International Conference on Modeling, Simulation and Analysis (ICMSA 2018) ISBN: 978-1-60595-544-5
The Evolution Analysis of the Hot Spots
and Trends of Visualization Research
Yong-yue CHEN
*, Lei-lei BU and Xue-yang LI
Department of Management of Wuhan Textile University
*Corresponding author
Keywords: Visualization, Hot spot and trend analysis, Mapping knowledge domain.
Abstract. With the continuous development of large data and cloud computing, the analysis of mass data, the methods and tools of information visualization analysis have become a new trend and hot spot. Based on the background of visualization, from the two dimensions of space and time, through the analysis of a large number of literature data, this paper combs the current research topics of researchers, and provides a reference for comprehensive and effective analysis and tracking of hot topics and trends in thematic areas research.
Introduction
With the development of information technology and the relevant industries such as big data and cloud computing, the field of scientific research is continuously expanding and mining. The data in different disciplines also show an explosive growth. Massive data analysis, as well as a more intuitive and comprehensive presentation of massive data and information has become an urgent reality, the visual analysis methods and tools in the big data environment has become the current hot spots and trends [1, 2, 3]. Among them, the use of visual methods to track the front hot spots, predict the development trend is an important research method which current researchers pay attention to [4].
The essence is that researchers use visual tools and methods to analyze and process a large amount of relevant literature data to form visual diagrams and tables of information of concern to researchers and rely on the related tools of computers to draw the relevant image. It can discover the research hot spots and development trends, find out the topics of their research, search for the literature of interest, and effectively help the researchers to better understand the hidden information behind the knowledge. Based on this point, this paper analyzes and analyzes the visualization method of hot spots and trend analysis based on keywords.
Visualization Tool Selection and Analysis Method Introduced
Visualization Tools to Choose
Analysis Methods Introduced
Research Hot Spot Analysis
The word frequency analysis method can identify the research hotspot and development trend of the subject field through the statistical analysis of the key words of the core content of the document and the occurrence frequency of the keyword in the literature of a certain scientific research field. Generally we think that the keyword article is the core content of refining and essence of the article [5, 6, 7, 10]
. Therefore, when some keywords appear constantly in the literature of this field, we think that it represents the research hotspot in this field. Also formally based on this idea, Citespace II to statistical and analysis of the frequency of co-occurrence between different keywords, and use the visual method to display the frequency and size of the keywords in the form of a graph in front of the readers, so as to provide a basis for the research workers to analyze a certain area.
Research Frontier Analysis
Tracking the hot front of the discipline is conducive to scientific researchers to better grasp the scientific trends and trends. The frontiers of the subject are determined according to the mutational terms extracted from the literature titles, abstracts and the high frequency words of the article [8, 9]. The mutation algorithm is better for us to detect the occurrence of mutation words, so as to better apply the time series analysis and discover the frontier of the subject. In this paper, we mainly extract the terminology of catastrophe from the key words of the literature, and use the "time zone" of Citespace II to analyze the frontier of research in the field.
Sources and Processing of Data
Sources of Data
The relevant data used in this article are from CNKI. Using "visual analysis" as the key word, the journal database of CNKI was retrieved. The selected time period is all the journals in the 15 years from "2002 to 2016", which include SCI source journals, EI source journals, core journals and CSSCI data, which retrieved a total of 2710 articles, and use these basic data to build the original data required for this study.
Data Processing
According to the requirements of Citespace II software, the experimental data are required to be stored in the same file in the form of text files. During the process of analysis, when creating a project, the folder path of the previously saved data can be directly selected according to the needs of scientific researchers, which will be more conducive to the development of research workers related work. At the same time, the data were standardized, such as: data de-duplication, the author of the same name, similar keywords so as to ensure the objectivity and accuracy of the analysis in the experimental process.
Thematic Research Hot Spots and Trend Analysis
Research Hot Spot Analysis
Table 1. High-frequency keywords in the network and high center keyword rankings.
ranking High-frequency keywords High central keywords
Keyword name Frequency Keyword name Centrality
1 Visualization 400 Visual Analysis 0.71
2 Visual Analysis 328 Information System 0.48
3 Knowledge map 237 Three-dimensional model 0.45
4 Research Hotspot 102 Collnet 0.45
5 Citespace 88 Citation Analysis 0.44
6 Information Visualization 81 3D Visualization 0.41
7 Bibliometric 77 Data Mining 0.25
8 Social Network Analysis 68 Opengl 0.25
9 GIS 67 Cssci 0.24
10 Co-word analysis 60 Content Analysis 0.24
11 Geographic Information System 51 Geographic Information System 0.23
12 3D Visualization 41 Data warehouse 0.23
13 Big Data 39 Co-citation analysis 0.22
14 Data Mining 38 Visualization 0.18
15 Data Visualization 38 Clustering Analysis 0.15
16 Clustering Analysis 37 GIS 0.14
17 Research Frontier 35 Information Visualization 0.13
18 Scientific knowledge map 33 Co-word analysis 0.1
19 Cssci 29 Idl 0.1
20 Bibliometrics 28 Algorithm 0.09
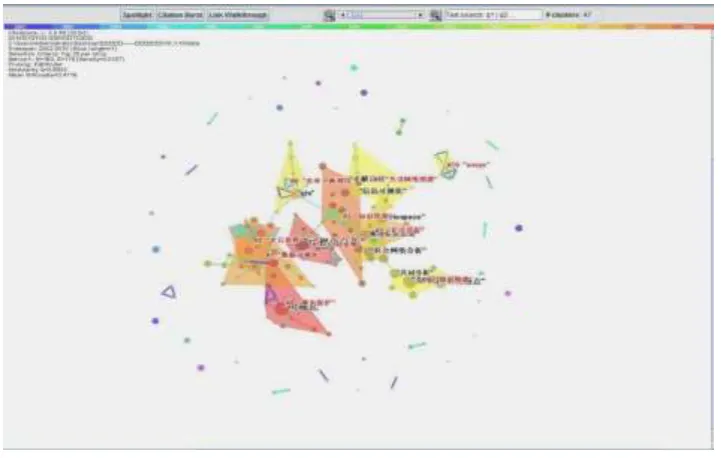
In the visualization network, Citespace II can generate the keyword co-occurrence network, calculate the centrality of each keyword, and cluster some high-frequency keywords. High-center keywords are the key hot spots in this research field [11, 12].
Figure 1. Key words co-occurrence network.
[image:3.595.118.479.443.672.2]view of the effect allows us to quickly identify a few key points with a strong sense of interpretation. Through the analysis of key points, we can not only find out the research hotspots, but also find some new phenomena and rules which are not reflected in traditional word frequency analysis.
From Figure 1 we can see that the entire view is mainly divided into two larger clusters, the lower left corner of the main visualization as the center, including: data visualization, visual analysis, etc., the upper right corner mostly relates to knowledge management, including: knowledge management, bibliometrics, citation analysis, co-word analysis, knowledge map and so on.
Research Frontier Analysis
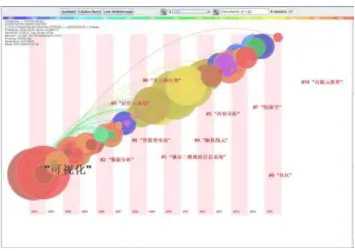
[image:4.595.98.499.338.482.2]Tracking the hot front of the discipline is conducive to researchers to better grasp the scientific trends and trends, mutation algorithm can be used to detect the emergence of mutant words, In order to make better use of time series related literature analysis and retrieval [8, 9], In Citespace II, research frontiers are based on abrupt terminology extracted from identifiers of titles, abstracts, keywords, and documentation. In this study, we selected the node type as the key word, detected a total of 2171 abrupt terminology, and select the display type as "time zone" to generate a research frontier glossaries and frontier view of the 15 years of visual analytics.
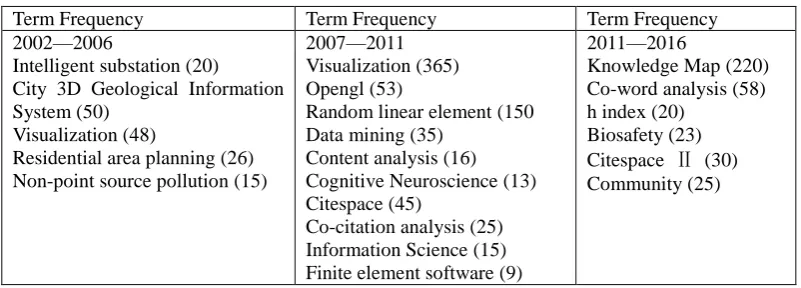
Table 2. Emerging research frontiers in the last fifteen years of visualization networks.
Term Frequency Term Frequency Term Frequency
2002—2006
Intelligent substation (20) City 3D Geological Information System (50)
Visualization (48)
Residential area planning (26) Non-point source pollution (15)
2007—2011 Visualization (365) Opengl (53)
Random linear element (150 Data mining (35)
Content analysis (16) Cognitive Neuroscience (13) Citespace (45)
Co-citation analysis (25) Information Science (15) Finite element software (9)
2011—2016
Knowledge Map (220) Co-word analysis (58) h index (20)
Biosafety (23)
Citespace Ⅱ (30)
Community (25)
Figure 2. Research frontier glossaries and frontier views in the field of visual analytics for 15 years.
Moreover, the qualitative research rate gradually decreased from 2011 to 2016, and the quantitative analysis increased rapidly.
Conclusion
To track the hot spot of academic frontier and predict the trend of its development has always been an important part of the attention of the researchers. In this paper, the key words of the subject area of "Visual Analysis" are selected, and the key words are analyzed. Visual method is applied to grasp the hot topics and trends of academic frontiers.
Through the cluster analysis of high-frequency keywords, we find that the visual analysis from 2002 to 2015 has expanded from the simple data and content analysis to a wider area of social sciences and industries. In recent years, research on bibliometrics, co-citation analysis and knowledge map has become a major hotspot. At the same time, the trend of visual analysis combined with new fields such as big data and cloud computing is getting closer and closer. Moreover, the visual analysis in the past fifteen years shows a shift from qualitative analysis to quantitative analysis, and with the updating and strengthening of technologies such as big data, the research on visualization has gradually become a hot spot and trend.
Acknowledgement
This research is supported by National Social Science Foundation of China under Grant 14BTQ057. It is also supported by the Humanities and Social Science General Project of Hubei Province Department of Education under Grant 14Y023.
References
[1] Huo Liang, Zhao Lemen. Visualization and Its Application in Information Analysis [J]. Information studies: Theory and Practice & Application, 2017, 40(4): 111-116.
[4] Chen Yongyue, Tian Wenfang. Visual Analysis Method Research on Hotspot Track and Trend Prediction in Subject Area [J]. Information studies: Theory and Practice & Application, 2017, 40(6):117-121.
[5] Su Nan. Visualization Analysis of Big Data in China based on CSSCI [J]. Information Science, 2016, V36 (3):112-116.
[6] Zhao Bin, Dong Ying, Yang Xiao-jie. Knowledge Mapping and Hot Topics in the Study of Information Ecology in China—Based on the Perspective of Bibliometric Analysis [J]. Information Science, 2017(9):61-66.
[7] Sun Z, Soochow University Library. Distribution and Frontier Evolution of University Library Service in Recent Decade: Based on Bibliometric CNKI Core Journals and Visual Analysis [J]. Library Journal, 2017.
[8] Bernard J, Daberkow D, Fellner D, et al. VisInfo: a digital library system for time series research data based on exploratory search—a user-centered design approach [J]. International Journal on Digital Libraries, 2015, 16(1):37-59.
[9] Nazemi K, Retz R, Burkhardt D, et al. Visual trend analysis with digital libraries[J]. 2015:1-8.
[10] Tang J, Hechi University Library. Multidimensional Visual Analysis of Studies on Library's Subject Service in China [J]. Information Research, 2014.
[11] Zhang J S, Humanities F O, University D. Visual Analysis of Domestic Self-confidence Document Information [J]. Journal of Dalian University, 2016.