ABSTRACT
CHATTERJEE, PAYEL. Development of a Risk Consistent Framework for Seismic Qualification of Equipment. (Under the direction of Dr. Abhinav Gupta).
IEEE 693 (2005) and IEEE 344 (2004) recommend qualification of equipment either by testing or by analysis depending on the voltage classification in order to ensure a safe shut down of power plants during or after an earthquake. The in-situ conditions at the time of installation such as structural properties and boundary conditions of the mounting arrangements can have a significant effect on the behavior and performance of such equipment. In majority of cases when heavy equipment is mounted on support structures, amplification can be either much less or much high than the recommended value of 2.5, depending on the rigidity of the support structures. The current practice for estimation of In-Structure Response Spectrum (ISRS) uses a decoupled analysis. Such an analysis neglects the effect of dynamic interaction between the equipment and the structure that can lead to significant reduction in the equipment response. For sensitive equipment such as relays and switches, the required response spectra (RRS) are often narrow banded due to filtering of ground motion through the structures on which the equipment may be mounted.
these formulations depending on the combinations of mass and frequency ratios. The reduction in the equipment response due to interaction with the supporting structure is also studied for many different multi degree of freedom systems and the uncertainties in the reduction factor are investigated for a suite of mass ratios and damping ratios of the equipment. An attempt is made to estimate statistical bounds for the reduction factor. The effect of non-classical damping is also investigated. In case of equipment qualification based on equivalent broadband spectra, this study attempts to calculate the clipping factors for real earthquakes that are consistent with the site specific Probabilistic Seismic Hazard Analysis (PSHA) requirements. The purpose is to recommend a framework for seismic qualification of equipment that is consistent with Seismic Probabilistic Risk Assessment (SPRA)
Development of a Risk Consistent Framework for Seismic Qualification of Equipment
by Payel Chatterjee
A thesis submitted to the Graduate Faculty of North Carolina State University
in partial fulfillment of the requirements for the degree of
Doctor of Philosophy
Civil Engineering
Raleigh, North Carolina 2017
APPROVED BY:
_______________________________ ______________________________ Dr. Abhinav Gupta Dr. Murthy Guddati
Chair of Advisory Committee
BIOGRAPHY
Payel Chatterjee was born and brought up in the city of Kolkata in India. She joined the undergraduate program in Civil Engineering at Bengal Engineering and Science
University, Shibpur, West Bengal, India in 2005 and received the Bachelors of Engineering (with honors) degree in February 2010. She has been awarded the merit scholarship twice during her undergraduate studies. Upon completion of her undergraduate studies, she joined Indian Oil Corporation Limited, a public sector unit in India, as an Engineering Officer. She worked there till June 2011 and joined North Carolina State University in August 2011 to pursue her Master of Science in Civil Engineering. She completed her M.S. in December 2013 and continued to pursue her doctoral degree in Structural Engineering and Mechanics in the CCEE department at North Carolina State University from January 2014.
Payel is a member of two honor societies, Phi Kappa Phi and Tau Beta Pi at NC State University. She has received the Zia graduate fellowship award for Structural Engineering from the department of CCEE at NC State University in 2016. She also got an internship opportunity at Idaho National Laboratory in Spring 2016.
ACKNOWLEDGMENTS
A lot of people were instrumental in the completion of my research work. The first person to whom I would like to extend my sincere gratitude would be my advisor, Dr.
Abhinav Gupta. His constant guidance and help both during my research work and also at the time of compiling this manuscript cannot be merely acknowledged in a few words. I would also like to thank Dr. Murthy Guddati, Dr. John Baugh and Dr. Justin Post for agreeing to be a part of my advisory committee and having faith in my research work.
My sincerest gratitude to my colleagues and friends Abhilash, Ankit, Saran,
Sugandha and Shinyoung. A very special mention to Dr. Vivek Agarwal, my mentor at Idaho National Laboratory where I got the opportunity to intern.
Some of the people that helped me by their presence and influence in my life would be my parents and my brother who constantly motivated me not just verbally but also by placing their confidence in my ability and letting me pursue my dreams. I am also deeply grateful to Ayan who has been a rock throughout and supported me through thick and thin. There are definitely so many more people I would like to acknowledge, friends I have left behind and friends I have made here, without whom I would not have been able to make it so far.
TABLE OF CONTENTS
LIST OF TABLES………... viii
LIST OF FIGURES..………... xi
PART I: INTRODUCTION.……….. 1
1. General...……….. 2
2. Background..….……….…. 4
3. Objective...………..……... 10
4. Organization..……… 13
REFERENCES...………... 15
PART II: CLOSED FORM SOLUTION FOR SEISMIC AMPLIFICATIONS IN ELECTRICAL EQUIPMENT……...………...……….. 20
1. Introduction..………... 21
2. Requirements of IEEE-693 and IEEE-344 for equipment mounted on supports……….. 23
3. Existing study on amplification factor for equipment mounted on supports .25 4. Development of closed-form formulation.………...………... 27
4.1 Effect of mass ratio on the response spectrum analysis……….... 27
4.2 Amplification ratio for multi degree of freedom system………...…28
5. Validation of closed form equation for amplification of equipment..……….. 30
6. Simplified analytical models for different system configurations…...……... 31
7. Discussion of results……….. 38
REFERENCES………...………... 42
PART III: A PROBABILISTIC STUDY OF REDUCTION IN SEISMIC RESPONSE OF EQUIPMENT DUE TO COUPLED ANALYSIS……….……….. 61
1. Introduction…..………. 62
2. Non-classically damped systems……..……… 65
2.1 Mode superposition based time history analysis...…...……… 65
2.2 Mode superposition based time history analysis from closed form solutions……….. 68
2.3 Transformed modal solution: Coupled equipment response from uncoupled modal properties………..….. 73
3. Simplified transformed modal solution: Two-mode approximation…..…... 76
4. Example case studies and results……… 79
5. Probabilistic distributions for reduction due to coupling ……..……….. 80
5.1 Effect of uncertainty in system properties.………... 81
5.2 Variation of reduction factor with mass ratio and damping ratio………. 83
6. Discussion of results………...………... 83
7. Summary and conclusions………..………..… 87
REFERENCES…...………... 89
PART IV: A PRA-CONSISTENT FRAMEWORK FOR SEISMIC QUALIFICATION OF EQUIPMENT…….………..……….... 135
1. Introduction…………..………... 136
3. Development of broadband correction factor, CB, for equipment...….…... 139
3.1 Maximum response factor for harmonic ground excitation……… 140
3.2 Maximum response factor for sine beat type excitation…...………….. 140
3.3 Severity ratios for different ground motions……...……… 142
3.4 Broadband correction for real earthquakes………. 143
4. Development of modal interaction correction factor, CMI, for equipment… 145 4.1 Effect of modal interaction for narrowband harmonic excitation…...… 145
4.2 Effect of modal interaction for real earthquakes………. 147
5. Clipping factor for narrowband response spectra……….…….. 148
6. Comparative Study of the Combined Clipping Factor for Structures Subjected to Real Earthquakes...……….. 150
7. Discussion of results……...………. 152
8. Summary and conclusions………..……… 154
REFERENCES……...………..………... 157
PART V: SUMMARY AND CONCLUSIONS.……….………....….. 180
1. General…...………...…..………..………... 181
2. Development of a closed form solution for amplification of equipment response………...………... 182
3. Reduction in equipment response due to coupled analysis…………..…….. 184
4. Risk consistent clipping of narrowband equipment response spectra.….... 185
LIST OF TABLES
PART II: CLOSED FORM SOLUTION FOR SEISMIC AMPLIFICATIONS IN ELECTRICAL EQUIPMENT
Table 1: Validation of closed form equation with time history analysis results for case 1………... 44 Table 2: Validation of closed form equation with time history analysis results for case 2………... 44 Table 3: Validation of closed form equation with time history analysis results for case 3………... 45 Table 4: Validation of closed form equation with time history analysis results for case 4………... 45 Table 5: Validation of closed form equation with time history analysis results for case 5………... 46 Table 6: Comparison of amplification ratio between time history analyses and closed form equation……….. 47 Table 7: Comparison of amplification ratio from simplified formulation with the complete analytical formulation for r>1, f>1……….… 48
PART III: A PROBABILISTIC STUDY OF REDUCTION IN SEISMIC RESPONSE OF EQUIPMENT DUE TO COUPLED ANALYSIS
Table 1: Selection of systems based on peak frequencies of ground spectra for
Table 2: Two degree of freedom primary system with oscillator connected at dof 1:
𝜉𝑠 = 5%... 94
Table 3: Two degree of freedom primary system with oscillator connected at dof 1:
𝜉𝑠 = 2%... 95
Table 4: Two degree of freedom primary system with oscillator connected at dof 2:
𝜉𝑠 = 5%... 96
Table 5: Two degree of freedom primary system with oscillator connected at dof 2:
𝜉𝑠 = 2%... 97
Table 6: Five degree of freedom primary system with oscillator connected at dof 1:
𝜉𝑠 = 5%... 98
Table 7: Five degree of freedom primary system with oscillator connected at dof 1:
𝜉𝑠 = 2%... 99
Table 8: Five degree of freedom primary system with oscillator connected at dof 2:
𝜉𝑠 = 5%... 100
Table 9: Five degree of freedom primary system with oscillator connected at dof 2:
𝜉𝑠 = 2%... 101
Table 10: Five degree of freedom primary system with oscillator connected at dof 5:
𝜉𝑠 = 5%... 103
Table 11: Five degree of freedom primary system with oscillator connected at dof 5:
PART IV: A PRA-CONSISTENT FRAMEWORK FOR SEISMIC QUALIFICATION OF EQUIPMENT
Table 1: Comparison of correction factors for 2 dof system subjected to real
earthquakes and EPRI [3] recommended values for mass 1, primary system frequency = 10Hz ………...…….……….………. 159 Table 2: Comparison of correction factors for 2 dof system subjected to real
earthquakes and EPRI [3] recommended values for mass 2, primary system frequency = 10Hz ………...…….……….………. 160 Table 3: Comparison of correction factors for 2 dof system subjected to real
earthquakes and EPRI [3] recommended values for mass 1, primary system frequency = 5Hz ………...…….……….………... 161 Table 4: Comparison of correction factors for 2 dof system subjected to real
earthquakes and EPRI [3] recommended values for mass 2, primary system frequency = 5Hz ………...…….……….………... 162 Table 5: Comparison of correction factors for 2 dof system subjected to real
earthquakes and EPRI [3] recommended values for mass 1, primary system frequency = 2Hz ………...…….………..….………. 163 Table 6: Comparison of correction factors for 2 dof system subjected to real
LIST OF FIGURES
PART II: CLOSED FORM SOLUTION FOR SEISMIC AMPLIFICATIONS IN ELECTRICAL EQUIPMENT
Figure 1: 242 kV Dead Tank Breaker ………...……….……….…... 49
Figure 2: Lumped stiffness-mass model for equipment-support system …………... 49
Figure 3: IEEE-693 (2005) recommended RRS for high performance qualification, anchored to 1.0g……….. 50
Figure 4: Normalized amplification ratio vs. frequency ratio for support frequency = 5Hz……….. 50
Figure 5: Normalized amplification ratio vs. mass ratio for support frequency = 5Hz……….. 51
Figure 6: Amplification ratio for a support frequency = 10 Hz, mass ratio = 2 and frequency Ratio = 0.5……….. 52
Figure 7: Response spectra for mass ratio = 0.01………... 53
Figure 8: Response spectra for mass ratio = 0.1………. 53
Figure 9: Response spectra for mass ratio = 0.5………...……….. 54
Figure 10: Response spectra for mass ratio = 1………...………... 54
Figure 11: Response spectra for mass ratio = 2.………...……….. 55
Figure 12: Response spectra for mass ratio = 4.………...……….. 55
Figure 13: Amplification ratio for mass ratio>1, frequency ratio>1……..………… 56
Figure 14: Convergence Study for denominator for Case 2………... 57
Figure 16: Amplification ratio for mass ratio<1, frequency ratio<1……….. 59 Figure 17: Amplification ratio for mass ratio<1, frequency ratio>1………..… 60 PART III: A PROBABILISTIC STUDY OF REDUCTION IN SEISMIC RESPONSE OF EQUIPMENT DUE TO COUPLED ANALYSIS
Figure 1: Ground spectrum for high frequency earthquake 1 (HFEQ1)…….……. 107 Figure 2: Ground spectrum for high frequency earthquake 2 (HFEQ2)…..……... 107 Figure 3: Representative ten degree of freedom primary system with oscillator
connected to top: System 1 (HFEQ1) & System II (HFEQ2).………. 108 Figure 4: ISRS for equipment mounted on 10th floor, System I, Mass ratio: 0.05... 109 Figure 5: ISRS for equipment mounted on 10th floor, System I, Mass ratio: 0.1…. 109 Figure 6: ISRS for equipment mounted on 10th floor, System I, Mass ratio: 0.15... 110 Figure 7: ISRS for equipment mounted on 10th floor, System I, Mass ratio: 0.2…. 110
Figure 8: ISRS for equipment mounted on 10th floor, System I, Mass ratio: 0.2…. 111 Figure 9: ISRS for equipment mounted on 5th floor, System I, Mass ratio: 0.05…. 111 Figure 10: ISRS for equipment mounted on 5th floor, System I, Mass ratio: 0.1…. 112 Figure 11: ISRS for equipment mounted on 5th floor, System I, Mass ratio: 0.15... 112 Figure 12: ISRS for equipment mounted on 5th floor, System I, Mass ratio: 0.2…. 113
Figure 13: ISRS for equipment mounted on 5th floor, System I, Mass ratio: 0.25... 113 Figure 14: ISRS for equipment mounted on 10th floor, System II, Mass ratio:
0.05……… 114
Figure 15: ISRS for equipment mounted on 10th floor, System II, Mass ratio:
Figure 16: ISRS for equipment mounted on 10th floor, System II, Mass ratio:
0.15……….... 115
Figure 17: ISRS for equipment mounted on 10th floor, System II, Mass ratio:
0.2……….. 115 Figure 18: ISRS for equipment mounted on 10th floor, System II, Mass ratio:
0.2……….. 116 Figure 19: ISRS for equipment mounted on 5th floor, System II, Mass ratio:
0.05………...…. 116
Figure 20: ISRS for equipment mounted on 5th floor, System II, Mass ratio:
0.1……….…. 117 Figure 21: ISRS for equipment mounted on 5th floor, System II, Mass ratio:
0.15……….... 117
Figure 22: ISRS for equipment mounted on 5th floor, System II, Mass ratio:
0.2……….. 118 Figure 23: ISRS for equipment mounted on 5th floor, System II, Mass ratio:
0.25……….... 118 Figure 24: Schematic representation of a single degree of freedom equipment
Figure 29: Uncoupled response spectrum for equipment: HFEQ1..………... 121 Figure 30: Plots of cumulative distribution functions for reduction factor:
HFEQ1………...………... 122 Figure 31: Uncoupled response spectrum for equipment: HFEQ2……….….. 123 Figure 32: Plots of cumulative distribution functions for reduction factor:
HFEQ2………...………... 124
Figure 33: Uncoupled response spectrum for equipment: HFEQ3……….….. 124 Figure 34: Plots of cumulative distribution functions for reduction factor:
HFEQ3………...………... 125
Figure 35: Uncoupled response spectrum for equipment: HFEQ4……….….. 126 Figure 36: Plots of cumulative distribution functions for reduction factor:
HFEQ4………...………... 127
Figure 37: Uncoupled response spectrum for equipment: HFEQ5……….….. 127 Figure 38: Plots of cumulative distribution functions for reduction factor:
HFEQ5………...………... 128
Figure 39: Uncoupled response spectrum for equipment: LFEQ……….….... 129 Figure 40: Plots of cumulative distribution functions for reduction factor:
LFEQ………...………... 130
Figure 43: Variation of Median + 1β reduction factor with mass ratio and damping ratio for a five degree of freedom primary system, oscillator connected at top .…. 133 Figure 43: Variation of Median + 2β reduction factor with mass ratio and damping
ratio for a five degree of freedom primary system, oscillator connected at top.….. 134
PART IV: A PRA-CONSISTENT FRAMEWORK FOR SEISMIC QUALIFICATION OF EQUIPMENT Figure 1: Filtering of ground motion through structures……….. 165
Figure 2: Transmissibility ratio for harmonic excitations…...……….. 166
Figure 3: Maximum response factor for different excitations……….. 167
Figure 4: Maximum response factor for different bandwidth of input motion…... 168
Figure 5: Mean values of maximum response factor……… 168
Figure 6: Severity ratio for different ground motions………..…………. 169
Figure 7: Bandwidth and center frequency, EPRI [3]……….……….. 169
Figure 8: Uniform hazard spectra and unscaled median spectra for 21 earthquakes………...… 170
Figure 9: Maximum response factor for real earthquakes……… 170
Figure 10: Maximum response factors as a function of B…..……….. 171
Figure 11: RMS severity ratio for real earthquakes……….. 171
Figure 12: Severity ratios for ground and floor spectra for real earthquakes w.r.t. EPRI reference values………..………. 172
Figure 14: Comparison of CB for actual earthquakes with the EPRI [3] recommended
values………..……….. 174 Figure 15: Interaction correction factor for mass 1 for narrowband harmonic
excitation……….……….. 175 Figure 16: Interaction correction factor for mass 2 for narrowband harmonic
excitation……….……….. 175 Figure 17: Comparison of CMI for actual earthquakes with EPRI [3] recommended
values……….………... 176 Figure 18: Comparison of clipping factor for actual earthquakes with EPRI [3]
recommended values, for coupled tuned system, primary system frequency = 10 Hz……….. 177 Figure 19: Comparison of clipping factor for actual earthquakes with EPRI [3]
recommended values, for coupled tuned system, primary system frequency = 5
Hz……….. 178 Figure 20: Comparison of clipping factor for actual earthquakes with EPRI [3]
recommended values, for coupled tuned system, primary system frequency = 2
1. General
The reliability of a power plant in case of an earthquake depends on the performance of the individual equipment as well as the effect of interaction between the different
components during and after the event. To ensure the safe shut down of a plant, the
equipment needs to be qualified either by testing or dynamic analysis as per the requirements of IEEE 344 [1], IEEE 693 [2], and EPRI [3]. The observations from testing are used to characterize the dynamic behavior of the system. The seismic probabilistic risk assessment (PRA) involves the estimation of fragility curves for plant equipment that has been qualified by testing or analysis. EPRI [3] recommends different factors for equipment response and capacity needed in the fragility computations.
Typically, substation equipment are large and bulky systems mounted on various types of support structures. The in-situ conditions at the time of installation such as structural properties and boundary conditions of the mounting arrangements can have a significant effect on the behavior and performance of such equipment. Therefore, it is important to consider the effects of the actual mounting conditions on the equipment qualification. When the design details of the support conditions are not known, IEEE 693 [2] recommends the use of an amplification factor equal to 2.5 on the ground motion to allow for possible
primary-secondary systems in case of lightly damped structures with very low mass ratios. The effect of mounting condition on the amplification of heavier equipment needs to be studied.
In case of lighter equipment (secondary systems), for classically damped primary-secondary systems, the equations of motion can be uncoupled into independent modal equations. In case of systems that have different damping ratios for the primary and
secondary systems, the coupled system becomes non-classically damped. For such systems, the equations of motion can no longer be uncoupled and the off-diagonal terms in the transformed damping matrix cannot be ignored. The reduction in the floor and incabinet response spectra peaks due to mass interaction can be calculated for multiple ground motions that are consistent with the site specific Probabilistic Seismic Hazard Analysis (PSHA) requirements. Subsequently, a probabilistic model for such reduction factors can be useful in estimating the In-structure Response Spectra (ISRS) for the equipment in case of equipment mounted on MDOF primary systems. The effect of mass ratios and frequency ratios on the response spectra can also be assessed for such systems.
The seismic qualification of an equipment based on testing requires the equipment to continue to function when subjected to a specific test response spectrum (TRS). Broad banded ground motions are found to cause more damage to equipment than the filtered narrow banded excitations [8, 9, 10, 11, 12, 13]. As a result, the amplified response of the equipment is clipped to transform the narrow banded spectra to an equivalent broadband response. The broadband clipping factor (CB) and the modal interaction clipping factor (CMI)
given in the current codes of practice are based on analyses of artificially generated input motions that are combinations of narrow banded sine beat type excitations.
It is proposed to study the existing methodologies for estimating the clipping factors (CB, CMI and CC) using harmonic input motions as well as actual ground motions. A
probabilistic framework needs to be developed based on actual ground motions that satisfy the requirements of the PSHA for specific locations. Wherever necessary, the models are validated and compared with respect to the existing recommendations to evaluate their performance relative to the current methodologies.
2. Background
required response spectra (RRS). Therefore, the amplified response at the degree of freedom of the equipment is the point of interest for qualification based on dynamic testing.
IEEE 693 [2] recommends the consideration of different installation parameters on the qualification of the equipment under in-situ conditions. Some of the important installation parameters as per IEEE 693 [2] are: equipment assembly, site response characteristics, soil-structure interaction (SSI), support soil-structures, base isolation, suspended equipment,
anchorage, and conductor loading from the conductor dynamic and adjacent equipment interaction. IEEE 693 [2] recommends the following methods when the equipment cannot be mounted for testing or modeled for analysis in its in-service configuration: a) modifying existing qualified support, b) qualification on multiple supports, c) qualification without support when support parameters are known, and d) qualification without support when support parameters are not known. Often times the design details of the support structure may not be known to the equipment manufacturer and IEEE 693 [2] recommends the use of an amplification of 2.5 times the ground motion for the equipment mounted on such supports. In case of qualification of equipment for nuclear power generating station, IEEE 344 [1] requires consideration of seismic adequacy of the supporting structure and the potential for adverse seismic interaction.
systems. The results of the study suggest that in general the amplification factor of 2.5 as specified by the IEEE 693 [2] standard is a conservative estimate in absence of support dynamic data.
For all practical purposes, it is always beneficial if a closed form equation is available to calculate the amplification ratio for a system. Previous studies [6, 7, 14] propose closed form solutions for dynamic response of coupled primary-secondary systems. However, these formulations are for lightly damped systems (classically damped) with low mass ratios (lighter secondary systems). A hybrid methodology is proposed [15] for the seismic
qualification of heavier equipment such as transformers and gas insulated switchgears (GIS) which uses experimental data from shake table tests of an equipment unit as well as the analytical results obtained from a detailed finite element analysis. In this study, a closed form equation is developed to model the dynamic behavior of multi degree of freedom systems starting from the equation of motion of the system. Such formulations are useful to estimate the amplified response of equipment with high mass ratios.
In case of classically damped systems, the off-diagonal terms in the transformed damping matrix are ignored and the equation of motion can be uncoupled into independent modal equations by pre-multiplying the classical damping matrix by the transpose of the mode shape matrix and post-multiplying it by the mode shape matrix. However, in case of non-classical damping such an approximation is not accurate.
which lighter secondary systems (such as piping in a nuclear power plant) are mounted on relatively heavier supporting structures . In this thesis, these developments are summarized and simplified closed-form solutions are presented to account for coupling between primary and secondary systems.
Other studies have also been conducted over the last two to three decades to develop different methods that can overcome the limitations of uncoupled analysis and consider non-classical damping and dynamic interaction between equipment and structures while
estimating the ISRS accurately. Lin and Liu [20], USNRC [21] and RDT Standard [22] study the effect of coupling on the secondary system response as functions of mass and frequency ratios of the primary-secondary systems to identify regions in which decoupling cannot be permitted. Several semi-empirical as well as heuristic methods have been
developed to perform coupled analysis of secondary systems [23, 24, 25, 26]. Singh [27, 28, 29] uses the random vibration approach to develop a response spectrum method for non-classically damped systems. Gupta [30] and Gupta and Jaw [31] have developed approximate methods for evaluating the complex eigenvalues and eigenvectors of non-classically damped primary-secondary systems. The floor response spectrum method or ISRS method can be used to calculate the response of the secondary system [6, 7, 30, 32, 33, 34, 35, 36].
or nearly tuned cases, due to interaction between the primary and secondary systems, the spectral response of the secondary system may be excessively overestimated if the effect of mass interaction is not considered. The effect of non-classical damping also needs to be incorporated when calculating the reduction factor for equipment response due to mass interaction.
In case of lighter equipment such as relays and switches, the input motion gets filtered through the building and supporting structures such that the resulting excitation is narrow banded in nature. However, broad banded ground motions are found to cause more damage to such equipment than the filtered narrow banded excitations. As a result, the definition of acceleration capacity used in the fragility models involve clipped response spectra for both TRS and RRS. Kana [12] shows that the development of appropriate dynamic amplification for devices mounted in equipment is based on the root-mean-square (RMS) severity changes with bandwidth, multimode interaction and multi-axis excitation. Due to the absence of multi-mode response, variable RMS severity over the bandwidth of the spectra and the lack of interaction of nonlinear responses, a narrow banded input is judged to be less severe from a fragility point of view.
The current recommendation for clipping factor as per EPRI [3] considers a combined effect of broadband clipping factor (CB) and modal interaction clipping factor (CMI) that
incorporates the high RMS severity ratio and modal interaction in case of broadband
generated input motions that are combinations of one or more narrow banded harmonic type excitations.
3. Objective
A study of the existing literature illustrates the limitations in the existing
methodologies for estimating the correct dynamic response for the seismic qualification of equipment. The effect of mounting arrangement in case of lighter equipment is studied in detail [6, 7, 14, 16, 17, 18, 19, 30, 31, 32, 33, 34, 35]. The amplification in equipment response due to interaction with the supporting structures needs to be studied for heavier equipment mounted on lighter supporting structures.
In case of lighter equipment, the reduction in the peak spectral response due to dynamic interaction with the primary supporting structure can be probabilistically quantified in terms of the mass and frequency ratios of the system. Also, in case of sensitive equipment such as relays and switches, the filtered narrowband amplified responses need to be clipped to corresponding broad banded spectra for the fragility estimation of the equipment. Since earthquake motions are random in nature, an attempt is made to propose a risk consistent framework for the clipping of the narrowband spectra by using real earthquakes as input motions.
The objectives of the present study can be classified into three broad categories. The key tasks of the proposed research for each of these categories are outlined as follows.
Identify system configurations representative of the behavior of
equipment-support system at the actual site of installation;
Validate existing recommendations for the amplification value requirements of
equipment-support systems;
Develop a closed-form solution for the amplification at the degree of freedom of
the equipment;
Validate the closed-form formulation with response spectrum analysis results
from single degree of freedom primary and single degree of freedom secondary systems (SDOF-SDOF) to verify its accuracy;
Propose simplifications to the closed-form formulations, if any;
ii. Estimation of the reduction in the peak spectral response due to coupling effect in an MDOF equipment-support structure and development of a probabilistic model for the reduction factor in case of tuned or nearly tuned primary-secondary systems: The steps required to achieve the objectives of this research are summarized below. Calculate peak spectral responses for different configurations of SDOF secondary
systems mounted on MDOF primary systems considering coupling effect as well as different ground motions that are consistent with the PSHA requirements for the locations of interest;
Calculate peak spectral response for uncoupled SDOF secondary systems for
Compare the coupled and uncoupled spectral responses and estimate the reduction
factors for transforming uncoupled in-structure spectra to reduced and more accurate coupled spectra;
Develop a probabilistic model for the reduction factors and study the effect of
mass ratio and frequency ratio on the reduction factors.
iii. Validation of the existing methodology for clipping of narrowband response spectra for equipment such as relays and switches and development of a risk consistent framework as per the site specific requirements of Probabilistic Seismic Hazard Analysis (PSHA): The steps required to achieve the objectives of this research are summarized below.
Investigate the factors such as variable RMS severity and modal interaction that
contribute to increased relay chatter and structural damage caused by broadband spectra in comparison to amplified narrowband response spectra for the
equipment;
Calculate the extent of clipping necessary for narrowband response spectra to
transform into an equivalent broadband spectra when the equipment is subjected to harmonic excitations as well as combinations of multiple sine beat type motions;
Develop clipping factors for equipment subjected to real earthquake motions and
Develop a probabilistic model for the estimation of clipping factors based on
calculations on real earthquake type input motions. .
4. Organization
The thesis is divided into five main parts. The first part gives an introduction to the problem being considered followed by a discussion of the main objectives of the research. The next three parts are manuscripts which will be submitted for possible publication in peer reviewed journals.
The effect of mass interaction between the equipment and the supporting structures has a significant contribution in estimating the dynamic response of the equipment for qualification purposes. Extensive studies [6, 7, 14, 16, 17, 18, 19, 30, 31, 32, 33, 34, 35] are conducted to estimate the coupled dynamic response of secondary systems (equipment) in case of lightly damped systems with low mass ratios. The seismic amplifications for heavier equipment such as transformers mounted on lighter, more flexible supporting structures have not been studied in detail. The second part of the thesis studies the effect of mass and
frequency ratios on the seismic amplifications for such systems. Using the equations of motion for multi degree of freedom systems, closed form equations are derived as functions of modal properties. Wherever possible, simplifications are made to these formulations depending on the combinations of mass and frequency ratios.
high frequency ground motions, such uncoupled analysis not only results in spectra with high peaks but may also result in peaks in high frequency regions. The third part of the thesis compares the coupled equipment response with respect to decoupled response for high frequency and low frequency input motions. A parametric study is conducted to estimate statistical bounds for the reduction factor that can be directly applied to the uncoupled peak responses to give more accurate spectral responses. The effect of non-classical damping of the system is also investigated.
Due to filtering of input motions through the different supporting structures, the response spectra for equipment become more and more narrow banded in nature. However, the equipment needs to be qualified with respect to a wide frequency range. EPRI [3] recommends expressions for clipping factors to estimate equivalent broadband spectral response of the equipment for qualification purposes. However, the studies undertaken to establish these expressions are based on narrowband excitations that are typically
combinations of sine beat type motions. The fourth part of the thesis attempts to calculate the clipping factors for real earthquakes that are consistent with the PSHA requirements for a location of interest and develop a risk consistent framework from equipment qualification point of view.
REFERENCES
[1] IEEE 344, 2004. “IEEE recommended practice for seismic qualification of class 1E equipment for nuclear power generating stations”.
[2] IEEE 693, 2005. “IEEE recommended practice for seismic design of substations”. [3] EPR1, 1994. “Methodology for developing seismic fragilities.” TR-103959.
[4] Esfandiari, S., Fujisaki, E., Schiff, A., 2013. “Study of support amplification factors for varying frequency & mass ratios of equipment mounted on support.” Trans. 22nd Conference
on Structural Mechanics in Reactor Technology, San Francisco, CA, USA, Division IV. [5] EPRI, 2013. “Study of support amplification factors for various frequency and mass ratios of idealized equipment mounted on a support structure.” Palo Alto, CA, 3002000767.
[6] Gupta A., Gupta, A. K., 1994a. “New developments in coupled seismic analysis of equipment and piping.” Proceedings of the 13th International Conference on Structural
Mechanics in Reactor Technology, Porto Alegre, Brazil.
[7] Gupta A., Gupta, A. K., 1994b. “Applications of new developments in coupled seismic analysis of piping systems.” Proceedings of the 13th International Conference on Structural
Mechanics in Reactor Technology, Porto Alegre, Brazil.
[8] Merz, K. L., 1991. “Generic seismic ruggedness of power plant equipment, Rev. 1.” Palo Alto, CA, Electric Power Research Institute, NP-5223.
[10] Kana, D. D., Pomerening, D. J., 1983. “Correlation of methodologies for seismic qualification test of nuclear plant equipment.” SWRI-6582-002, prepared for U.S. Nuclear
Regulatory Commission by Southwest Research Institute, San Antonio, Texas.
[11] Kana, D. D., 1989. “Use of amplification factors for developing equipment base seismic capacity for relays.” Letter report to P. Y. Chen, U. S. Nuclear Regulatory Commission.
[12] Kana, D. D., Chen, P. Y., 1991. “Dynamic amplification factors for seismic evaluation of devices mounted in equipment.” Trans. 11th International Conference on Structural
Mechanics in Reactor Technology, K28/5, 337-342.
[13] Kana, D. D., Pomerening, D. J., 1987. “Determination of Modal Interaction Correction for Narrowband Fragility Data.” Transactions of the 9th International Conference on
Structural Mechanics in Reactor Technology, JK Panel Session (NUREG/CR-0088), 181-205.
[14] George, Z., 1996. “Development and Evaluation of Methods for Coupled Seismic Analysis of Piping Systems.” Doctoral Thesis, Department of Civil Engineering, North
Carolina State University, Raleigh, NC.
[15] Chatterjee, P., Gupta, A., 2014. “Reconciliation of experimental and analytical behavior of gas-insulated switchgear.” Technical Report No.-CNEFS-05/2014, Center for Nuclear Energy Facilities and Structures, NC State University, Raleigh, NC.
[17] Tadinada, S. K., Gupta, A., 2011. “Consideration of uncertainties in seismic analysis of non-classically damped coupled systems.” Nuclear Engineering and Design, Vol. 241, Issue. 6, pp. 2034-2044.
[18] Gupta, A., Choi, B., 2005. “Consideration of uncertainties in seismic analysis of coupled building-piping systems.” Nuclear Engineering and Design, Vol. 235, pp. 2071-2086.
[19] Gupta, A, Gupta, A. K., 1998. “Missing mass effect in coupled analysis, I: complex modal properties.” J. Struct. Eng. ASCE, 124 (5), pp. 490-495.
[20] Lin, C. W., Liu, T. H., 1975. “A discussion of coupling and resonant effects for integrated systems consisting of subsystems.” Proceedings, Extreme Load Conditions and
Limit Analysis Procedures for Structural Reactor Safeguards and Containment Structures, U3/3, Berlin.
[21] U. S. Nuclear Regulatory Commission, 1975. “Standard Review Plan, Section 3.7.2, Seismic System Analysis.”
[22] RDT Standard F9-2T, 1974. “Seismic Requirements for Design of Nuclear Power Plants and Test Facilities.”
[23] Penizen, J., Chopra, A. K., 1965. “Earthquake Response of Appendage on a Multi-Story Building.” Proceedings, 3rd World Conference on Earthquake Engineering, Vol. II, New
Zealand.
[24] Biggs, J. M., Roesset, J. M., 1970. “Seismic Analysis of Equipment Mounted on a Massive Structure.” Seismic Design for Nuclear Power Plants, Ed. By Hansen, R. J., MIT
[25] Kapur, K. K., Shao, L. C., 1973. “Generation of Seismic Floor Response Spectra for Equipment Design.” Specialty Conference on Structural Design of Nuclear Power Plant
Facilities, ASCE, Chicago, Illinois.
[26] Hadjian, A. H., 1977. “On the decoupling of secondary systems for seismic analysis.” Proceedings, Sixth World Conference on Earthquake Engineering, New Delhi, India. [27] Singh, M. P., Suarez, L. E., 1986. “A Perturbation Analysis of the Eigenproperties of Equipment-Structure Systems.” Nuclear Engineering and Design, Vol. 97, No. 2, pp. 167-185.
[28] Singh, M. P., Suarez, L. E., 1988. “A Method for Dynamic Coupling with Non-classical Damping Effects.” Journal of Sound and Vibration, Vol. 120, No. 3, pp. 539-555.
[29] Singh, M. P., Burdisso, R. A., 1987. “Multiply Supported Secondary Systems II: Seismic Inputs.” Earthquake Engineering and Structural Dynamics, Vol. 15, No. 1, pp.
73-90.
[30] Gupta, A. K., 1984. “Seismic Response of Multiply Connected MDOF Primary and MDOF Secondary Systems.” Nuclear Engineering and Design, Vol. 81, No. 3, pp. 385-394.
[31] Gupta, A. K., Jaw, J. W., 1986. “Complex Modal Properties of Coupled Moderately Light Equipment-Structure Systems.” Nuclear Engineering and Design, Vol. 91, No. 2, pp. 171-178.
[32] Gupta, A. K., Jaw, J. W., 1986. “Seismic Response of Non-classically Damped Systems.” Nuclear Engineering and Design, Vol. 91, No. 2, pp. 153-159.
[34] Gupta, A. K., Jaw, J. W., 1986. “Coupled Response Spectrum Analysis of Secondary Systems Using Uncoupled Modal Properties.” Nuclear Engineering and Design, Vol. 92, No.
1, pp. 61-68.
[35] Gupta, A. K., Jaw, J. W., 1985. “CREST, a Computer Program for Coupled Response Spectrum Analysis of Secondary Systems.” User’s Manual, Center for Nuclear Power Plant
Structures, Equipment and Piping, North Carolina State University, Raleigh, North Carolina. [36] Megahed, H. A., Gupta, A. K., 1992. “Topics in Seismic Response of Non-classically Damped Systems.” Report, Research Program on Nuclear Power Plant Structures, Equipment
and Piping, Department of Civil Engineering, North Carolina State University, Raleigh, NC. [37] Hwang, K., Tong, W. H., Dar, A., 2013. “Bruce B seismic probabilistic risk
assessment.” Trans. 22nd Conference on Structural Mechanics in Reactor Technology, San
Francisco, CA, USA, Division IX.
[38] EPRI, 2015. “High Frequency Program: Application Guidelines for Functional Confirmation and Fragility Evaluation.” 3002004396, Draft Report.
[39] EPRI, 2007. “Program on Technology Innovation: The Effects of High Frequency Ground Motion on Structures, Components, and Equipment in Nuclear Power Plants.”
1. Introduction
The reliability of a power plant in case of an earthquake depends on the performance of the individual equipment as well as the effect of interaction between the different
components during and after the event. Such equipment can be part of an electrical substation or nuclear power plant and needs to be seismically qualified to ensure the safe shutdown of the power plant in case of a seismic event.
Depending on the voltage classification and their relative importance in a substation, the equipment may be considered inherently acceptable, or may require qualification by testing, finite element analysis, static coefficient analysis, etc. [1, 2]. For qualification of equipment based on testing, EPRI [3] recommends different factors for response and capacity to compute fragility of equipment. The response from the testing is used to characterize the dynamic behavior of the system. The equipment under consideration needs to be qualified with respect to a broad band response spectrum.
modifying existing qualified support or with respect to different possible support
configurations. The code also recommends equipment qualification without support in case the support conditions are “not known” or as per site requirements. Under such situations,
IEEE 693 [2] requires a uniform amplification factor of 2.5 on the ground motion to allow for possible amplifications by the support structure. Furthermore, for bushings mounted on a transformer, IEEE 693 [2] recommends an amplification factor of 2.0 to account for possible amplification effects of the transformer. In this case, it is assumed that the dynamic
properties of the transformer are “not known”. Interestingly, the recommended values of 2.5 and 2.0 are based on professional expertise. The two values can appear to be inconsistent and are in most cases considered excessively conservative. Yet, there is no fundamental basis for such conclusions.
In case of qualification of equipment for nuclear power generating stations (Class 1E equipment), IEEE 344 [1] requires consideration of seismic adequacy of the supporting structure and the potential for adverse seismic interaction.
The actual amplification of the equipment, however, depends on the dynamic characteristics of both the equipment and the support. The equipment to support mass and stiffness ratios therefore contribute to the overall dynamic behavior of the system and in turn affect the amplified response of the equipment. Electric Power Research Institute has
frequencies between the primary (support) and secondary (equipment) systems. The mass and stiffness of the equipment in such systems are typically higher than that of the supporting structures. Hence the analysis is limited to high mass and frequency ratios between the equipment-support systems. The results of the study suggest that in general the amplification factor of 2.5 as specified by the IEEE 693 [2] standard is a good conservative estimate.
The work presented in the exploratory study by EPRI [5, 6] can be advanced further by developing a closed form equation to calculate the amplification ratio for a system. Such a formulation can provide the much needed fundamental basis for selecting appropriate
amplification factor and also help in evaluation of actual amplification factors for specific cases of a given equipment and support configuration.
The closed form solution to estimate the amplification of input motion is developed using response spectrum analysis on a 2 DOF coupled system. The formulation is validated with respect to the corresponding time history analysis results. The closed form equations can be used to give an estimate of the amplification for a given frequency ratio and mass ratio of the equipment-support system. These closed form equations are further simplified depending on the ranges of the mass ratio and frequency ratio for the system under consideration. The accuracy of the simplified formulations is also evaluated with respect to the complete formulation.
When the equipment is mounted on supports different from those used in an existing qualification, the equipment-support system is acceptable if the modified support is
dynamically equivalent or the amplification of the equipment response due to the support is lower than that due to the existing qualified support. In case, it is necessary to have multiple supports, the complete model needs to be analyzed to identify the system configuration that would reach the limit state first. IEEE 693 [2] requires the qualification of such equipment when it is mounted or modeled on the most seismically vulnerable configuration of the equipment/structures to be used. When the support conditions are known, the equipment can be tested without supports. The code requires the equipment to be qualified with respect to an amplified input ground motion which is 1.1 times the amplification value for the known support system. However, the most critical case for equipment qualification is when the support conditions are not known. Under such circumstances the equipment is mounted directly on the shake table and tested by an input ground motion which is amplified by a factor of 2.5. The qualification will be acceptable when the in-situ demand (required response spectrum) is enveloped by the response spectra from the amplified ground motion (test response spectrum).
In case of nuclear power generating stations (Class 1E equipment), IEEE 344 [1] has identified that the dynamic response of equipment on structures may be amplified or
The following section reviews the results of the research undertaken as a part of an EPRI project [5] to study the variability of amplification factor based on variations of frequency and mass ratio of the standalone equipment to the support.
3. Existing Study on Amplification Factor for Equipment Mounted on Support
This section follows the procedure outlined in EPRI [5] to calculate the amplification ratio for different system configurations. Similar to the above mentioned study [5], the equipment mounted on a support structure is modeled as a 2-DOF system with dynamic properties in one direction as shown in Fig. 2. The system has two lumped masses: mp for the
primary system (support structure) and ms for the secondary system (or the equipment). The
corresponding uncoupled frequencies are fp and fsrespectively. The response spectrum for the
system can be generated by conducting a coupled time history analysis on the system using an input time history compatible with the IEEE 693 [2] specified input ground motion spectra. Figure 3 shows the IEEE 693 [2] recommended required response spectrum (RRS) anchored to 1.0g for high performance level qualification. A 2% damping ratio is considered for both the primary and the secondary systems. The analysis can be broadly classified into two parts:
Dynamic analysis of the combined 2 DOF system;
Study of the equipment stand-alone response subjected to 2.5 times the ground
motion (or IEEE- 693 spectral shape anchored to 2.5g).
These two sets of analyses are repeated for a combination of 5 mass ratios (ms/mp =
10, 20, 33 Hz). For each of these two sets of analyses, the following response parameters are studied:
Plots of response spectra at the base of the equipment vs the IEEE-693 input spectra
anchored to 1.0g;
Peak acceleration and displacement response at the equipment mass point for coupled
analysis as well as stand-alone analysis;
Peak force response at the equipment mass point.
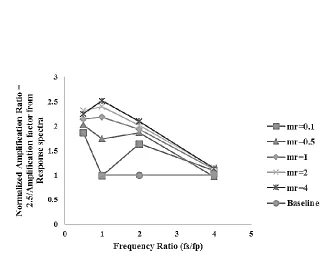
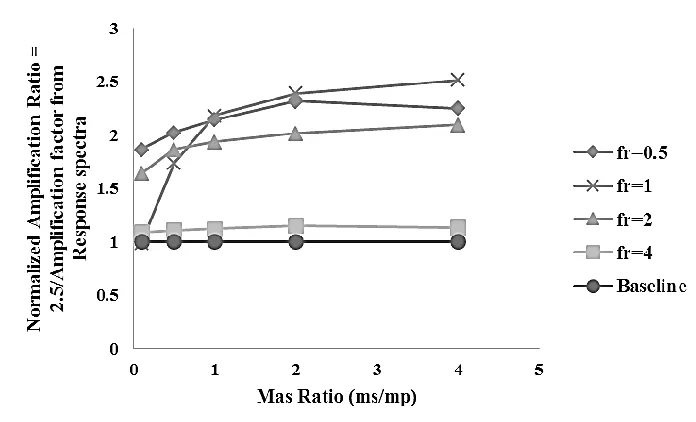
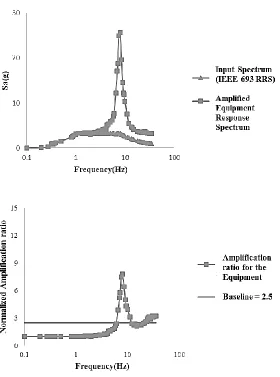
The primary objective of the study [5] is to estimate the variation of amplification ratio for different combinations of mass and frequency ratios of the 2 DOF systems. The results from the study are validated in this section. Fig. 4 shows the variation of normalized amplification ratio vs. frequency ratio for support frequency of 5Hz. Fig. 5 shows the variation of normalized amplification ratio vs. mass ratio for support frequency of 5Hz. In addition, Fig. 6 shows the plot of amplified response spectrum at the top of the support structure superimposed on the ground spectrum for the analysis case corresponding to a support frequency of 10 Hz with frequency ratio of 2.0 and mass ratio of 0.5. The
amplification factors are plotted as a function of frequency. The observations from this study [5] is summarized as follows:
95% of the analysis cases show that an amplification factor of 2.5 is conservative;
Only 4% of the cases show an amplification factor greater than 2.5
formulation presented in this paper is an attempt to develop a closed-form solution that allows accurate estimation of the amplification of equipment response due to the interaction between the support and the equipment.
4. Development of Closed-Form Formulation
4.1 Effect of mass ratio on the Response Spectrum Analysis
The response spectra at the secondary system is plotted for a range of mass ratios and frequency ratios of the system. Figs 7-12 show the plots of the response spectra for coupled as well as uncoupled analyses for various combinations of mass and frequency ratios of the primary and secondary systems. In response spectrum method, the modal responses are combined using different mode combination techniques [7]. Depending on whether the modal frequencies are closely spaced or not, the responses from different modes are combined using Double Sum, SRSS (square root of sum of squares) etc. [7].
In most cases, the substation equipment is heavier and less flexible than the mounting arrangement. As can be observed from the plots, the response at the secondary degree of freedom is primarily dominated by one mode for cases with relatively larger values of frequency ratio. Also, in case of higher masses of the secondary system, the modal
4.2 Amplification ratio for multi degree of freedom system
The equation of motion for a multi degree of freedom system can be written as follows:
[𝑀]{𝑢̈} + [𝐶]{𝑢̇} + [𝐾]{𝑢} = −[𝑀]{𝑢𝑏}𝑢̈𝑔0eiΩt (1)
where [M], [C] and [K] are the mass, damping and stiffness matrices, {𝑢𝑏} is the influence
force vector at the base of the system,𝑢̈𝑔(𝑡) is the ground acceleration function at the base
with frequency Ω, and {u} is the relative displacement response vector.
For the 2-DOF system, as shown in Fig. 2,
[𝑀] = [𝑚𝑝 0
0 𝑚𝑠] , [𝐾] = [
𝑘𝑝+ 𝑘𝑠 −𝑘𝑠 −𝑘𝑠 𝑘𝑠
],
[𝐶] = [𝑐𝑝−𝑐+ 𝑐𝑠 −𝑐𝑠
𝑠 𝑐𝑠 ] (2)
where, kp and ksare the stiffness for the primary system (support) and secondary system
(equipment) respectively and mp and msare the corresponding masses.
An eigenvalue analysis for the 2-DOF system gives the following expression for the circular frequencies:
𝜔2 =𝑤𝑝2
2 [(1 + 𝑟𝑓
2 + 𝑓2) ± (1 − 𝑓2)√1 +2𝑟𝑓2(1+𝑓2+0.5𝑟𝑓2)
(1−𝑓2)2 ] (3)
where, 𝜔𝑝 = √𝑚𝑘𝑝
𝑝 is the natural frequency of the primary system and 𝜔𝑠 is the
corresponding natural frequency of the secondary system, r and f are the mass ratio and frequency ratio of the system, as defined in section 3.
{𝜑1} =
{
2𝑟𝑓2
[1 + 𝑟𝑓2 − 𝑓2− (1 − 𝑓2)√1 +2𝑟𝑓2(1 + 𝑓2+ 0.5𝑟𝑓2) (1 − 𝑓2)2
1.0 }
{𝜑2} =
{
2𝑟𝑓2
[1 + 𝑟𝑓2− 𝑓2+ (1 − 𝑓2)√1 +2𝑟𝑓2(1 + 𝑓2 + 0.5𝑟𝑓2) (1 − 𝑓2)2
1.0 }
(4) where, r = ms/mp, f = fs/fp
The eigenvectors or the mode shapes can be mass-normalized as:
{𝛷𝑖} = {𝜑𝑖} √𝐷𝑖 (5) where, 𝐷𝑖 = {𝜑𝑖}𝑇[𝑀]{𝜑 𝑖}
The participation factors can be calculated as:
𝛾𝑖 = {𝛷𝑖}𝑇[𝑀]{𝑢𝑏} (6)
If Sa1 and Sa2 are the spectral accelerations at mode frequencies ω1 and ω2 from
ground response spectrum, the total acceleration can be calculated as
{𝑢̈𝑖 𝑚𝑎𝑥} = 𝛾𝑖{𝛷𝑖}𝑆𝑎 𝑖 (7)
The total maximum acceleration (𝑈̈𝑝 𝑚𝑎𝑥𝑇 ) and (𝑈̈𝑠 𝑚𝑎𝑥𝑇 ) can be obtained by modal
rule [9]. The amplification ratio is calculated by dividing the total maximum acceleration for the secondary system (equipment) by the ordinates of the ground response spectrum
corresponding to the frequency of the secondary system, 𝑆𝑎,𝑔𝑟𝑜𝑢𝑛𝑑.
Mathematically,
𝐴𝑚𝑝𝑙𝑖𝑓𝑖𝑐𝑎𝑡𝑖𝑜𝑛 𝑟𝑎𝑡𝑖𝑜 = 𝑈̈𝑠 𝑚𝑎𝑥 𝑇 𝑆𝑎,𝑔𝑟𝑜𝑢𝑛𝑑
(8)
In the following section, the formulation of amplification at the equipment degree of freedom using response spectrum analysis is validated with respect to exact time history analysis results.
5. Validation of Closed Form Equation for Amplification of Equipment
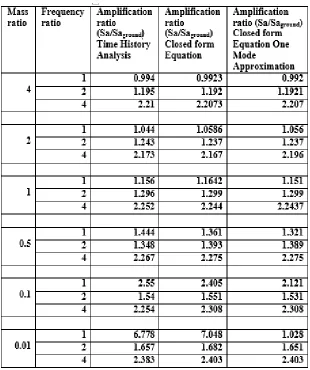
The natural frequency of the primary system is considered to be equal to 4 Hz. The frequencies, mode shapes and modal participation factors as estimated using equations (3), (4) and (6) match with the results from eigenvalue analysis of the 2 DOF system. The formulation is validated further by comparing the values of the maximum spectral responses at the two degrees of freedom from the analytical formulations and time history analyses. Tables 1 through 5 shows the comparison for the closed-form formulation and time history results.
The validated closed form equations can be used to estimate the amplification ratio at the secondary system. This degree of freedom corresponds to the equipment which typically is heavier and more rigid than the supporting structure. So essentially only one mode
shown in Table 6. As can be observed from the results, the one mode approximation works well for the type of system considered.
The complete form of the closed-form solution for amplification ratio is a polynomial function of mass and frequency ratios. For the convenience of design and analysis, the complete formulations can be simplified further. Such simplifications are based on the assumptions of the range of mass ratio and frequency ratio of the equipment-support system. The following sections discuss the development of these simplified formulations. The performance of these equations are also compared with respect to the complete solution for amplification.
6. Simplified Analytical Models for Different System Configurations
The dynamic response of equipment is dependent on the mass ratio and frequency ratio of the system. The system configuration can be broadly classified into four categories:
Case 1: r>1, f>1: These are the type of systems where heavy bulky equipment is mounted on light, flexible supporting structures.
Case 2: r>1, f<1: These are systems where the equipment is heavier than the supporting structures but the support is more rigid than the equipment.
Case 4: r<1, f>1: In such a case, the equipment is lighter than the support but more rigid.
The amplification ratio using response spectrum analysis is given by:
𝐴𝑚𝑝𝑙𝑖𝑓𝑖𝑐𝑎𝑡𝑖𝑜𝑛 𝑟𝑎𝑡𝑖𝑜 =𝛾1𝜑12𝑆𝑎,𝜔1 𝑆𝑎,𝑔𝑟𝑜𝑢𝑛𝑑
The simplified analytical models for amplification ratio for the above four cases are discussed below.
6.1 Case 1: r>1, f>1: One Mode Approximation
In case of heavy, stiff equipment mounted on light flexible supports, the first eigenvalue can be given by:
𝜆12 ≈ 𝑘𝑝 𝑚𝑝+ 𝑚𝑠
= 𝜔𝑝 2 1 + 𝑟
The frequency for the first mode is approximated by:
𝜔1 ≈ 𝜔𝑝 √1 + 𝑟
The mode shape (normalized to unity) for the first mode is:
𝜑11= 𝑘𝑠
𝑘𝑝+ 𝑘𝑠+ 𝜆12𝑚𝑝
= 𝑓
2𝑟(1 + 𝑟) (1 + 𝑟𝑓2)(1 + 𝑟) + 1
𝜑12 = 1
𝜑1 ≈ { 𝜃1 (2 + 𝜃1)
1 }
where,
𝜃1 = 𝑟𝑓2(1 + 𝑟)
The mass normalized Eigen vector for the first mode shape is:
𝛷1 ≈
{
√ 𝜃1
(2 + 𝜃1)(1 + 𝑟)
√(2 + 𝜃1) 𝜃1(1 + 𝑟) }
The modal participation factor for the first mode is given by:
𝛾1 = (𝛷11+ 𝛷12𝑟)
Substituting the values we get,
𝛾1 ≈ √ 𝜃1
(2 + 𝜃1)(1 + 𝑟)
+ 𝑟√(2 + 𝜃1) 𝜃1(1 + 𝑟)
Therefore, at the degree of freedom of the equipment,
where,
𝜃1 = 𝑟𝑓2(1 + 𝑟)
(9) The simplified formulation for the amplification ratio is compared with the
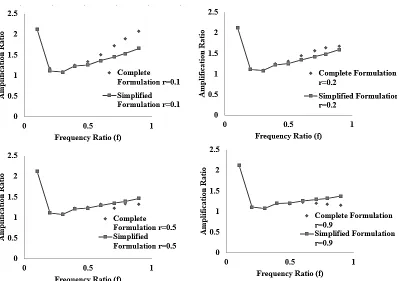
corresponding one mode approximation for the complete closed form equation developed using response spectrum analysis. Table 7 and Fig. 13 compare the performance of such simplified formulations. The figure shows that as the frequency ratio increases the simplified form of the closed form solution converges to the exact results. In case of frequency ratios close to 1, the simplified form always gives the higher values for the amplification ratios.
6.2 Case 2: r>1, f<1: One Mode Approximation
The analytical formulation for the modal frequency given by equation (3) can be simplified by neglecting higher order terms in f as f<1.
For the first mode, equation (3) simplifies as:
𝜔1 ≈ 𝜔𝑝 2
2 (1 + 𝑟𝑓
2− √2𝑟𝑓2)
Using similar simplifications by neglecting higher order terms in f, the expression for the unity normalized eigenvector in the first mode as given by equation (4) reduces to:
𝜑11≈
𝑟𝑓2 √1 + 4𝑟𝑓2
𝛷11 =
𝑟𝑓2
(𝑟 + 4𝑟2𝑓2+ 4𝑟2𝑓4)0.5
A plot of the denominator for different values of r and f (r>1, f<1) shows that it
converges to √𝑟 as frequency ratio gets smaller. Fig. 14 shows the plot of the denominator with respect to different frequency and mass ratios in the range of the current case study.
The observations from this figure can be summarized as follows:
The denominator in the equation for the modal participation factor, 𝛾1, is plotted
as a function of the frequency ratio, f.
As the frequency ratio becomes smaller (f<1), for all mass ratios, the denominator
converges to the value of √𝑟.
However, for very large mass ratios, the convergence is not truly satisfied. But in
such cases the exact value of the denominator will always be higher than √𝑟 and consequently the exact amplification ratio will be lower than the simplified value.
As will be discussed later, the simplification in the closed form solution using this approximation gives a good estimate for the modal properties and the amplification ratio.
Therefore, the mass normalized model shapes can be approximated as follows:
𝛷11 ≈ √𝑟𝑓2
𝛷12≈ √1 + 4𝑟𝑓 2 𝑟
𝛾1 = 𝑟𝑓 2
√𝑟 + 4𝑟2𝑓2+ 4𝑟2𝑓4+
𝑟√1 + 4𝑟𝑓2
√𝑟 + 4𝑟2𝑓2+ 4𝑟2𝑓4 ≈ √𝑟𝑓
2+ √𝑟√1 + 4𝑟𝑓2
Therefore, at the degree of freedom of the equipment, for f<1 neglecting fourth order terms in the denominator,
𝛾1𝛷12≈ 𝑓 2 (𝜃2)0.5
+ 1
where,
𝜃2 = (1 + 4𝑟𝑓2)
(10) The performance of this simplified formulation with respect to the complete model is shown in Fig. 15. As mentioned before, the simplification as given in equation (10) always calculates the higher values of the amplification ratio and can be used to estimate the amplified response conservatively. As the frequency ratio becomes smaller the simplified solution converges to the exact results.
6.3 Case 3: r<1, f<1: One Mode Approximation
When both the mass ratio and frequency ratio are less than 1, the fourth order terms in f can be neglected.
Therefore, √𝑟 + 4𝑟2𝑓2+ 4𝑟2𝑓4 ≈ √𝑟 + 4𝑟2𝑓2.
𝛾1 ≈ 𝑟𝑓 2
√𝑟 + 4𝑟2𝑓2+ 4𝑟2𝑓4+
𝑟√1 + 4𝑟𝑓2
√𝑟 + 4𝑟2𝑓2+ 4𝑟2𝑓4 ≈
𝑟𝑓2+ 𝑟√1 + 4𝑟𝑓2 √𝑟 + 4𝑟2𝑓2
𝛷12≈ √1 + 4𝑟𝑓2
Therefore, the simplification becomes,
𝛾1𝜑12 = 𝜃3 𝑟(1 + 4𝜃3)0.5
+ 1
where,
𝜃3 = r𝑓2
(11) 6.4 Case 4: r<1, f>1: One Mode Approximation
This type of system configuration has a simplified formulation similar to case 1. As the equipment has higher stiffness than the supporting structures (f>1), the first eigenvalue can be given by:
𝜆12 ≈ 𝑘𝑝 𝑚𝑝+ 𝑚𝑠
= 𝜔𝑝 2 1 + 𝑟
The frequency for the first mode is approximated by:
𝜔1 ≈ 𝜔𝑝 √1 + 𝑟
Following similar procedure as Case 1, at the degree of freedom of the equipment,
𝛾1𝛷12= 1 + 2𝑟 𝜃1(1 + 𝑟)
𝜃1 = 𝑟𝑓2(1 + 𝑟)
(12) Figs. 16 and 17 compare the results of the simplified formulations for cases 3 and 4 with respect to the one mode approximation of the complete formulation. As can be observed from Fig. 16, for very small mass ratios, the simplified closed form solution results in
underestimation of the amplification ratio. However, the simplification works well for
moderately light systems. In case of lighter but stiffer equipment, as in Case 4, the simplified closed form solution converges with the exact results.
The next section provides a discussion of the observations from the different case studies for both the complete closed form solution and the simplified forms for the different system configurations presented in the current section.
7. Discussion of Results
The observations from the results can be summarized as follows:
The spectral response as well as the amplification ratio for the secondary system
matches well with exact time history analysis results.
Often only one mode approximation can be used for such heavy, rigid equipment
mounted on lighter and flexible support structures.
The closed form equations can be further simplified based on the range of mass
ratios and frequency ratios of the system.
the amplification ratio and the estimated values are higher than the corresponding values from the complete formulation.
For r = 1 and f =1, the amplification ratio is exactly equal to 1.16;
In case of mass ratio greater than 1 and frequency ratio less than 1 (r>1, f<1), for
smaller frequency ratios (f<0.5), the simplified formulation converges with the complete closed form solution. However, as the frequency ratio approaches 1, the simplification always estimates higher amplification values than the complete formulation.
When both the mass ratios and frequency ratios are small (r<1, f<1), the
simplified formulation converges with the exact results for small frequency ratios. However, the convergence is not good as the frequency ratio approaches 1 in case of very light equipment (r < 0.25). For such systems, since all the modes of the system participates in the dynamic response of the system, one mode
approximation does not give accurate results. In such cases both the modes need to be used to estimate the equipment response [8, 9, 10].
The simplified one mode approximation gives good results for the case when the
equipment is mounted on structures that are heavier but less rigid (r < 1, f > 1).
8. Summary and Conclusions
The existing code recommendations require the use of an amplification factor of 2.5 on the ground motion to allow for possible amplifications by the support structure when the design details of the support conditions are not known. In case of bushings on transformer, IEEE 693 [2] recommends an amplification factor of 2.0. Therefore, there is an inconsistency in the existing recommendations (2.5 vs 2.0). EPRI [5] has studied the effect of mass and frequency ratios on the amplification of the equipment response and makes the following observations:
For small mass ratios and frequency ratios, the amplification ratio is typically lesser
than 2.
For stiff supporting structures, the amplification factor for lighter and flexible
equipment usually ranges between 1 and 2.
When rigid equipment is mounted on flexible supports, the incabinet motion may
be amplified much higher than 2.5 times the input ground motion.
When the mass and stiffness ratios of the equipment-support system are known, a closed-form solution in terms of these parameters can enable the estimation of the
that match the results of time history analyses. Wherever possible, depending on the combination of the mass ratio and frequency ratio, simplifications are made to the closed-form closed-formulations. The simplified models are validated with respect to the complete