ISSN (Online) : 2319 - 8753
ISSN (Print) : 2347 - 6710
I
nternationalJ
ournal ofI
nnovativeR
esearch inS
cience,E
ngineering andT
echnologyAn ISO 3297: 2007 Certified Organization, Volume 2, Special Issue 1, December 2013
Proceedings of International Conference on Energy and Environment-2013 (ICEE 2013)
On 12th to 14th December Organized by
Department of Civil Engineering and Mechanical Engineering of Rajiv Gandhi Institute of Technology, Kottayam, Kerala, India
STUDY ON THE EFFECT OF HOOK LENGTH IN
RC COLUMN SUBJECTED TO
CYCLIC LOADING
Gopika Mohan, Prof. D. C. Mitra, Dr. Bindhu K. R.
M. Tech. scholar, Department of Civil Engineering, College of Engineering, Trivandrum, Kerala, 695016 India
Associate Professor, Department of Civil Engineering, College of Engineering, Trivandrum, Kerala, 695016 India Associate Professor, Department of Civil Engineering, College of Engineering, Trivandrum, Kerala, 695016 India
ABSTRACT
Reinforced concrete columns have to be designed and detailed adequately to resist both gravity and lateral loads. Transverse reinforcements in columns in the form of hoops, cross-ties, or spirals play an important role in safeguarding the columns, especially when they are subjected to strong earthquakes or accidental lateral loads. They are required in any column-whether they are parts of a moment resistant frame or the gravity system in order for them to deform laterally and provide the required ductility. As per IS:13920-1993, a 135° hook with 10 diameter extension at each end that is embedded in the confined core is recommended in all reinforced concrete structures located in seismic zone III, IV and V which are highly prone to earthquake. The objective of this work is to carry out experimental investigation by reducing the hook length from 10d to 8d and 6d and to study the behaviour of columns. Studies are conducted to determine the load carrying capacity and energy dissipation of the required specimens and results were discussed.
1. INTRODUCTION
Ductility of a structure is its capacity to undergo large inelastic deformations without significant loss of strength or stiffness. It is the capacity to absorb energy by deforming into inelastic range. This capacity of the structures to absorb energy with acceptable deformations and without failure is a desirable characteristic in any earthquake resistant design [5,7]. Thus ductility should be guaranteed for the safety design of any structure subjected to unexpected and/or reversal loads since plastic hinges may develop in columns of reinforced concrete buildings, especially in column-foundation joints.
area(zone III)[3]. The IS 13920 emphasis the same conditions for seismic detailing of frame members and shear walls regardless of the level of seismic hazard. This needs to be rationalized. It may be possible to simplify some of the ductile detailing in zone III [1, 2, 5]. Ductile detailing requires substantially higher effort in design, construction, and quality control. Hence it is desirable to have the option for zone III to provide lower level of ductility.
IS 13920 recommends a 135° hook with 10d extension (d-diameter of lateral reinforcement) at each end that is embedded in the confined core of R.C. columns.
2.OBJECTIVE
The objectives of the study are to check whether the IS:13920-1993 recommended hook length, for lateral ties of RC columns, of 10d can be optimized to 8d and 6d, by evaluating the performance of these columns subjected to quasi static reverse cyclic loading.
3.EXPERIMENTAL SETUP
The methodology involves analyzing an exterior column in a multi-storeyed building located in seismic zone III and determining the design moments and axial forces[3,4,5], material testing, preparation of mix design and designing the specimens as per IS 456:2000 and IS 13920[4,5]. The mix proportion was 1:1.36:2.7 with water cement ratio of 0.44. Testing of specimens was done in a self-straining testing frame.
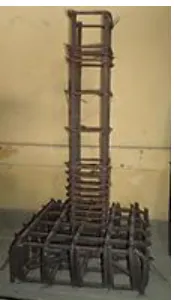
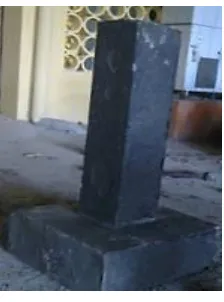
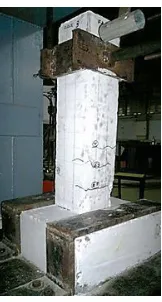
Figure 1 and 2 shows the reinforcement cage of the column specimen and specimen after casting respectively. Table 1 shows the specimen designation. The scale down size of column is 150 mmX150 mmX500 mm and stub size is 400 mmX400 mmX150 mm. All the specimens were reinforced with 4 no: of 12 mm bar as main reinforcement and 2 legged 6 mm lateral ties at 12 mm c/c for specimens with ductile detailing and at 100 mm for specimen without ductile detailing.
FIGURE 1. REINFORCEMENT DETAILING
FIGURE 2. SPECIMEN AFTER CASTING FIGURE 3. SCHEMATIC DIAGRAM OF EXPERIMENTAL SET UP
TABLE 1. SPECIMEN DESIGNATION
Sl. No. Specimen name Details
1 CNDD Column without ductile
detailing
2 CDD10 Specimen with hook
length 10d
(Control specimen)
3 CDD8 Specimen with hook
length 8d
4 CDD6 Specimen with hook
length 6d
After 28 days curing, the specimens were tested in the 2000 kN capacity self-straining testing frame. A schematic diagram of experimental setup is shown in Fig.3. Loading was done with push and pull hydraulic jack with the test set up in the Laboratory as shown in
FIGURE 4. EXPERIMENTAL SET UP IN FIGURE 5. LOADING HISTORY OF CYCLIC
4. RESULTS AND DISCUSSIONS
The test results are presented in the form of load-displacement hysteresis loop, load-deflection envelope, energy dissipation capacity and cracking patterns. The observations made during test are discussed as follows.
Hysteresis Curve
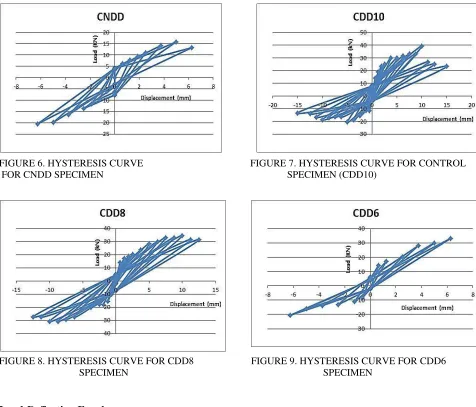
The load-displacement hysteresis loops for the specimens are shown in Figure 6, 7, 8 and 9. Hysteretic loops show the performance of column under cyclic loading. The area under the curve denotes the potential energy stored in the structure at the maximum displacement position. The Hysteresis behaviour of reinforced concrete is characterized by the rounding and pinching of the loops. The wider the loops, the larger will be the energy dissipation capacity and better will be the seismic performance.
FIGURE 6. HYSTERESIS CURVE FIGURE 7. HYSTERESIS CURVE FOR CONTROL
FOR CNDD SPECIMEN SPECIMEN (CDD10)
FIGURE 8. HYSTERESIS CURVE FOR CDD8 FIGURE 9. HYSTERESIS CURVE FOR CDD6
SPECIMEN SPECIMEN
Load-Deflection Envelope
FIGURE 10. LOAD-DEFLECTION ENVELOPES
Energy Dissipation Capacity
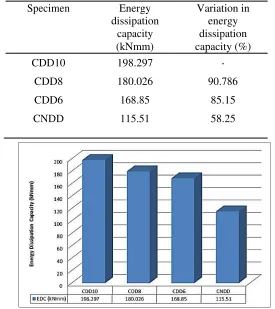
As a measure of the dissipated energy of the specimens, the area under the full load displacement envelope was computed and defined as the energy that could be dissipated by the specimens before the system lost its stability. Table 2 summarises the details of energy dissipation capacity of the specimens. Figure 11, 12 and 13 shows comparison of energy dissipation capacity, ultimate deflection and ultimate load carrying capacity of various specimens respectively.
TABLE 2. ENERGY DISSIPATION CAPACITY OF TESTED SPECIMENS
Specimen Energy Variation in
dissipation energy
capacity dissipation
(kNmm) capacity (%)
CDD10 198.297 -
CDD8 180.026 90.786
CDD6 168.85 85.15
CNDD 115.51 58.25
FIGURE 12. COMPARISON OF ULTIMATE DEFLECTION OF SPECIMENS
FIGURE 13. COMPARISON OF ULTIMATE LOAD CARRYING CAPACITY OF SPECIMENS
Cracking Patterns
The cracking patterns of the test specimens are shown in Fig.14, 15, 16 and 17.
For the control specimen CDD10 and specimen CDD8 first crack was observed during seventh cycle of loading. The first crack for specimen with hook length 6d was found to develop during fifth cycle of loading, while the specimen with non-ductile detailing CNDD first crack was developed during fourth cycle of loading. Both the control specimen and specimen with reduced hook length of 8d showed similar crack pattern.
FIGURE 15. FAILURE PATTERN OF CDD8 FIGURE 16. FAILURE PATTERN OF CDD6
FIGURE 17. FAILURE PATTERN OF CNDD
5. CONCLUSIONS
After testing the specimens under reverse cyclic loading and comparing the performance of the specimens, the following conclusions are drawn. The performance of specimen with hook length 8d was similar to that of specimen with hook length 10d (control specimen). The energy dissipation of specimen with 8d hook length was 90.786% that of specimen with 10d hook length, whereas for specimen with 6d hook length and without ductile detailing it were 85.15% and 58.25%, respectively than that of control specimen. The ultimate deflection of specimen with 8d hook length was also similar to that of control specimen. Hence, it can be concluded that the ductility was improved and hook length can be reduced from 10d to 8d in regions of moderate seismicity.
REFERENCES
[1] Alpa Sheth, 2003. “Use of intermediate RC moment frames in moderate seismic zones”, The Indian concrete Journal, November, pp. 1431-1435.
[2] Inproceedings, 2007. “Influence of Response Reduction Factor in detailing of R.C Beam-column joints”. Proceedings of International Conference on recent developments in Structural Engineering-(RDSE-2007), Bindhu, K.R., and Jaya, K.P., Manipal Institute of Technology, Manipal, pp. 1021-1028.
[3] IS 1893 (Part I):2002, “Indian Standard criteria for earthquake resistant design of structures”, Bureau of Indian Standards, New Delhi, India.
[4] IS 456:2000, “Indian Standard Plain and Reinforced Concrete Code of Practice”, Bureau of Indian Standards, New Delhi, India.
[5] Jain, and Murthy, 2005. “Proposed Draft Revisions and Commentary on Indian Seismic code IS 1893(Part I)”, IITK-GSDMA Project on building codes, IIT, Kanpur.
[6] P. Lukkunaprasit, T. Tangbunchoo and K. Rodsin, 2011. “Enhancement of seismic performance of reinforced concrete columns with
buckling-restrained reinforcement” Engineering Structures, Vol. 33, pp. 3311–3316