ISSN (Online) : 2319 - 8753
ISSN (Print) : 2347 - 6710
I
nternationalJ
ournal ofI
nnovativeR
esearch inS
cience,E
ngineering andT
echnologyAn ISO 3297: 2007 Certified Organization, Volume 2, Special Issue 1, December 2013
Proceedings of International Conference on Energy and Environment-2013 (ICEE 2013)
On 12th to 14th December Organized by
Department of Civil Engineering and Mechanical Engineering of Rajiv Gandhi Institute of Technology, Kottayam, Kerala, India
WALL ROUGHNESS EFFECTS ON SHOCK BOUNDARY
LAYER INTERACTION FLOWS
Arun Kumar R, H.D Kim
Research Scholar, IIT Madras Chennai, Tamilnadu, India
Professor, Andong National University Andong, South Korea
ABSTRACT
Shock boundary layer interaction flow features are encountered in many high speed engineering devices such as turbine blades, air wings, intake systems for ram jet engines, etc. In the past, much works have been performed to investigate the shock boundary layer interaction characteristics and various interesting conclusions like boundary layer thickening, boundary layer separation and reattachment, shock unsteadiness, etc were derived. These findings are mainly obtained for flow over smooth surfaces. The local flow states induced by shock boundary layer interaction can strongly depend on the wall surface roughness but no detailed investigations were carried out in this regard. In the present study, numerical simulations were used to investigate the flow characteristics produced by the interaction of shock wave on boundary layer over a rough wall. The variations in interaction length, characteristics of separation bubble and shock strength for roughened wall were compared to that of smooth wall case. The results show that shock strength decreases for rough wall simulation compared to smooth wall simulation. The shock location moves upstream as the wall roughness increases. Flow separation - reattachment distance decreases for a rough wall compared to smooth wall case mainly due to the decrease in pressure gradient across the shock. The rough wall produce much higher turbulent kinetic energy along the wall surface and this cause the flow variations to propagate more distance downstream of the shock position.
NOMENCLATURE
Cf Skin Friction Coefficient Cp Pressure Coefficient
E Energy (J/Kg)
Ks Physical Roughness Height
ks +
Non Dimensional Roughness Height M Mach No
P Pressure (Pa)
T Temperature (K)
U Velocity (m/s)
u+ N on Dimensional Velocity uτ Shear Velocity
y+ Non-Dimensional Distance from Wall
1. INTRODUCTION
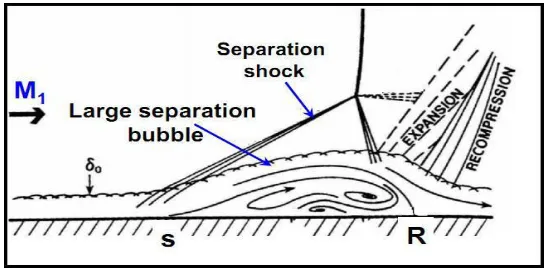
Shock boundary layer interaction is one of the classical problems involved in shock wave dynamics which was well studied and documented in the past [1-3]. Shock wave interaction on the boundary layer causes many salient features on the local as well as the whole flow field such as flow separation and reattachment, boundary layer thickening, shock unsteadiness etc. A schematic diagram as shown in Figure.1 clearly explains the local variation of the flow field near the interaction region of shock wave.
FIGURE . 1 SCHEMATIC DIAGRAM OF SHOCK BOUNDARY LAYER INTERACTION [REF.1].
These interaction effects widely depend on the upstream flow parameters. Kooi [4] observed that as the upstream Mach number increases the separation bubble, caused by the shock wave interaction on boundary layer, grows. Another important parameter on which the shock boundary layer interaction depends is the incoming boundary layer characteristics. In wall bounded supersonic flows, the boundary layer region very near to the wall exhibits a subsonic flow and through this region the pressure rise information produced by shock wave will be passed to the upstream side. This eventually causes thickening of boundary layer. The subsonic region produced by a turbulent boundary layer is much smaller than that produced by a laminar boundary layer. This cause stronger separation region for laminar boundary layer compared to turbulent boundary layers.
Shock waves are also commonly seen in many transonic aerodynamic applications such as turbo machinery systems, aircrafts wing etc. Even though the flow being transonic, shock waves are produced in majority of these applications mainly when the flow passes through aerodynamic shapes such as a bump or an aerofoil used in such devices. Transonic boundary layer separation produced on an axisymmetric bump model was studied by Bachalo et al [5]. Their experimental data’s provided ample
information regarding the shear stress variation from the interaction region to the reattachment position. An experimental study on the shock boundary layer interaction in an aerofoil of circular bump shape was carried out by Liu et al [6]. Their experiment given greater insight regarding the flow separation characteristics over transonic bump flows. They pointed out that as the shock strength increases the flow separation and reattachment effects also increases.
logarithmic wall law, which is used to model the near wall fluid layer, will show discrepancies with the addition of wall surface effects. The effect of surface roughness on the flow characteristics in the turbulent boundary layer was studied in detail by Akinlade et al [7]. They formulated a modified wall law to include theroughness effects. They also pointed out that the surface roughness enhances the turbulence kinetic energy. The effect of supersonic flow features over a rough flat plate was studied by Babinsky et al [8]. They observed that the wall surface have a prolonged influence to the far downstream flow also. Inger et al [9] did an experimental analysis on a transonic circular bump with different roughness values to study the effect of roughness parameter on shock boundary layer interaction flow field. They observed that an increase in wall surface roughness causes reduction in shock strength.
Even though much of the flow features associated with shock turbulent boundary layer interaction problems are well understood, the effect of surface roughness on such flow fields are not yet properly studied. In this paper a 2-D CFD method was employed to investigate the effects of surface roughness on the shock boundary layer interaction flow field. The CFD simulations were carried out on circular arc bump geometry with dimensions same as that used in the experimental study conducted by Inger. The present study mainly focuses to have a detail understanding about the variations in shock bounder layer interaction flow features like shock strength, flow separation, interaction distance etc. under the influence of rough wall. The accuracy of different turbulence models in predicting shock boundary layer interaction flows subjected to rough wall were also compared.
2.CFD ANALYSIS
2.1Computational Model
A 2-D circular bump geometry with dimensions identical to that of Inger’s experimental model was used for the present simulation. The width of the computational domain is 190 mm. The details of the computational domain are shown in Figure.2.
2.2 Mesh Independence Study
FIGURE.3 NORMALIZED STATIC TEMPERATURE DISTRIBUTIONS ALONG CENTER LINE FOR DIFFERENT GRIDS.
The domain was discretized using structured quadrilateral cells with clustering of cells close to the wall. A grid independence study was carried out to arrive at an optimum mesh size. The operating and boundary conditions for the mesh independence study were taken as same as that of Case-a shown in Table.1. Figure.3 shows the temperature variation along the center line for the simulations with four different grid sizes. It was observed that the final grid system with number of cells of 1400x125 does not show considerable variation from the previous and hence considered for the analysis.
2.3 Governing Equations and Numerical Schemes
The flow properties variations are calculated by solving the compressible form of conservation equations for continuity, momentum and energy equations in two dimensional co ordinate system. For modeling the turbulence, SST k-ω model, which is basically a RANS based method, was used. The working gas density variation is modeled using ideal gas equations and to account for the variation in viscosity with respect to temperature, Sutherland approach was used. Roe-FDS method was used for the discretization of flux components in the governing equation. The cell centred solutions are extrapolated to the face centres by using second order schemes. The governing flow equations were solved in the coupled form using commercial solver, Fluent.
Most of the turbulence model uses the wall function correlations to resolve the roughness effects. The turbulence models like k-epsilon and Reynolds stress model uses wall functions to resolve the viscous sub layer flows. In these turbulence models an additional roughness coefficient, depending upon the roughness height and type, is added to the log wall function model which in turn causes a downward shift in the velocity profile. The modified wall log law is shown in Eq.1 and Eq.2.
2.4 Governing Equations and Numerical Schemes
In this section, the accuracy of different turbulence model in predicting the surface roughness effect on shock boundary layer interaction flow field was compared. Three different cases with same boundary conditions but with different turbulence models, case c as shown in Table.1, were simulated and are compared with the experimental results obtained by Inger. The experimental study by Inger was carried out with upstream conditions of 0.4 bar stagnation pressure (gauge value), free stream Mach No. of 0.73, inlet stagnation temperature of 310 k and Reynolds number based on model chord of 1.76 x 10⁶. The present computational study also used the same inlet conditions as that of the experiment. In the experiment the back pressure was varied using a throat to control the shock position and the value of the back pressure was not specified. For the present computational study, several initial simulations were carried out to obtain the required back pressure value, 98 kPa, which can predict the shock location same as that of the experiment.
FIGURE.4 PRESSURE COEFFICIENT COMARISONS PREDICTED BY DIFFERENT TURBULENCE MODELS ALONG THE BUMP SURFACE WITH ROUGHNESS HEIGHT (H)=580 µ M.
viscous sub layer with the outer turbulent layer.
For the present study with Realizable k-ε and RSM turbulence models, the free stream y+ value was maintained with in a value of 40, which is well outside the buffer zone. It can be noticed that the SST k-ω turbulence model predicts the roughness effects on shock boundary layer interaction flows more reasonably compared to the wall function based Realizable k-ε and Reynolds Shear Stress (RSM) models. The numerical result also shows that downstream of the shock front the pressure coefficient values are little over predicted by all turbulence models. This may be because of the non equilibrium effects associated with the shock front.
3. RESULTS AND DISCUSSION
For the present study, the disparities in flow characteristics that can happen to shock boundary layer interaction problems under rough wall condition were investigated in detail. Four cases with different wall roughness size were simulated and the boundary condition details are shown in Table.1. For all the cases turbulence modeling was done using SST k-ω model.
TABLE.1 COMPUTATIONAL CONDITIONS FOR THE PRESENT CFD STUDY
Inlet Outlet
Roughness Case Total Static
size (h) in µ m
Pressure Pressure
a 142 kPa 98 kPa 0
b 142 kPa 98 kPa 250
c 142 kPa 98 kPa 580
d 142 kPa 98 kPa 1470
Fig.5 shows the pressure coefficient comparison for smooth and rough walls along the bump surface. It can be noticed from the figure that as the wall roughness increases, the shock location moves upstream of the bump. Shock locations are identified as the point where the static pressure value starts to rise abruptly. From Fig.5, it can also be observed that the pressure coefficient data upstream to the shock front shows some variation as wall surface roughness increases. This may due to the fact that as surface roughness increases the subsonic part of the boundary layer also increase which in turn enhances the shock induced pressure rise data transmission to the upstream direction. Thus for rough walls a more prominent upstream influence is observed compared to a smooth wall, which can be clearly visualized from Fig.5.
The roughness effect can significantly affect the supersonic flow acceleration in the divergent part of the bump. As the roughness height increases the mean flow acceleration across the divergent bump section will be reduced due to the elevated wall friction effects. Generally, in a diverging supersonic flow section, shock front location is such that the downstream static pressure matches with the outlet static pressure condition. Since for a roughened wall the static pressure just behind the shock will be increased due to the flow speed reduction, lower shock strength is required to elevate the static pressure to the required level. This is the main reason for the upstream shift in shock location for a rough wall compared to smooth wall.
FIGURE.6 SHOCK STRENGTH (P2/P1) COMPARISONS FOR DIFFERENT ROUGHNESS HEIGHT
CASES
Fig.6 shows the shock strength variation for simulations with different surface roughness height values. The shock strength is defined as the ratio of downstream static pressure (P2) to the upstream static
pressure (P1) across the shock front. From Fig.6 it can be clearly observed that the shock strength reduces
as the wall roughness height increases.
FIGURE.7 WALL SHEAR STRESS DISTRIBUTIONS ALONG THE BUMP SURFACE FOR DIFFERENT ROUGHNESS HEIGHT CASES.
roughness effects. But there may be a critical roughness value for the separation onset. With thin boundary layer in incoming flow, the surface roughness will lead to larger turbulent shear stresses that have more resistance potential against boundary layer separation. But when the boundary layer thickens in the incoming flow, the roughness does not lead to more resistance in separation. Thus the y+ value will be very important to access the roughness effects.
4.CONCLUSIONS
In the present study, the surface roughness effect on the turbulent shock boundary layer interaction flows in transonic circular bump geometry was investigated using computational techniques. The accuracy of different turbulence models in predicting the surface roughness effect on shock boundary layer interaction flows was investigated. It was found that the SST k-ω model, which uses the enhanced wall treatment, predicts the pressure fluctuation along the rough bump surface more accurately compared to the experimental results. As the wall roughness height increases the shock strength decreases. This is mainly due to the decrease in flow acceleration produced by the additional frictional effects. As a result of this the shock location moves upstream as the wall surface height value increases. The upstream influence length also increases with increase in surface roughness. The flow separation re attachment distance for smooth wall simulation shows higher value compared to rough wall simulations. This is mainly due to fact that the adverse pressure gradient required for the flow separation decreases with increase in surface roughness. The flow variations downstream to the shock front are propagated to a much higher distance for rough walls compared to smooth walls. The turbulent kinetic energy along the bumps surface increases with increase in surface roughness and this will increase the flow variation region downstream to the shock.
REFERENCES
[1] Babinsky, H., Harvey, J, K.., 2011. Shock wave-boundary-layer interactions. Cambridge University Press, UK.
[2] Andreopoulos, Y., Agui, J. H., Briassulis, G., 2000. “Shock wave-turbulence interactions”. Ann. Rev. Fluid Mech, 32, pp. 309–345.
[3] Dolling, D, S., 2001. “Fifty years of shock-wave/boundary-layer interaction research: What next”. AIAA, 39, pp. 1517–1531.
[4] Kooi, J, W., 1978. Influence of free-stream Mach number on transonic shock-wave boundary layer interaction. Report, National Aerospace Laboratory, Netherland, May.
[5] Bachalo, W,D, Johnson, D, A., 1986. “Transonic turbulent boundary layer separation generated on an axisymmetric flow model”. AIAA,
21, pp. 437–443.
[6] Liu, X, Squire, L, C., 1988. “An investigation of shock/boundary layer interactions on curved surfaces at transonic speeds”. J. Fluid Mechanics, 187, pp. 467–486.
[7] Akinlade, O, G., 2005. “Effects of surface roughness on the flow characteristics in a turbulent boundary layer”. PhD Thesis, University of Saskatchewan, Canada.
[8] Babinsky, H., Inger, G, R and McConnel, A.D., 1999. “A Basic Experimental/Theoretical Study of
Rough Wall Turbulent Shock/Boundary Layer Interactions”. Proceedings of the 22nd International Symposium on Shock Waves, London,
U.K.
[9] Inger, G.R., and Gendt, C., 1997. “An Experimental
Study of Transonic Shock/ Boundary Layer Interaction on a Roughened Surface”. 35th AIAA Aerospace Science Meeting and Exhibit,