238 |
P a g e
PERFORMANCE ANALYSIS OF STUDENTS
CONSUMING ALCOHOL USING DATA MINING
TECHNIQUES
1
Saurabh Pal,
2Vikas Chaurasia
1,2 Dept. of MCA,VBS Purvanchal University, Jaunpur, UP, (India)
ABSTRACT
Alcohol consumption in higher education institutes is not a new problem; the legal drinking age in the India is minimum 18 year, but heavy drinking by underage students and by those who are age 18 or older is dangerous, and disruptive. Excessive drinking among students is associated with a variety of negative consequences that include fatal and nonfatal injuries; alcohol poisoning; blackouts; academic failure; violence, including rape and assault; unintended pregnancy; sexually transmitted diseases, including HIV/AIDS; property damage; and vocational and criminal consequences that could jeopardize future job prospects. Because students vary widely in their drinking rates, it would be inaccurate to characterize all institutions as having an equally urgent drinking problem. But among students who do drink heavily, the problem is serious: the two out of five students who engage in binge drinking risk a wide range of alcohol-related consequences, including grave injuries and death.
This paper describes four popular data mining algorithms Sequential minimal optimization (SMO), Bagging, REP Tree and decision table (DT) extracted from a decision tree or rule-based classifier to improve the efficiency of academic performance in the educational institutions for students who consume alcohol. In this paper, we present a real-world experiment conducted at VBS Purvanchal University, Jaunpur, India. This method helps to identify the students who need special advising or counseling by the councilors/teachers to understand the danger of consuming alcohol.
Keywords: Alcohol Consumption, Sequential Minimal Optimization (SMO), Bagging, REP Tree,
Decision Table.
I INTRODUCTION
India is the third largest market for increase of alcoholic beverages in the world, after Russian Federation and
Estonia. During 1992-2012, the per capita consumption of alcohol in India has increased by whopping 55%.
(Source: The Indian Express). Heavy drinking is associated with a weaker probability of employment, more absence
from work, as well as lower productivity and wages. The overall value of production lost to harmful alcohol use is
estimated in the region of 1% of GDP in high- and middle-income countries. Globally, alcohol consumption results
in approximately 3.3 million deaths each year (WHO Global Status Report on alcohol and health, 2014). It is the
third largest risk factor for disease and disability in the world. In 2010 it was responsible for 4.9 million deaths and
239 |
P a g e
risk factor for death among the economically and socially productive age group of 15-49 year old men, it has graveimplications in terms of a society’s over all development.
According to WHO, about 30% of Indians consume alcohol, out of which 4-13% are daily consumers and up to 50%
of these, fall under the category of hazardous drinking. Another worrying trend from India is that the average age of
initiation of alcohol use has reduced from 28 years during the 1980s to 17 years in 2007. In India alcohol abuse also
amounts to huge annual losses due to alcohol-related problems in work places. Nearly 25% of the road accidents are
under the influence of alcohol and it is also a significant risk factor for increased domestic violence.
In many institution campuses, heavy drinking is interwoven overtly or subtly throughout the culture of the institution
[1]. As a result, students perceive this drinking pattern as the social norm rather than as unhealthy and potentially
destructive behavior. Research consistently shows that there is no one cause of excessive alcohol use by college
students, and the Panel thought that it would be naive and misleading to adopt a simplistic view of, or approach to,
this problem.
College student drinking is the product of many factors working together. Among them are [2]:
student's sex, student's age, parent's cohabitation status, parent's education, parent's job, number of past
class failures, family educational support, extra-curricular activities, Internet access at home, with a romantic
relationship, quality of family relationships.
Student’s value systems and personalities;
Students’ expectations regarding alcohol’s effects (whether good or bad);
Genetic predisposition, often reflected in a family history of alcoholism;
Roles and influence of family background and peers;
Social integration of drinking into college life;
Social context in which drinking takes place (e.g., on-or off-campus parties, on-or off-campus bars);
Marketing mechanisms such as reduced-price drink specials and promotional efforts;
Economic availability of alcohol, including its retail price and the amount of students’ disposable income;
Legal availability of alcohol;
Social and institutional structures, including law enforcement; and Public policy [3].
The ability to predict a student’s performance is very important in educational environments. Students’ academic
performance is based upon diverse factors like personal, social, psychological and other environmental variables. A
very promising tool to attain this objective is the use of Data Mining. Data mining techniques are used to
operate on large amount of data to discover hidden patterns and relationships helpful in decision making.
This study investigates and compares the educational domain of data mining from data that come from students
240 |
P a g e
the knowledge discover from the student database for improving the student performance. Here by, data miningtechniques including Sequential minimal optimization (SMO), Bagging, REP Tree and decision table (DT).
II BACKGROUND AND RELATED WORK
Rapid growth of population in recent years, the increasing demand for education has led to more Universities/
Institutions being formed. Due to the rapid development, alcohol use has become common among students in
campus and is even affecting their performances in class. Despite the worldwide concern and education about the
alcohol abuse, most of the students have limited knowledge of how dangerous the habit is [4]. Many students have
dropped out from institutions, the young generation no longer has role models since most of the young Adults are
unemployed and under the influence of this drugs and alcohol [5].
Although, students are expected to be aware of the effects of drug abuse and commit themselves to their studies, the
habit still exist default of their prior expected awareness of its consequences.
This study therefore, seeks to establish the correlation between poor academic performance and the use of alcohols
in college campus. The research will also assess the various reasons as to why students abuse drugs and alcohols.
Behavior is a major aspect of life, after observing students behavior when under the influence of this drugs and
alcohols this research will recommend ways of rehabilitating those already affected and ways of eradicating drug
peddling business going on at our Universities. The research will also propose policy recommendations to
mainstream drug related projects to secure students’ rights to education and the entire young generation [6].
Study on the student dropout rate by selecting 1650 students from different branches of engineering college. In their
study, it was found that student’s dropout rate in engineering exam, high school grade; senior secondary exam grade, family annual income and mother’s occupation were highly correlated with the student academic performance [7].
A decision tree model to predict the final grade of students who studied the C++ course in Yarmouk University,
Jordan in the year 2005. Three different classification methods namely ID3, C4.5, and the NaïveBayes were used.
The outcome of their results indicated that Decision Tree model had better prediction than other models [8].
A study using classification tree to predict student academic performance using students’ gender, admission type,
previous schools marks, medium of teaching, location of living, accommodation type, father’s qualification, mother’s qualification, father’s occupation, mother’s occupation, family annual income and so on. In their study,
they achieved around 62.22%, 62.22% and 67.77% overall prediction accuracy using ID3, CART and C4.5 decision
tree algorithms respectively [9].
In another study [10] used students’ attendance, class test grade, seminar and assignment marks, lab works to predict
students’ performance at the end of the semester with the help of three decision tree algorithms ID3, CART and
241 |
P a g e
2.1
Data Mining Techniques
Classification is the process of finding a set of models or functions that describe and distinguish data classes or
concepts, for the purpose of being able to use the model to predict the class of objects whose class label is unknown.
The derived model is based on the analysis of a set of ―training data‖ – data objects whose class label is known.
Classification and prediction are two forms of data analysis that can be used to extract models describing important
data classes or to predict future data trends. Data classification is a two-step process.
A. Sequential Minimal Optimization (SMO)
SMO implements the sequential minimal optimization algorithm for training a support vector classifier, using
polynomial or Gaussian kernels [11]. Missing values are replaced globally, nominal attributes are transformed into
binary ones, and attributes are normalized by default—note that the coefficients in the output are based on the
normalized data. Normalization can be turned off, or the input can be standardized to zero mean and unit variance.
Pair wise classification is used for multiclass problems. Logistic regression models can
be
fitted to the supportvector machine output to obtain probability estimates. In the multiclass case the predicted probabilities will be
coupled pair wise. When working with sparse instances, turn normalization off for faster operation. SMOreg
implements the sequential minimal optimization algorithm for regression problems.
B. Bagging
The concept of bagging (voting for classification, averaging for regression-type problems with continuous
dependent variables of interest) applies to the area of predictive data mining, to combine the predicted classifications
(prediction) from multiple models, or from the same type of model for different learning data. It is also used to
address the inherent instability of results when applying complex models to relatively small data sets. Suppose data
mining task is to build a model for predictive classification, and the dataset from which to train the model is
relatively small. We could repeatedly sub-sample (with replacement) from the dataset, and apply, for example, a tree
classifier (e.g., CART and CHAID) to the successive samples. In practice, very different trees will often be grown
for the different samples, illustrating the instability of models often evident with small datasets. One method of
deriving a single prediction (for new observations) is to use all trees found in the different samples, and to apply
some simple voting: The final classification is the one most often predicted by the different trees.
C. REP Tree
Rep Tree uses the regression tree logic and creates multiple trees in different iterations. After that it selects best one
from all generated trees. That will be considered as the representative. In pruning the tree the measure used is the
mean square error on the predictions made by the tree.
Basically Reduced Error Pruning Tree ("REPT") is fast decision tree learning and it builds a decision tree based on
the information gain or reducing the variance. REP Tree is a fast decision tree learner which builds a
242 |
P a g e
only sorts values for numeric attributes once. Missing values are dealt with using C4.5’s method of using fractionalinstances. The example of REP Tree algorithm is applied on UCI repository and the confusion matrix is generated
for class gender having six possible values. [12] [13] [14]
D. Decision table (DT)
There is one type of classifier for which scheme-specific attribute selection is an essential part of the learning
process: the decision table [15]. The entire problem of learning decision tables consists of selecting the right
attributes to include. Usually this is done by measuring the table’s cross-validation performance for different subsets
of attributes and choosing the best-performing subset. Fortunately, leave-one-out cross-validation is very cheap for
this kind of classifier. Obtaining the cross-validation error from a decision table derived from the training data is just
a matter of manipulating the class counts associated with each of the table’s entries, because the table’s structure doesn’t change when instances are added or deleted. The attribute space is generally searched by best-first search
because this strategy is less likely to become stuck in a local maximum than others, such as forward selection.
III DATA MINING PROCESS
In this study, data gathered from MCA Department of VBS Purvanchal University, Jaunpur, India. These data are
analyzed using data mining techniques to predict the student’s performance. In order to apply this technique following
steps are performed in sequence:
A. Data Preparations
The data set used in this study was obtained from MCA Department on the sampling method for MCA (Master of
Computer Applications) course from session 2010-11 to 2015-16. Initially size of the data is 200. In this step data
stored in different tables was joined in a single table after joining process errors were removed.
B. Data selection and transformation
In this step only those fields were selected which were required for data mining. A few derived variables were
selected. While some of the information for the variables was extracted from the database. All the predictor and
response variables which were derived from the database are given in Table I for reference.
TABLE 1
Student Related Variables
Attribute Domain
school student's school (binary: "GP" - Gabriel Pereira or "MS" - Mousinho da Silveira) sex student's sex (binary: "F" - female or "M" - male)
age student's age (numeric: from 15 to 22)
address student's home address type (binary: "U" - urban or "R" - rural)
243 |
P a g e
Medu mother's education (numeric: 0 - none, 1 - primary education (4th grade), 2 – 5th to 9th grade, 3
– secondary education or 4 – higher education)
Fedu father's education (numeric: 0 - none, 1 - primary education (4th grade), 2 – 5th to 9th grade, 3 –
secondary education or 4 – higher education)
Mjob mother's job (nominal: "teacher", "health" care related, civil "services" (e.g. administrative or police), "at_home" or "other")
Fjob father's job (nominal: "teacher", "health" care related, civil "services" (e.g. administrative or police), "at_home" or "other")
reason reason to choose this institution (nominal: close to "home", school "reputation", "course" preference or "other")
guardian student's guardian (nominal: "mother", "father" or "other")
traveltime home to school travel time (numeric: 1 - <15 min., 2 - 15 to 30 min., 3 - 30 min. to 1 hour, or 4 - >1 hour)
studytime weekly study time (numeric: 1 - <2 hours, 2 - 2 to 5 hours, 3 - 5 to 10 hours, or 4 - >10 hours) failures number of past class failures (numeric: n if 1<=n<3, else 4)
schoolsup extra educational support (binary: yes or no)
famsup family educational support (binary: yes or no)
activities extra-curricular activities (binary: yes or no)
higher wants to take higher education (binary: yes or no)
internet Internet access at home and Institute(binary: yes or no)
romantic with a romantic relationship (binary: yes or no)
famrel quality of family relationships (numeric: from 1 - very bad to 5 - excellent)
freetime free time after institution (numeric: from 1 - very low to 5 - very high)
goout going out with friends (numeric: from 1 - very low to 5 - very high)
Dalc workday alcohol consumption (numeric: from 1 - very low to 5 - very high)
Walc weekend alcohol consumption (numeric: from 1 - very low to 5 - very high)
health current health status (numeric: from 1 - very bad to 5 - very good)
absences number of absences (numeric: from 0 to 93)
G1 first year grade (numeric: from 1 to 3) {1. First ≥ 60% 2. Second ≥ 45 & <60% 3. Fail< 45%}
G2 second year grade (numeric: from 1 to 3)
G3 final year grade (numeric: from 1 to 3)
The target attribute G3 has a strong correlation with attributes G2 and G1. This occurs because G3 is the final year
grade (issued at the 3rd year), while G1 and G2 correspond to the 1st and 2nd year grades. It is more difficult to
predict G3 without G2 and G1, but such prediction is much more useful
C. Implementation of Mining Model
WEKA toolkit is a widely used toolkit for machine learning and data mining originally developed at the University
of Waikato in New Zealand. It contains a large collection of state-of-the-art machine learning and data mining
algorithms written in Java. WEKA contains tools for regression, classification, clustering, association rules,
visualization, and data pre-processing. WEKA has become very popular with academic and industrial researchers,
and is also widely used for teaching purposes.
To use WEKA, the collected data need to be prepared and converted to (arff) file format to be compatible with the
244 |
P a g e
D. Results and Discussion
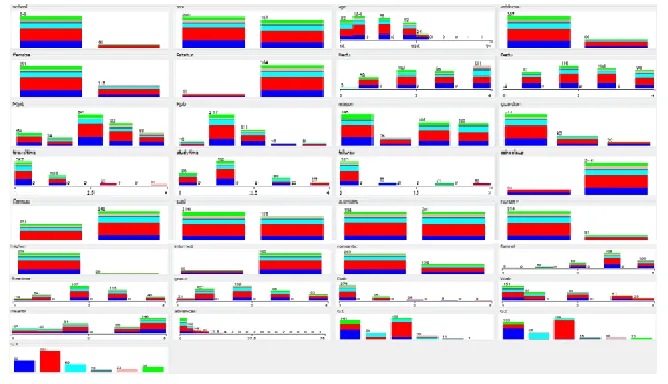
Here, we analyze alcohol consuming student’s data set visually using different attributes and figure out the
distribution of values. Figure 1 shows the distribution of values of Alcohol Consumption Student Data Set.
Figure 1: Visualization of the Students Categorization
We have carried out some experiments in order to evaluate the performance and usefulness of different classification
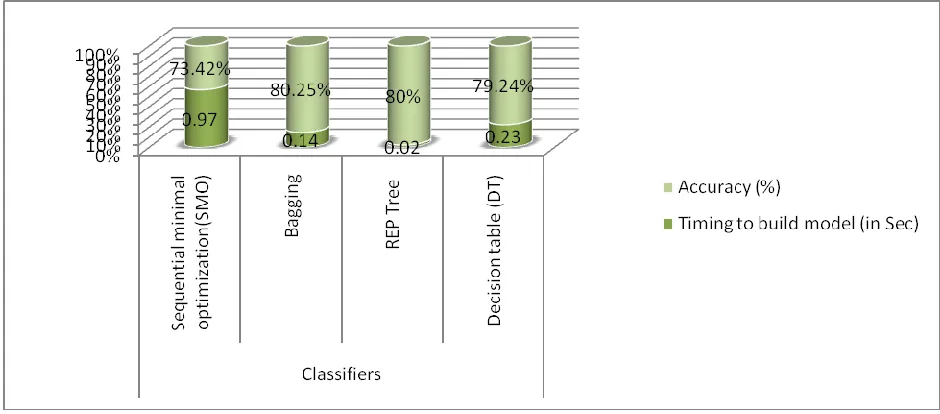
algorithms for predicting the performance of alcohol consuming students. Table 2 shows the experimental result.
Table 2
Performance of the classifiers
Evaluation Criteria Classifiers
Sequential minimal optimization(SMO)
Bagging REP Tree Decision table
(DT) Timing to build model (in
Sec)
0.97 0.14 0.02 0.23
Correctly classified instances
290 317 316 313
Incorrectly classified instances
105 78 79 82
Accuracy (%) 73.4177 % 80.2532 % 80% 79.2405%
Accuracy of classifier refers to the ability of classifier. It predicts the class label correctly and the accuracy of the
predictor refers to how well a given predictor can guess the value of predicted attribute for a new data. Figures 2 and
245 |
P a g e
Figure 2: Efficiency of different models
Here we can show that Bagging classifier has more accuracy than other classifiers. Accuracy is not really a reliable
metric for the real performance of a classifier when the number of samples in different classes vary greatly
(unbalanced target) because it will yield misleading results. The (error misclassification) rates are good
complementary metrics to overcome this problem.
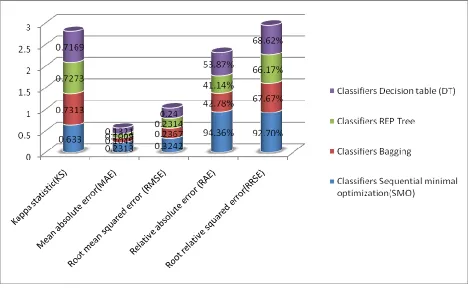
Figure 3: Efficiency of different models
Kappa statistic, mean absolute error and root mean squared error will be in numeric value only. We also show the
relative absolute error and root relative squared error in percentage for references and evaluation. The results of the
246 |
P a g e
Table 3
Training and Simulation Error
Evaluation Criteria Classifiers
Sequential minimal optimization(SMO)
Bagging REP Tree Decision table
(DT)
Kappa statistic(KS) 0.633 0.7313 0.7273 0.7169
Mean absolute error(MAE)
0.2313 0.1049 0.1009 0.1321
Root mean squared error (RMSE)
0.3242 0.2367 0.2314 0.24
Relative absolute error (RAE)
94.3629 % 42.7832 % 41.1425 % 53.8699 %
Root relative squared
error(RRSE)
92.7005 % 67.6687 % 66.1667 % 68.6169 %
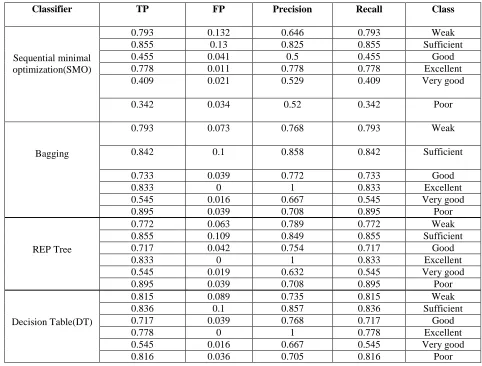
Comparison of detailed accuracy by class is shown in table 4. Figures 4 is the simulation result based on graphical
representations.
247 |
P a g e
Table 4
COMPARISON OF ACCURACY MEASURES
Classifier TP FP Precision Recall Class
Sequential minimal optimization(SMO)
0.793 0.132 0.646 0.793 Weak
0.855 0.13 0.825 0.855 Sufficient
0.455 0.041 0.5 0.455 Good
0.778 0.011 0.778 0.778 Excellent
0.409 0.021 0.529 0.409 Very good
0.342 0.034 0.52 0.342 Poor
Bagging
0.793 0.073 0.768 0.793 Weak
0.842 0.1 0.858 0.842 Sufficient
0.733 0.039 0.772 0.733 Good
0.833 0 1 0.833 Excellent
0.545 0.016 0.667 0.545 Very good
0.895 0.039 0.708 0.895 Poor
REP Tree
0.772 0.063 0.789 0.772 Weak
0.855 0.109 0.849 0.855 Sufficient
0.717 0.042 0.754 0.717 Good
0.833 0 1 0.833 Excellent
0.545 0.019 0.632 0.545 Very good
0.895 0.039 0.708 0.895 Poor
Decision Table(DT)
0.815 0.089 0.735 0.815 Weak
0.836 0.1 0.857 0.836 Sufficient
0.717 0.039 0.768 0.717 Good
0.778 0 1 0.778 Excellent
0.545 0.016 0.667 0.545 Very good
0.816 0.036 0.705 0.816 Poor
Based on the above Figures 2, 3, 4 and Table 2, we can clearly see that the highest accuracy is 80.2532 % and the
lowest is 73.4177 %. The other algorithm yields an accuracy of 79.2405% and 80%. In fact, the highest accuracy
belongs to the Bagging Classifier. The total time required to build the model is also a crucial parameter in
comparing the classification algorithm. In this simple experiment, from Table 2, we can say that a REP Tree,
Bagging and Decision Table requires the shortest time than SMO which is around 0.02, 0.14, 0.23 seconds
consecutive with compared to SMO which requires the longest model building time which is around 0.97 seconds.
Kappa statistic is used to assess the accuracy of any particular measuring cases, it is usual to distinguish between the
reliability of the data collected and their validity. The average Kappa score from the selected algorithm is around
0.7313 - 0.633. From Figure 4, we can observe the differences of errors resultant from the training of the three
selected algorithms. This experiment implies a very commonly used indicator which is mean of absolute errors and
248 |
P a g e
To better understand the importance of the input variables, it is customary to analyze the impact of input variableson the performance of the students who consume alcohol in college campus during their education, in which the
impact of certain input variable of the model on the output variable has been analyzed. Tests were conducted using
three tests for the assessment of input variables: Chi-square test, Info Gain test and Gain Ratio test. Different
algorithms provide very different results, i.e. each of them accounts the relevance of variables in a different way.
The average value of all the algorithms is taken as the final result of variables ranking, instead of selecting one
algorithm and trusting it. The results obtained with these values are shown in Table 5.
TABLE 5
RESULT OF TESTS AND AVERAGE RANK
Variable Chi-squared Info Gain Gain Ratio Average
Rank
G2(second year grade)
1068.1081 1.26572 0.63141 356.6684
G1(first year grade)
551.0932 0.75566 0.39774 184.0822
absences 112.6889 0.21266 0.24438 37.71531
failures 54.7677 0.10803 0.14565 18.34046
Fjob 26.9205 0.04624 0.02741 8.99805
Mjob 26.6383 0.04863 0.02255 8.90316
schoolsup 23.1438 0.05007 0.09022 7.761363
paid 17.6804 0.03425 0.03442 5.916357
higher 15.8998 0.03231 0.11177 5.34796
reason 15.6748 0.02888 0.01547 5.239717
romantic 13.4803 0.02762 0.03005 4.512657
guardian 8.2365 0.01722 0.01499 2.756237
address 7.4772 0.01545 0.02019 2.50428
Pstatus 5.2849 0.00913 0.01898 1.771003
internet 5.1519 0.011 0.0169 1.7266
249 |
P a g e
famsize 3.5792 0.00683 0.00788 1.19797
activities 2.5121 0.0046 0.0046 0.840433
famsup 2.2303 0.00412 0.00428 0.746233
The objective of this analysis is to determine the importance of each variable individually. Table 5 shows that
attribute G2 (second year grade) impacts output the most, and that it showed the best performances in all the above
tests. Then these attributes follow: G1 (first year grade), and so on
IV CONCLUSION
The analysis suggests that legal access to alcohol does affect student performance. In this work, we have addressed
the prediction of teenager’s alcohol addiction by using demographic, family and other data related to student,
different classifiers are studied and the experiments are conducted to find the best classifier for predicting the
performance of the students who consume alcohol. We propose an approach to predict the performance using data
mining techniques. Four classifiers such as Sequential minimal optimization (SMO), Bagging, REP Tree and
Decision table (DT) were used for diagnosis of performance of the students. Observation shows that bagging
performance is having more accuracy, when compared with other three classification methods. The best algorithm
based on the student alcohol data is Bagging Classification with accuracy of 80.2532 % and the total time taken to
build the model is at 0.14 seconds. These results suggest that among the machine learning algorithm tested, Bagging
classifier has the potential to significantly improve the conventional classification methods used in the study. We
also shows that the most important attributes which most affected the performance of students who consume the
alcohol during their study are the previous grades which is gained by students and other attributes are absence in the
class, father’s job, mother’s job, extra educational support, extra paid classes within the course subject, wants to take
higher education, reason to choose this institution and also some other attributes. These attributes were found using
three tests for the assessment of input variables: Chi-square test, Info Gain test and Gain Ratio test. The empirical
results show that we can produce short but accurate prediction list for the student’s performance by applying the
predictive models to the records of incoming new students. This study will also work to identify those students who
needed special attention.
REFERENCES
1. Abbey A. Acquaintance rape and alcohol consumption on college campuses: How are they linked? Journal of
American College Health 39(4):165–169, 1991.
2. Abbey A. Alcohol-related sexual assault: A common problem among college students. Journal of Studies on
250 |
P a g e
3. Abbey A, McAuslan P, Ross LT. Sexual assault perpetration by college men: The role of alcohol, misperception
of sexual intent, and sexual beliefs and experiences. Journal of Social and Clinical Psychology 17(2):167–195,
1998.
4. Abdool, R. (ed.2004). United Nations Office of Drugs and Crime, 2nd African Union Ministerial Conference on
Drug Control in Africa: 14-17 December 2004. Mauritius
5. Adelekan, M. (1999). Rapid Situation Assessment of the Drug Situation at Ehin – Etiri, Ijebu North Local
Government, Ogun State Nigeria. Lagosi: UNDCP
6. Altares S., Copo A., Gobuyo A., Laddaran T., Mejia L., Policarpio I., Agued G., Tizon D., Yao M. (2003)
Elementary Statistics: A Modern Approach. (2003 Ed.). (pg. 13).
7. Pal S., ―Mining Educational Data to Reduce Dropout Rates of Engineering Students‖, I.J. Information
Engineering and Electronic Business (IJIEEB), Vol. 4, No. 2, 2012, pp. 1-7.
8. Q. A. AI-Radaideh, E. W. AI-Shawakfa, and M. I. AI-Najjar, ―Mining student data using decision trees‖,
International Arab Conference on Information Technology(ACIT'2006), Yarmouk University, Jordan, 2006.
9. S. K. Yadev & Pal., S. 2012. Data Mining: A Prediction for Performance Improvement of Engineering Students
using Classification, World of Computer Science and Information Technology (WCSIT), 2(2), 51-56.
10. S. K. Yadav, B. K. Bharadwaj & Pal, S. 2011. Data Mining Applications: A comparative study for predicting
students' performance, International journal of Innovative Technology and Creative Engineering (IJITCE),
1(12).
11. Platt, J. C. (1998). Fast training of support vector machines using sequential minimal optimization. In B.
Sch¨olkopf, C. Burges,&A. Smola (Eds.), Advances in kernel methods: Support vector machines. Cambridge,
MA: MIT Press.
12. Ian H. Witten, Eibe Frank & Mark A. Hall., ―Data Mining Practical Machine Learning Tools and Techniques,
Third Edition.‖ Morgan Kaufmann Publishers is an imprint of Elsevier.
13. Dr. B. Srinivasan, P.Mekala, ―Mining Social Networking Data for Classification Using REPTree‖, International
Journal of Advance Research in Computer Science and Management Studies, Volume 2, Issue 10, October 2014
pp- 155-160
14. Payal P. Dhakate, Suvarna Patil, K. Rajeswari, Deepa Abin, ―Preprocessing and Classification in WEKA Using
Different Classifier‖, Int. Journal of Engineering Research and Applications, Vol. 4, Issue 8( Version 5), August
2014, pp- 91-93
15. Witten, I. H. (Ian H.), Eibe Frank, ―Data mining : practical machine learning tools and techniques, – 2nd ed. p.
cm. – (Morgan Kaufmann series in data management systems), Includes bibliographical references and index.