178 | P a g e
COMPARISION OF NETWORK WITH CLOUD
SERVERS USING OPNET MODELER
Vijaya Lakshmi Singh
1, Dr. Dinesh Rai
21
School of Engineering and Technology, Ansal University, (India)
2School of Engineering and Technology, Ansal University, (India)
ABSTRACT
Wired nodes form a multi-hop network. In this paper there are two scenarios of multi-hop wired network setup with
multiple subnet and cloud internet connections would be simulated using OPNET Modeler. In the first, there are ten
nodes, four servers named File server, HTTP server, Email server and Database server. In the second scenario
there are 15 nodes with same servers. Using these two scenarios, performance of the network will be analyzed.
Key Words: Cloud Computing; OPNET Modeler; Performance Metrics; Performance Parameters.
I INTRODUCTION
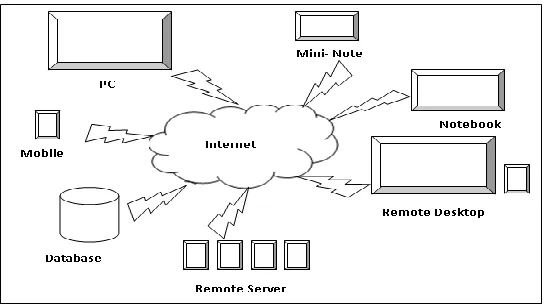
The network diagram that represents the internet as a cloud as shown in Fig. 1 describes the cloud computing
concept. According to the NIST definition, cloud computing is considered as a model that enables easy ,on-demand
network access to share various computer resources , application, services, networks, storage[19]. In this paper there
is IP32_ cloud which connects the subnets in these multi-hop networks.
Figure 1 - The term cloud computing seems to originate from computer network diagram that
represents the internet as a cloud etc. that can be provided to the user with minimum management
179 | P a g e
Performance is the major concern of every network. There are various performance metrics such as [8]:-i. Thread Task Level Metrics
Average Power Expended
Task Completion Time
ii. Scenario Metrics
Nodal Movement/Topology Rate of Change- Average speed of nodes
Number of Network Nodes
Area Size of Network
Density of Nodes per Unit Area
Offered load and traffic patters
Number of Unidirectional Links
iii. Diagnostic Packet Level Metrics
End –to- End Throughput
End –to-End Delay
Link Utilization
Packet Loss
However According to the study done in paper [21] based on various other papers [1] - [18], and recommendation
by RFC 2501[20], it had been concluded that:
The most effective performance metrics are
o Throughput
o End to End Delay
o Packet delivery ratio
o Routing message overhead
The important parameters that highly influence the performance of these three network are
o Traffic type
o Traffic received/ sent (packets/s, bytes/s)
o Response time
o Application
o Number of nodes
180 | P a g e
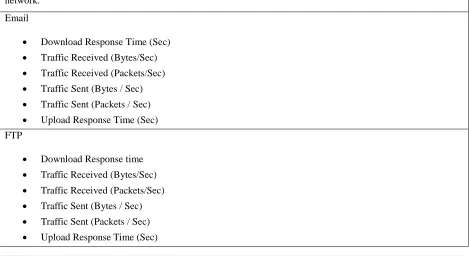
The performance metric and parameter considered in this paper are mentioned in Table 1.Table 1: Performance Metric and Parameters of Multi-hop network
Global Statics
DB Query
Response Time (Sec)
Time elapsed between sending a request and receiving the response packet. Measured from the time when the
Database Query Application sends a request to the server to the time it receives a response packet. Every response
packet sent from a server to a Database Query application is included in this statistic.
Traffic Received (Bytes/Sec)
Average bytes per second forwarded to all Database Query Applications by the transport layers in the network.
Traffic Received (Packets/Sec)
Average number of packets per second forwarded to all Database Query Applications by the transport layers in
the network.
Traffic Sent (Bytes / Sec)
Average bytes per second submitted to the transport layers by all Database Query Applications in the network.
Traffic Sent (Packets / Sec)
Average number of packets per second submitted to the transport layers by all Database Query Applications in the
network.
Download Response Time (Sec)
Traffic Received (Bytes/Sec)
Traffic Received (Packets/Sec)
Traffic Sent (Bytes / Sec)
Traffic Sent (Packets / Sec)
Upload Response Time (Sec)
FTP
Download Response time
Traffic Received (Bytes/Sec)
Traffic Received (Packets/Sec)
Traffic Sent (Bytes / Sec) Traffic Sent (Packets / Sec)
181 | P a g e
II SIMULATION MODEL
The OPNET models used in these simulations are fixed subnet, profile configuration, application configuration,
Ip32_cloud, Ethernet switch, router, firewall, Ethernet server, Ethernet Workstation and 100 BaseT Link
respectively as shown below in Figure 2. In this work, the multi-hop network consist of three subnets which are
located at different locations. Subnets are named as subnet_branch_china, subnet_branch_maleshiya, and
subnet_HQ_cameroon. Out of which subnet_HQ_cameroon contains four dedicated servers. Dedicated applications
are run on each server namely File Server, HTTP Server, Database Server and Email server. All these servers run on
cloud. The other two subnets namely subnet_branch_china and subnet_branch_maleshiya consists of ten nodes.
There will be two scenarios, one with 10 nodes and the other with 15 nodes. This multi-hop network is implemented
using a network simulator named OPNET Modeler 14.5. Based on this simulation the performance metrics and
parameters are observed, analyzed and compared through graphs.
Figure 2 - OPNET Model Used
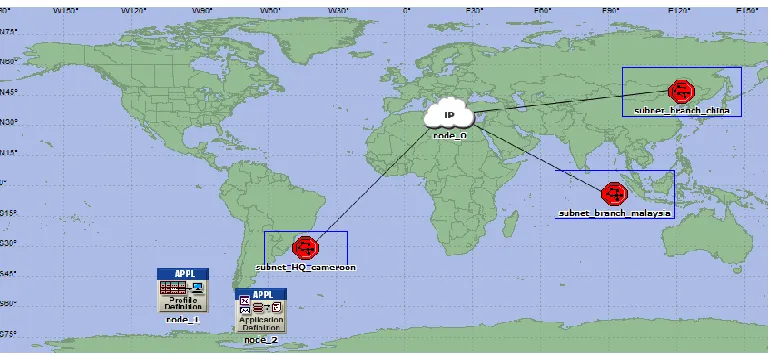
As shown in Figure 3, the multi-hop network consists of three subnets located at different locations and are
connected to IP32_cloud with 100 BaseT link. Each subnet consists of 10 wired nodes as shown in Figure 4.
182 | P a g e
Figure 4 - Wired fixed 10 and 15 node in subnet respectively (Scenario1 and Scenario2)
As shown in Figure 5 the headquarter subnet consists of four servers connected with wired LAN, namely File server,
Email Server, HTTP Server and Database Server. Since the profile has been created, each server performs their
respective tasks efficiently.
Figure 5 - Servers in Head quarter subnet (Scenario1 and Scenario2)
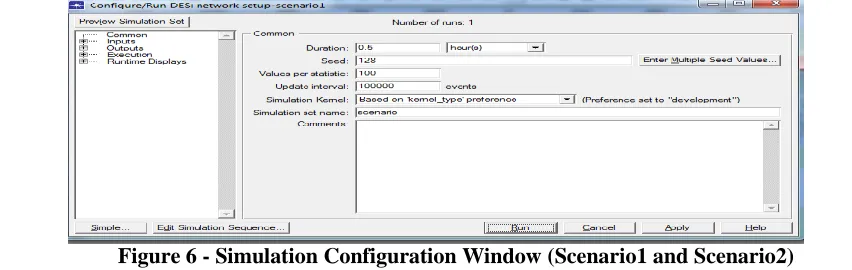
Simulation configurations taken in this simulation scenario (as shown in Figure 6) are: - Duration is 0.5 hours; Seed
is 128; Values per Statics are 100; Update interval is 100000 events; Simulation Kernel is Based on „kernel_type‟
preference; Simulation set name is scenario.
183 | P a g e
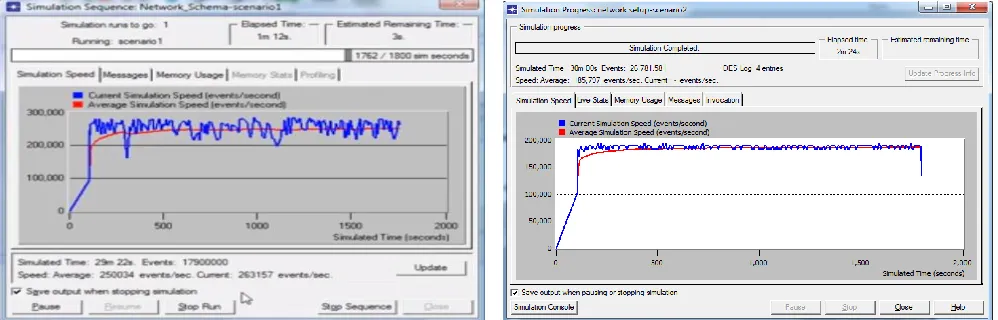
Also Fig. 7 and Fig. 8 show the simulation speed and simulation message respectively for Scenario1 and Scenario2respectively.
Figure 7- Simulation Speed (Scenario1 and Scenario2)
Figure 8- Simulation Message (Scenario1 and Scenario2)
III SIMULATION GRAPH AND RESULTS
According to the simulation performed based on the simulation Scenario1 and Scenario2, the graphs are generated,
184 | P a g e
3.1 Traffic Received and Traffic Sent
Traffic received is average bytes or packets per second forwarded to all Database Query Applications by the
transport layers in the network. Traffic sent is average bytes or packets per second submitted to the transport layers
by all Database Query Applications in the network.
3.1.1 Traffic Received (bytes /sec) and Traffic Sent (bytes/sec)
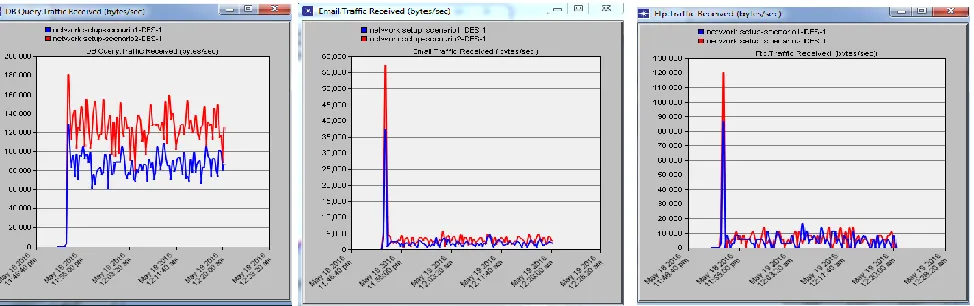
Figure 9 – Db Query Traffic Received (bytes /sec), Email Traffic Received (bytes /sec), FTP Traffic
Received (bytes /sec)
In Fig. 9, maximum traffic received (bytes/sec) under DB Query, Email and FTP by both scenarios, Scenario1 and
Scenario2 is compared. Red line shows scenario2 and Blue line is for scenario1. According to graph shown in Fig 9,
it is observed that traffic received(bytes/sec) is more in Scenario2 as compared to Scenario1 in all(Db query, Email
and FTP)
Figure 10 - Db Query Traffic Sent (bytes /sec), Email Traffic Sent (bytes /sec), FTP Traffic Sent
(bytes /sec)
Similarly according to graph shown in Fig. 10, maximum traffic sent (bytes/sec) under DB Query, Email and FTP is
185 | P a g e
3.1.2 Traffic Received (packets /sec) and Traffic Sent (packets/sec)
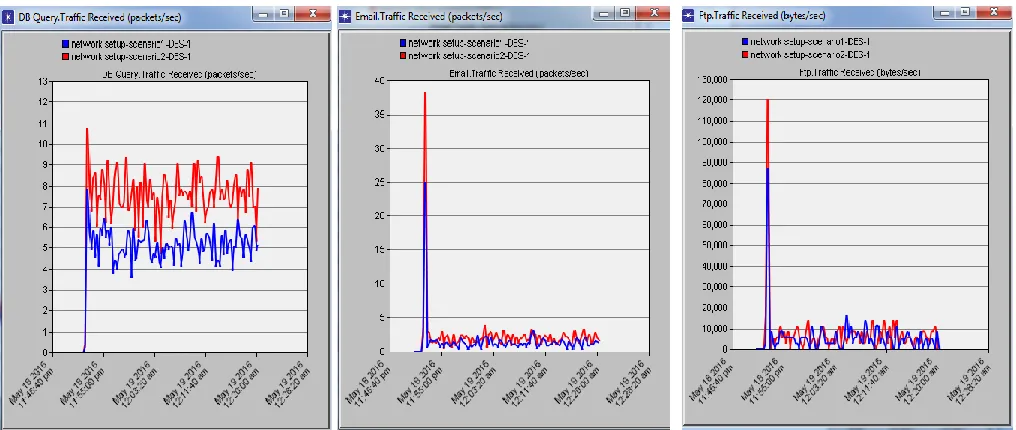
Figure 11- Db Query Traffic Received (packet/sec), Email Traffic Received (packet/sec), FTP
Traffic Received (packet/sec)
Figure 12- Db Query Traffic Sent (packet/sec), Email Traffic Sent (packet/sec), FTP Traffic Sent
(packet/sec)
Now according to graph shown in Fig. 11 and Fig. 12, maximum traffic sent (bytes/sec) and maximum traffic sent
(packets/sec) both under DB Query, Email and FTP is more in Scenario2 as compared to Scenario1.
3.2 Response Time
Time elapsed between sending a request and receiving the response packet. Measured from the time when the
Database Query Application sends a request to the server to the time it receives a response packet. Every response
186 | P a g e
Figure 13- Db Query Response time (sec) of Scenario1 and Scenario2
3.2.1 Average Upload Response time
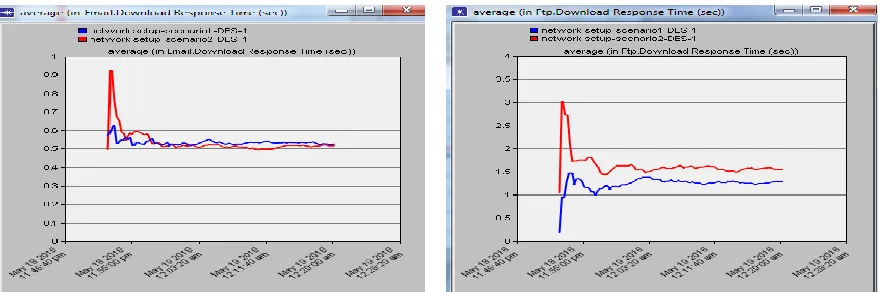
Figure 14- Average upload Response time (sec) under FTP and Email of Scenario1 & Scenario2
3.2.1 Average Download Response time
187 | P a g e
According to Fig. 13, Fig.14 and Fig. 15, the Db Query response time (sec) is of Scenario2 is more than Scenario1.Same is the case with Average FTP upload and Download Response time(sec) and Average Email Upload and
Download Response time(sec).
Based on the above simulation and graph the following tables, Table 2, Table 3 and Table 4 are derived that
summarizes the analysis in terms of average, maximum and minimum values of all the global statics of both the
scenarios, Scenario1 and Scenario2
Table 2: Db Query statistical average, maximum and minimum value of Scenario1 and Scenario2
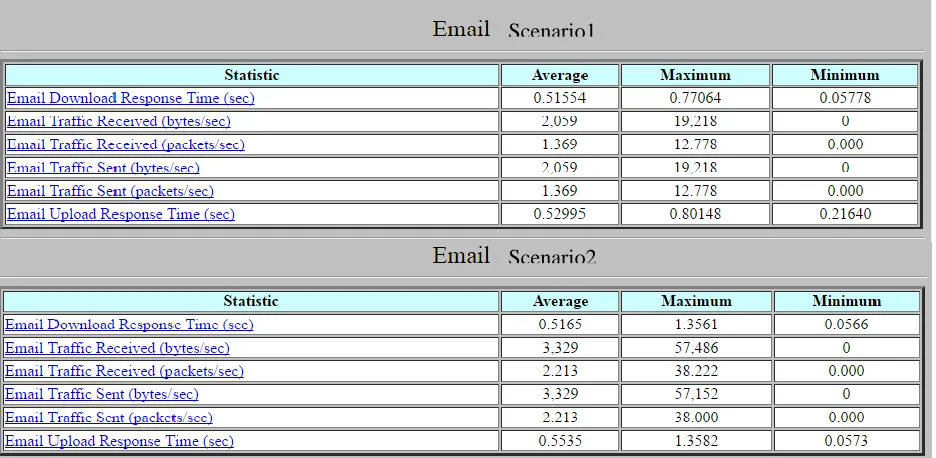
Table 3: Email statistical average, maximum and minimum value of Scenario1 and Scenario2
188 | P a g e
Table 4: FTP statistical average, maximum and minimum value of Scenario1 and Scenario2
IV CONCLUSIONS
In this paper comparison analysis of two multi-hop network, in two different scenario is analyzed. The network
consisted of three subnets, each have 10 nodes in scenario 1 and 15 nodes in scenario 2. In the headquarter subnet
Scenario2
Scenario1
Scenario1
189 | P a g e
there are four servers. The performance metrics considered were traffic received and traffic sent (bytes/sec andpackets/sec), point-to-point queuing delay, point-to-point throughput bits/sec), point-to-point throughput
(packets/sec) and point-to-point utilization. According to the graph and tables presented in simulation graph and
result it is concluded that all the global statistic parameter values increases as the number of nodes is increased in the
network.
REFERENCES
[1] G. Kioumourtzis, C. Bouras and A. Gkamas, "Performance evaluation of ad hoc routing protocols for military
communications", Int. J. Network Mgmt, vol. 22, no. 3, pp. 216-234, 2011.
[2] J-M Choi, Y-B Ko, “A performance evaluation for ad hoc routing protocols in realistic military scenarios”
Proceedings of the International Conference on Cellular and Intelligent Communications, 2004.
[3] Ahmed A. Radwan, Tarek M. Mahmoud and Essam H. Houssein, “Performance Measurement of Some Mobile
Ad Hoc Network Routing Protocols”, IJCSI International Journal of Computer Science Issues, Vol. 8, Issue 1,
January 2011 , ISSN (Online): 1694-0814
[4] Dmitri D Perkins, Herman D. Hughes, and Charles B. Owen. "Factors affecting the performance of ad hoc
networks." Communications, 2002. ICC 2002. IEEE International Conference on. Vol. 4. IEEE, 2002.
[5] Abdul Hadi Abd Rahman and Zuriati Ahmad Zukarnain. "Performance comparison of AODV, DSDV and
I-DSDV routing protocols in mobile ad hoc networks." European Journal of Scientific Research 31.4 (2009):
566-576.
[6] Gayatree Rana, Bikram Ballav, and Binod Kumar Pattanayak. "Performance Analysis of Routing Protocols in
Mobile Ad Hoc Network." International Conference on Information Technology (ICIT). IEEE, 2015.
[7] HuiYao Zhang, John Homer, Garry Einicke and Kurt Kubik "Performance comparison and analysis of voice
communication over ad hoc network." Proceedings of the 1st Australian Conference on Wireless Broadband
and Ultra Wideband Communications (AusWireless 06). 2006.
[8] Madhavi W. Subbarao, "Ad hoc networking critical features and performance metrics." Wireless
Communications Technology Group, NIST (1999).
[9] Jyoti Raju, and J. J. Garcia-Luna-Aceves. "A comparison of on-demand and table driven routing for ad-hoc
wireless networks." Communications, 2000. ICC 2000. 2000 IEEE International Conference on. Vol. 3. IEEE,
2000.
[10]Puneet Kumar Bhardwaj, Shipra Sharma, and Vandana Dubey. "Comparative analysis of reactive and proactive
protocol of mobile ad-hoc network.", International Journal on Computer Science and Engineering 4.7 (2012):
190 | P a g e
[11]Mandeep Singh and Maninder Singh. "Performance of AODV, GRP and OLSR Routing Protocols in Ad hocNetwork with Directional Antennas.", International Journal of Computer Applications Vol. 83, No. 2 (2013),
(0975-8887)
[12]Swati Dhawan and Vinod Saroha. "Optimize the Routing Protocol (GRP, OLSR, and DSR) using OPNET & its
Performance Evaluation." International Journal of Advances in Engineering & Technology 6.3 (2013): 1399,
ISSN: 22311963
[13]Muhammad A. Riaz, Md Adnan Shaffatul Islam, and Mohammed Tariqu. "Performance analysis of the
Routing protocols for video Streaming over mobile ad hoc Networks." International Journal of Computer
Networks & Communications Vol., No.3 (2012): 133-150.
[14]Gagangeet Singh Aujla and Sandeep Singh Kang. "Comprehensive Evaluation of AODV, DSR, GRP, OLSR
and TORA Routing Protocols with varying number of nodes and traffic applications over MANETs." IOSR
Journal of Computer Engineering, Vol.9, Issue 3 2013, pp.54-61.
[15] Ms. Sunita Sharma and Ms. Shruti Thapar, “Comparative Performance Analysis of AODV, DSDV and OLSR Routing Protocols in MANET Using OPNET” ,International Journal of Novel Research in Computer Science
and Software Engineering, Vol. 2, Issue 2, 2015, pp. 57-65.
[16]Vikas Goyal, Shaveta Rani, and Paramjit Singh. "Performance Investigation of Routing Protocols for Database
and Voice Data in MANETS.", International journal of Emerging Trends and Techonology in Computer
Science, Vol. 2, Issue 4, 2013, ISSN 2278-6856
[17]Muhammad Asif Mehmood, Ahmed Mateen Buttar, and Muhammad Ashraf. "Experimental based Performance
Analysis of Proactive OLSR, Reactive TORA and Hybrid GRP Routing Protocols in MANET." Int. J. Comput.
Appl, Vol. 89, No.15, 2014,(0975-8887).
[18]Adel Aneiba and Mohammed Melad. "Performance Evaluation of AODV, DSR, OLSR, and GRP MANET
Routing Protocols Using OPNET.", International Journal of Future Computer and Communication, Vol. 5, No.
1, 2016.
[19]Abdullah Yildirim Sinan, and Tolga Girici. "Cloud Technology and Performance Improvement with Intserv
over Diffserv for Cloud Computing." Proceeding of the Int. Conf. on Cloud Computing and eGovernance 2014.
[20]S. Corson,, and J. Macker, “Mobile Ad hoc Networking (MANET): Routing Protocol Performance Issues and
Evaluation Considerations", RFC 2501, 1999.
[21]V.L.Singh. “Performance Metric, Parameters and Factors of Ad Hoc, Cloud and Ad Hoc Cloud Network”,