University of London
A STUDY OF
INTEGRATION AND
BINDING IN THE
HUMAN VISUAL
BRAIN
Matthew William Self
Ph.D. Thesis
ProQuest Number: U642100
All rights reserved
INFORMATION TO ALL USERS
The quality of this reproduction is dependent upon the quality of the copy submitted. In the unlikely event that the author did not send a complete manuscript and there are missing pages, these will be noted. Also, if material had to be removed,
a note will indicate the deletion.
uest.
ProQuest U642100
Published by ProQuest LLC(2015). Copyright of the Dissertation is held by the Author. All rights reserved.
This work is protected against unauthorized copying under Title 17, United States Code. Microform Edition © ProQuest LLC.
ProQuest LLC
789 East Eisenhower Parkway P.O. Box 1346
Abstract
This thesis is concerned with the visual system’s ability to integrate
various components of the visual scene into a unified percept within a fraction of
a second. It takes as its starting point the theory of functional specialisation in
the human visual system and attempts to answer the question raised by this
theory. If the visual system is divided up into specialised modules that process
separate parts of the visual world (i.e. colour, motion, depth etc), then how does
the brain integrate these various components?
Firstly, using psychophysical techniques, we addressed whether the brain
is able to integrate the colour and motion cues that define objects. We found that
objects defined by more than one cue are more easily and rapidly discriminated
than those defined by one cue alone, suggesting that the brain can integrate
different cues. Using functional magnetic resonance imaging (fMRI) we
searched for the cortical site(s) for this process. We found that the posterior part
of the lateral occipital complex (LO) was more active when subjects viewed
objects defined by both colour and motion cues compared to those defined by
either alone. LO also had an adaptation profile consistent with the presence of
neurons responsive to both colour and motion defined objects. This suggests that
LO is the site of the integrative process evident from the psychophysical studies.
Generalising this finding to face stimuli, we found that the site of
integration for faces was not LO, but the area specialised for processing faces
(the fusiform face area). Taking all results together, we propose that cue
integration is a rapid, feed-forward process that is executed by the area
specialised for processing the relevant stimulus and is crucial to the rapid and
Acknowledgements
Firstly I would like to express what a pleasure it has been to work with
my supervisor, Professor Zeki for the last three years. His boundless enthusiasm
for the subject and his hunger for scientific success has driven me on through my
studies and his knowledge o f both the visual world and the world in general have
been instrumental in shaping this thesis. Working in the Zeki lab has also been a
lot o f fun, the numerous lab parties, working lunches at Japanese restaurants and
the frequent discussions held between the whole lab about topics ranging from
solving the binding problem to the merits or otherwise of Harry Potter have
ensured that my time in the lab has never been dull.
All the other members of the Zeki lab have contributed to this thesis in
both creating a great work environment and helping me with scientific issues. I
would particularly like to thank Drs. Richard Perry and Andreas Bartels for all
their guidance and advice during the first two years of my Ph.D., my
understanding o f the visual system and fMRI have grown immensely under their
tutorage. The other Ph.D. students in the lab, especially Richard Lewis and
Oliver Hulme, have always kept me entertained, as well as forcing me to
question my own knowledge o f the subject, a process which is crucial to truly
understanding a subject.
Also I would like to thank John Romaya for his help with getting me
started programming in C++ and providing technical advice throughout my PhD
about both computing and solving back problems! Furthermore Thomas Mueller
and Gabriel Caffarena have helped me greatly with my numerous problems with
UNIX systems. Finally I would like to thank Martin Cook for all his help and
support throughout my PhD and all his advice about matters graphical,
Outside the lab the other 7 students on the Wellcome 4 year course have
always been a close group of friends to mull over our work over a pint in the
Jeremy Bentham and my flatmates Drs. Matthew Phillips and Beth Rycrofr were
always willing to put up with my scientific ramblings and provided me with
good advice about how (not) to go about writing a thesis.
Finally I would like to thank my parents, Trevor and Frances for their
support and their belief in me throughout all my studies and Kathryn Pickard for
Table of contents.
Abstract ... 2
Acknowledgements ... 3
Table of contents ... 5
List of figures...9
List of tables ...11
List of publications ... 12
Part 1 :
Introduction
Overview... 13Psychophysical studies of cue integration ... 14
fMRI studies of cue integration and invariance ... 14
Summary ...16
Historical survey ... 18
1.1. Functional specialisation of the visual cortex ... 19
1.2. The colour, form and motion systems o f the brain 23 1.2.1. The motion system ... 25
1.2.2. The colour system ... 28
1.2.3. The form system ... 32
1.3. Integration and the binding problem ... 36
1.3.1. Figure/ground segregation ... 37
1.3.2. Cue integration... 39
1.3.3. The binding problem ... 40
1.3.4. Unity of consciousness ... 43
1.4. Summary 46
Methods and Results ... 47
2.1. Psychophysical methods ...47
2.1.1. Stimulus generation software ... 47
2.1.2. C olours...47
2.1.3. Stimulus control and shape generation...48
2.2. Experiment 1 : Can the brain integrate colour and motion cues?... 51
2.2.1. Experiment 1 - Procedure ... 51
2.2.2. Statistical analysis ... 52
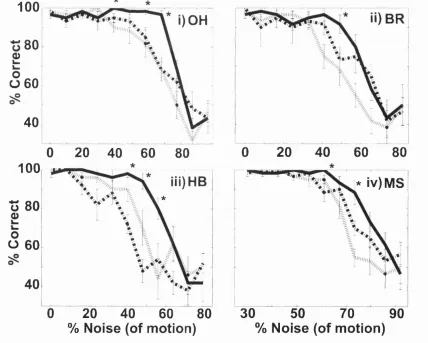
2.2.3. Experiment 1 - Results... 53
2.3. Controls for Experiment 1 ...57
2.3.1. Experiment 2 - Image segmentation control and spatial scale ... 57
2.3.2. Experiment 2 - Procedure and results ...58
2.3.3. Experiment 3 - Colour/Motion interaction control 59 2.4. Experiment 4: The temporal properties of cue integration ... 61
2.4.1. Experiment 4a. Temporal thresholds for integration: one object 61 2.4.2. Results from Experiment 4a ... 62
2.4.3. Experiment 4b. Temporal threshold for integration: 2 objects ... 64
2.4.4. Results from experiment 4b ... 66
2.5. Functional Magnetic Resonance Imaging ...68
2.5.1. Scanner details ...68
2.6. Experiment 5: Shape localising block study ...69
2.6.1. Procedure ...69
2.6.2. Data analysis I: pre-processing... 71
2.6.3. Data analysis II: statistical analysis ...72
2.6.4. Results ... 74
2.7. Experiment 6: Shape localising event-related study ... 77
2.7.3. Results ... 79
2.8. Experiment 7: Cue integration...82
2.8.1. Procedure ... 82
2.8.2. Data analysis ... 83
2.8.3. Results ...86
2.9. Experiment 8: An fMR adaptation study of cue invariance ... 94
2.9.1. Procedure ... 95
2.9.2. Data analysis ... 96
2.9.3. Results ... 96
2.10. Experiment 9: Stimulus specific integration...108
2.10.1. Procedure ... 108
2.10.2. Data analysis ... 109
2.10.3. Results...109
Part 3:
Discussion
... 112
3.1. The processing of colour and motion defined forms by the primate visual system ... 112
3.2. The integration of colour and motion cues ...116
3.3. The temporal properties of cue integration ...119
3.4. Cue integration related activity in the human visual system... 123
3.4.1. The human lateral occipital complex (LOG) ... 123
3.4.2. Cue integration related activity in the LOG ... 126
3.4.3. Does LO contain cue invariant neurons?... 129
3.4.4. Homology between LOG and occipito-temporal regions in the macaque ...132
3.5. The mechanisms of cue integration ... 135
3.5.1. Cue integration is stimulus specific ...135
3.5.2. Feedback and feedforward connections in the visual system ... 137
3.5.4. Proposed model for cue integration ...146
3.5.5. Cue integration and the binding problem ... 149
3.6. Summary...153
Part 4:
Appendices
... 154
4.1. Appendix 1: Construction of shapes ...154 4.2. Appendix 2: Curve fitting ...157
Part 5:
List of Figures.
Figure 1: A cue-invariant and cue-variant area ... 15
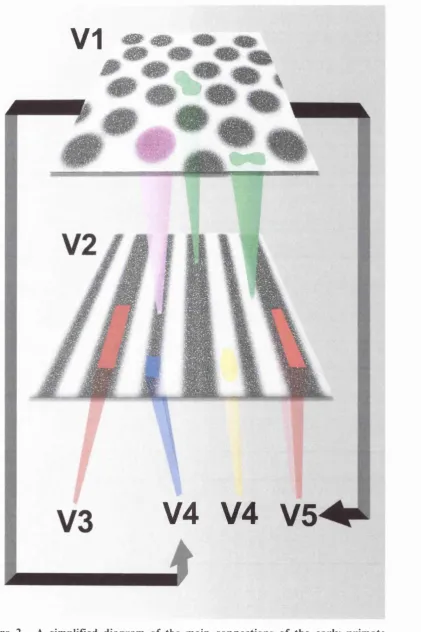
Figure 2: A simplified diagram of the main connections of the early primate visual system ... 24
Figure 3: The position of V5 in the human brain... 27
Figure 4: A view of the ventral surface of the brain showing the position of V4 and V 4a ...30
Figure 5: The location of the lateral occipital complex ... 34
Figure 6: A demonstration of the binding problem ... 41
Figure 7: A demonstration of the different models leading to perceptual asynchrony ... 45
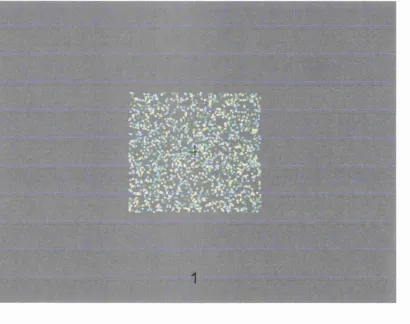
Figure 8: An example screenshot showing a 100% noise stimulus... ...49
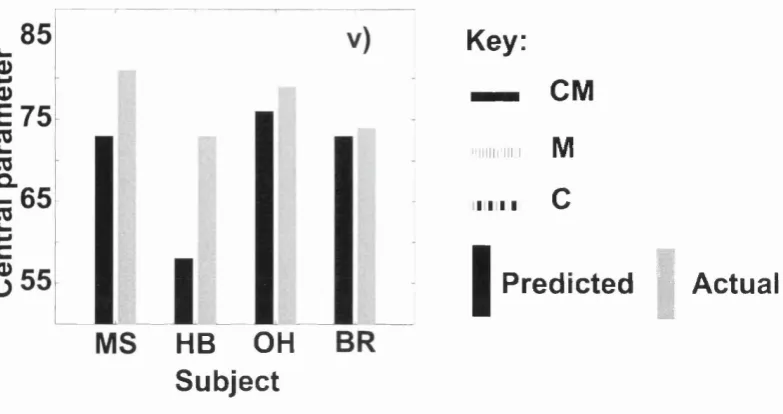
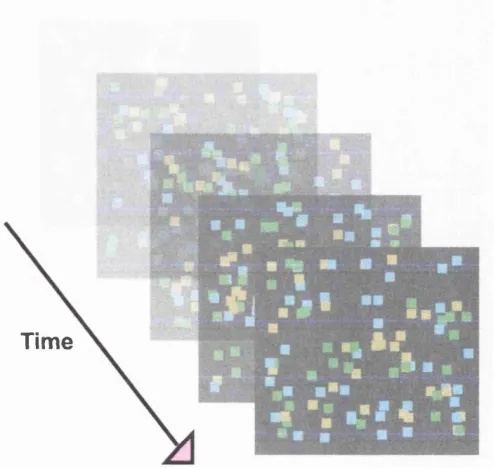
Figure 9: Time-lapse images of the stimuli used in Experiment 1 ...51
Figure 10: Psychophysical data from Experiment 1 ... 53
Figure 11: A comparison between predicted and actual performance of subjects in Experiment 1 56 Figure 12: A symbolic representation of the CMNO condition ...57
Figure 13: Psychophysical data from Experiment 2 ... 59
Figure 14: Psychophysical data from Experiment 3 ... 60
Figure 15: An example of a post-stimulus mask ... 61
Figure 16: Results from Experiment 4a ...63
Figure 17: A set of frames from experiment 4b ... 65
Figure 18: Results from Experiment 4b averaged across three subjects ...66
Figure 19: Shape-related activity from Experiment 5 74 Figure 20: Parameter estimates from the LOG in Experiment 5 75 Figure 21: Shape specific activity from Experiment 6 80 Figure 22: The average performance of all subjects inside the scanner ... 83
Figure 24: Imaging data from Experiment 7 87
Figure 25: Detailed anatomy of subject LD ... 89
Figure 26: Detailed anatomy of subject CB ... 91
Figure 27: BOLD response profiles from three areas averaged
across subjects 93
Figure 28: Data from the fMR adaptation study ...98
Figure 29: Detailed anatomy from subject BR ...99
Figure 30: Parameter estimates and BOLD responses from the
fMR adaptation experiment ...101
Figure 31: Parameter estimates and BOLD responses from the
LOa/pFs area ...103
Figure 32: Cue variant and cue invariant responses from subjects
BR and PL ...105
Figure 33: Responses from areas V4 and V5 in the Experiment 8 ...107
Figure 34: Time-lapse images of the stimuli used in Experiment 9 ...108
Figure 35: Imaging data comparing results from Experiment 9
and Experiment 7 110
Figure 36: BOLD response profiles from LO and FF A ... I l l
Figure 37: A demonstration of a visual search paradigm ... 120
Figure 38: Models for integration areas ... 127
Figure 39: Global and local forms in visual search ... 138
Figure 40: A demo of the advantages of matching low
spatial frequency images ... 141
Figure 41 : The task used by Moller and Hurlbert ... 142
Figure 42: Kanizsa figures ... 143
Figure 43: A proposed model of how cue integration fits into
List of tables
Table 1 : Talairach co-ordinates of the regions activated
in Experiment 5 by shapes ... 76
Table 2: The factorial design of Experiment 6 79
Table 3: Talairach co-ordinates of the regions shown
in Figure 20 ...81
Table 4: The co-ordinates of the LOC in Talairach space ... 125
Publications
Abstracts
Self, M.W., and Zeki, S. (2002). The dorsal region of the lateral occipital
complex integrates color and motion to construct simple shapes. Program No.
260.12. 2002 Abstract Viewer/Itinerary Planner. Washington DC: Society for
Neuroscience, 2002. Online.
Self, M.W., and Zeki, S. (2003). The integration of color and motion cues by the
human lateral occipital complex. Supplement to Neuroimage, June 2003.
Abstract No. 1522.
Self, M.W. and Zeki, S. (2003). The integration o f colour and motion by the
human visual brain. Program No. 819.2. 2003 Abstract Viewer/Itinerary Planner.
Washington DC: Society for Neuroscience, 2003. Online.
Papers
Self, M.W., and Zeki, S. (2003). The integration of colour and motion cues by
Section 1
Introduction
Overview
This thesis is concerned with the visual system’s ability to integrate the components of
the visual scene into a unified percept within a fi-action of a second. It takes as its
starting point the theory of functional specialisation in the primate visual system (Zeki,
1978a; Zeki and Shipp, 1988; DeYoe and van Essen, 1988; Livingstone and Hubei,
1988) and attempts to answer the questions that are raised by this theory. This theory
proposes that the visual system is organised into multiple, parallel systems, which are
specialised for processing particular attributes of the visual scene (such as colour,
motion, form etc). This parcellation of function raises the question of how the brain
generates the unified percept that we experience; with colours, movements, objects, and
depths all combined to form a coherent and sensible percept. Given its anatomical
organisation, this feat is one of the most astonishing accomplishments of our visual
system. In this thesis we have concerned ourselves with one aspect of this large
problem, that of cue integration.
In a normal visual scene there are many different cues, such as colour, motion,
and luminance, which the visual system can use to discriminate objects from their
backgrounds. Cue integration is the ability of our visual system to utilise these cues to
improve our ability to discriminate objects (Rivest and Cavanagh, 1996; Rivest et al,
1997; Bach and Schmitt, 2000; Nothdurft, 2000, Kubovy and Cohen, 2001). We have
studied this problem using both psychophysical techniques and functional magnetic
resonance imaging (fMRI) to determine the mechanisms o f cue integration in the
human visual system.
Psychophysical studies of cue
integration
Firstly we addressed, using psychophysical techniques, whether the brain is able
to integrate various cues that define form in the visual world. We only studied the
integration of colour and motion cues as these are thought to be the most separate in
terms of their cortical representation (Zeki, 1978b; Zeki and Shipp, 1988; Livingstone
and Hubei, 1988). For this reason if the brain is able to integrate colour and motion
forms then it is likely that it will be able to integrate forms defined by other cues. We
found that, even using complex stimuli, the brain remains able to integrate colour and
motion cues. This ability to integrate different cues confers perceptual advantages on
forms defined by multiple cues so that they are more easily and rapidly discriminated
than forms defined by one cue alone. The time-course of the subjects’ behaviour
suggested that integration takes place with extreme rapidity, probably before attention
can be brought to bear upon the stimulus. This suggests that cue-integration may be a
feed-forward, automatic process that is built into the mechanisms that construct the
receptive fields of form-selective neurons.
fMRI studies of cue integration and
invariance.
The primary aim of our imaging studies was to determine the cortical location(s) of the
integration process evident from the psychophysical studies. We wanted to know
whether there were separate sites at which information from different functionally
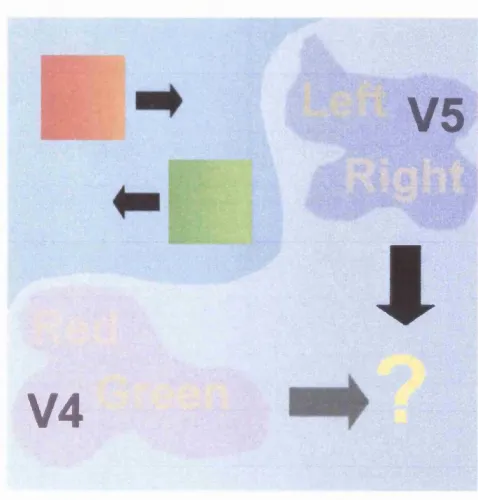
interactions between these systems? Work from this lab (Perry and Zeki, 2000),
suggests that if the different cues that define a form are separated in space (i.e. the top
half of the form is defined by motion, the bottom half defined by colour) then the
parietal cortex may be involved in integrating these cues together to form the
representation of the object as a whole. Currently it is unclear whether cue integration
requires activity in parietal cortex or Just in the cue invariant areas representing the
object (Figure 1).
M/C
M/C
M/C
I
M
C
M
M
I
M/C
M/C
M/C
.
C
M
C
C
M/C
!
M
C
M
M
I
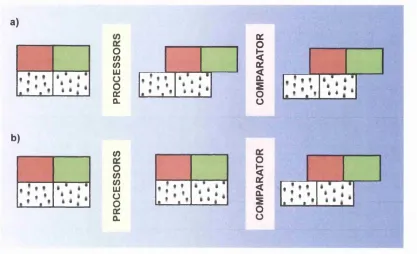
Figure 1. A cue-invariant and cue-variant area. A demonstration of the two possible neural sources of an area giving a greater response to forms defined by both colour (C) and motion (M) compared to one cue alone. On the left is a symbolic representation of a population of form-selective neurons that are able to integrate colour and motion form cues to produce more neural activity. On the right is the alternative possibility of a mixture of neurons responding to forms defined by only one cue. If we average the responses of all the neurons in this area then both hypotheses give the same level of neural activity and consequently the same fMRI response.
We used fMRI to search for areas of the brain that were more active if a form
was defined by both colour and motion than if it was defined by one cue alone. This
would provide evidence that colour and motion form information has been brought
together in a specific brain region. We found that only one region of the brain, the
posterior part of the lateral occipital complex (LO), possessed this property, suggesting that it may be the site of the integrative process evident from the psychophysical
studies. This does not necessarily mean that this region o f the brain has integrated
colour and motion information into the same neural population. An alternative
possibility is that it contains separate populations of neurons, each responding to shapes
defined by one cue alone. Due to the relatively poor spatial resolution of fMRI a mixed
population of neurons responding to different cues gives exactly the same signal as an
integrated population responding to several cues (Figure 1). Such regions have been
observed in monkey parietal cortex (Zeki, 1990a; Shipp and Zeki, 1995) with colour
and motion systems providing juxta-convergent inputs to sub-divisions of the same
area.
To determine whether integration is really taking place in the brain we used a
new technique called fMR adaptation. This enabled us to infer that LO contains cue
invariant populations of neurons, which are able to integrate across different cues and
are therefore activated to a higher degree by shapes defined by more than one cue.
Given the relationship between the strength of activity in LO and the psychophysical
performance of the subject (Grill-Spector et al, 2000), we propose that it is this
increased activity of LO neurons that results in the perceptual advantages enjoyed by
transmodal shapes over unimodal shapes. Interestingly, the site of integration was
found to be in the same location as the cortical site specialised for processing shapes.
This suggests a more general-rule that visual attributes are integrated by the site
specialised for processing the form defined by the attributes. To test this hypothesis, I
changed the stimuli from shapes to faces and found the site o f integration shifted from
LO to the fusiform face area. This suggests that our hypothesis is true and that cue
integration occurs in the cortical site specialised fo r processing the relevant form.
Summary
In summary we have determined that cue integration is a rapid process that
probably occurs without any need for top-down processing. It results in the formation
of neurons that can respond to forms defined by different cues, and which are more
neurons allow the visual system to utilise more information about visual forms and
consequently, forms defined by more than one cue enjoy a number o f perceptual
advantages over forms defined by one cue alone. This bottom-up process appears to be
driven by the stimulus and the site of integration is the same site that is specialised for
processing the shape of the stimulus. Such an integration process undoubtedly plays an
important role in the remarkable ability of our visual system to rapidly discriminate an
object from its background and must also contribute to the unified, seamless nature of
our perception of objects in the visual world.
Historical survey
As soon as we open our eyes we are bombarded with a mass of information.
Light of different intensities, wavelengths and flux stimulate the rods and cones of our
retinas. From this massive complexity our visual system is able to construct an
organised percept in a fraction of a second. This achievement has baffled scientists for
centuries and it was not until the latter parts of the twentieth century that significant
progress was made into the functioning of the human visual system. We are now
beginning to understand that the visual system has evolved to deal with this influx of
information by specialisation (Zeki, 1978a; Zeki and Shipp, 1988; Livingstone and
Hubei, 1988). Our visual cortex is not a uniform region that reconstructs the visual
scene like a ‘cortical retina’ (Henschen, 1894), but rather a complex menagerie o f areas
that contain neurons tailored to performing particular tasks (Zeki and Shipp, 1988;
Felleman and Van Essen, 1991). It is this specialisation which lies at the root of the
problems of integration and binding: if the visual cortex is divided into different areas
processing different things, then how do we perceive a coherent image with all the
different parts being perceived in spatial and temporal unison? In the following
historical review of our attempts to understand the visual system, I shall first describe
how the theory of functional specialisation, both of the cortex as a whole and of the
visual system in particular, came to be. I will then describe how scientists have
1.1. Functional specialisation of the
visual cortex.
The concept of functional specialisation has its roots in the spurious science of
19th century phrenologists. Phrenologists such as Gall and Spurzheim believed that the
shape of the skull was indicative of the underlying form of the brain, and that the shape
of the brain represented the person's psychological characteristics. Certain
characteristics were ascribed to regions of the brain and hence personalities could be
divined by feeling for bumps and hollows in the skull. These views were correctly held
to be superstition by the majority who preferred the idea of a brain functioning as a
syncitium, with each function distributed widely throughout the brain (Flourens, 1842).
The first scientific evidence for functional localisation came from Pierre Paul Broca,
who was the first scientist to directly associate damage to a specific region o f the
cerebral cortex with a specific behavioural deficit. He described a patient, Leborgne,
who could understand language but remained unable to produce any structured
language of his own, either by speaking or writing (Broca, 1861). Upon post-mortem
Broca identified a specific region of damage to the posterior regions o f the frontal lobe,
particularly on the left side. In actual fact, even though the damage to the cortex was
quite extensive, Broca identified the left frontal lobe as being the primitive site of
damage due to the extent of the cortical degeneration in this region. Broca may well
have been very fortunate (or astute) that this region truly was the main focus o f the
cortical damage!
This observation, that one region of cortex performs a specific role, was the
beginnings of functional localisation, i.e. the idea that the different functions o f the
brain reside in different regions of the cortex, and the region identified by Broca was
named after him as a testament to this revolutionary finding. However, it was not until
a separate region of cortex, with a different architecture, was shown to have a different
function that the concept of functional localisation could be developed. This
observation came from Fritsch and Hitzig (1870) in their studies of motor functions in
the dog. They observed that stimulating the anterior parts o f the cerebral cortex results
in muscular contractions but the stimulation of the posterior part does not. In this
observation lies the foundation of the theory of functional localisation in the cerebral
cortex. These studies of different regions o f cortex giving rise to separate functions
inspired anatomists to search for anatomical correlates of this functional localisation.
The work of Brodmann (1905) and of Campbell (1905) was most crucial to the idea
that the brain is not a homogenous mass but can be divided into different areas.
Brodmann divided the cortex up into 52 areas based on differences between the
cytoarchitecture of the cortex. He used differences in the cell layering and cell type to
produce his maps, and this technique still provides one o f the best ways to map the
cortex and has recently been modernised and automated by Zilles (Schleicher and
Zilles, 1990). The differences in cytoarchitecture between different areas were not
observed by all. Karl Lashley proposed that there was no difference between visual
areas 18, 19 and 7, instead he thought that these were all the same area acting as a
single unit (Lashley and Clark, 1946). These proposals formed part o f his theory of
mass action (Lashley, 1931), which envisaged that complex functions were carried out
by distributed cortical areas. This theory was largely formed from his observation that
the effect of a lesion to the cortex does not depend so much on its location as its size.
With the benefit of modem neuroscientific theory we can see that Lashley's
observations were largely due to his choice of experimental task, rat's learning a route
through a maze. This task utilises several different systems in the brain and so damage
to any one o f the systems can be compensated for by the remaining intact systems.
It was not until the pioneering work of Penfield in the late 1950s that functional
localisation o f the cortex became irrefutable. Working with conscious human patients
undergoing surgery for epilepsy, Penfield stimulated the exposed cortex with
electrodes. He found that, depending on the site of the stimulation, different effects
could be elicited. Stimulation over the precentral gyms, for example, produced
movements in the patient whereas stimulation over the postcentral gyms produced
sensations o f touch and pressure. Penfield did not stimulate the visual cortex in the
course o f his studies, but the idea that vision was localised in the cortex had long been
known from the work o f Henschen (1894, 1900) and Holmes (1945). Studies of
patients with scotomas and hemianopias had revealed that the site o f damage was the at
the back of the brain, normally close to, or within, the calcarine sulcus in what became
responsible for vision, the prevailing view was that it acted as a “cortical retina”
(Henschen 1894), simply recreating the visual scene. The concept of functional
specialisation within the visual system took much longer to develop. The reason for
this delay is probably due to the nature of our visual experience. The visual world
appears to us as a unified scene, which instantly springs to view the moment we open
our eyes. The view that different parts of this scene may be processed by different,
functionally specialised areas of cortex was an anathema to many.
The first scientists to successfully study the neuronal properties of the visual
cortex were Hubei and Wiesel, first in the cat (Hubei and Wiesel, 1959; 1962) and then
in the monkey (Hubei and Wiesel, 1968; 1977). Recording from the striate cortex,
Hubei and Wiesel mapped receptive fields and found a variety of cells that seemed to
form a hierarchy of receptive field complexity. They envisaged a hierarchy beginning
with simple cells with receptive fields resembling Gabor functions. These cells showed
linear summation within their receptive fields so that the firing rate of the neuron could
be predicted from its inputs. More complex receptive field properties could then be
built by combining the outputs of simple cells; cells with such receptive fields were
eponymously entitled complex cells (whether complex cells are constructed from
simple cell inputs is still a matter of debate some 40 years after their first description,
see Martinez and Alonso, 2001). Further layers o f complexity could be built up by
combining the outputs of complex cells together and so on. The picture that arose from
these studies for the visual cortex as a whole was one in which every aspect o f the
visual scene was processed in each area, but at a higher level o f eomplexity. The
ultimate end for this logic was the proposal of the grandmother cell, a cell with such
complexity in its inputs that it would only fire when presented with the image o f your
grandmother (Proposed in jest after work by Barlow on the "cardinal" cell (1972)).
This proposal suffers from the obvious flaw that more neurons would be needed to
represent every possible visual stimulus than exist in the brain! A modified
grandmother-cell theory has recently been put forward by Riesenhuber and Poggio
(1999) using neural assemblies rather than individual cells, so the theory is by no
means dead. However most visual neuroscientists currently subscribe to the view
developed by Zeki in a series of experiments in the 1970s recording from pre-striate
areas of the monkey cortex. Zeki found that the properties of neurons in the pre-striate
cortex varied according to the location from which he was recording. He found that a
region of cortex on the posterior bank of the superior temporal sulcus contained
neurons exhibiting a strong preference for moving stimuli over stationary stimuli (Zeki,
1974). Over 90% of the neurons in this area exhibited tuning for the direction of
motion of the stimulus but had no preference for colour. In contrast to this area he
found a region of cortex in preluneate sulcus containing neurons responding to colour,
but not motion (Zeki, 1973; Zeki 1978b).
These experiments led Zeki (1978a) to propose that the visual system was
organised into multiple, parallel, functionally specialised systems. Although Zeki's
experiments were the first to concentrate on functional specialisation within the visual
cortex, a great deal of evidence already existed in favour of specialisation from studies
of brain-damaged patients. This evidence was buried for years as it did not conform to
the prevailing view of the function of the visual system. There are several descriptions
in the literature of patients with damage to the fusiform and lingual gyri who suffer
from achromatopsia, the inability to see colour (see Zeki, 1990b for a review). A
crucial fact is that these most of these patients have entirely normal perception of
motion and form. This suggests that the damaged area o f the brain was not processing
every single attribute of the visual scene but rather it was processing a specific
attribute, namely colour. In 1991a Zeki et al confirmed that the human visual cortex
possessed areas specialised for the processing of colour and motion using Positron
Emission Tomography (PET) and that these areas are homologues of the color and
motion areas of the monkey. With the advent of more complex functional imaging
techniques such as functional Magnetic Resonance Imaging (fMRI) the weight of
1.2. The colour, form and motion
systems of the brain
The work I present here involves three of the main functionally specialised
systems of the visual brain, the motion, colour and form systems. In this section I shall
review what we know about them from patient studies and imaging work. For detailed
anatomy and physiology of these systems it is necessary to review the work carried out
in monkeys. To discuss the functional anatomy o f these three systems it is first
necessary to briefly review the projections from the lateral geniculate nucleus o f the
thalamus (LGN) to the striate cortex. As with all our knowledge of detailed brain
anatomy, most of these findings apply to the monkey, particularly the macaque.
The LGN can be divided into two sets o f layers on the basis of cell size and
physiological characteristics. The magnocellular layer contains large cells with rapid
conduction velocities, high contrast sensitivity, transient responses and no
differentiation between wavelengths. The parvocellular layer contains small cells with
slow conduction velocities, sustained responses, lower contrast sensitivity and great
wavelength sensitivity (Wiesel and Hubei, 1966; Hubei and Wiesel, 1972). These
physiological differences originally led neuroscientists to believe that the M pathway
begets the motion pathways of the cortex whereas the P pathway contains the inputs to
the colour systems (Livingstone and Hubei, 1988). More recent evidence suggests that
this simplistic view does not hold and that there is intermixing o f the pathways in their
projections into VI (Merigan and Maunsell, 1993; Nealey and Maunsell, 1994;
Sawatari and Callaway, 1996). Therefore, although the P and M pathways do contain
the roots of functional specialisation in the cortex, it is in VI that different signals are
routed to different cortical areas and the generation o f functional systems occurs here.
V1 ^ ^
V4 V4 V5
regions largely project to the thin stripes of V2 (purple) whereas those in the interblob region project to both the thick and inter-stripe regions of V2 (green). Staining for CO in V2 reveals a typical pattern of thick and thin stripes separated by interstripe regions. Neurons within the thin (blue) and interstripes (yellow) project largely to V4 whereas those within the thick stripes (red) project to both V5 and V3 (it is thought that very few individual neurons project to both V3 and V5 suggesting some functional subdivision within the thick stripes themselves, although see Sincich and Horton (2003) for evidence for such neurons in VI). V3, V4 and V5 also receive direct projections from VI that bypass V2 (black arrows). The direct projections to V3 and V5 come from cells in layer 4B of VI whereas those to V4 come from the blob regions in the upper layers. We have only shown the main connections between these areas in this diagram; there are many more interconnections between all these regions (with the notable exception of between V4 and V5) and in general any visual area is able to access whatever information it needs to perform its task (Zeki and Shipp, 1988).
1.2.1. The motion system
Areas of the primate brain containing neurones selective for the direction of
motion of a stimulus were first discovered by Hubei and Wiesel (1965), although they
did not realise the significance of their finding, as it did not fit with their model of the
visual system. The first identification of a motion selective area came from Dubner
and Zeki (1971) in the macaque. This region was termed V5 (as this region was
thought to contain the fifth representation of visual space). This area is sometimes
referred to as MT (middle temporal) as later studies of motion selectivity in the owl
monkey discovered a homologous region to V5, which had already been named in a
retinotopic mapping study (Allman and Kaas, 1971). We shall refer to this area as V5
below as we shall discuss only macaque physiology and anatomy.
The main inputs to V5 come from the thick stripes of V2 (Shipp and Zeki,
1989), which in turn receive their inputs largely from the interblob regions of V I. The
thick stripes also contain neurons that project to V3 (Figure 2). This pathway is
derived largely from the colour-blind M pathway (Livingstone and Hubei, 1988),
however there are also significant inputs from the P pathway through cross-connections
within VI and V2 (Rockland and Lund, 1983; Rockland, 1985; Lund et al, 1993; Levitt
et al, 1994; Callaway, 1998). These cross-connections mean that V5 neurons are able
to respond to motion generated from equiluminant colours (Charles and Logothetis,
1989; Saito et al, 1989; Dobkins and Albright, 1994; Gegenfurtner et al, 1994;
Seidemann et al, 1999), although the proportion of cells responding to such a stimulus
is dramatically reduced. This reduction is probably the underlying cause of interesting
perceptual effects in the human such as motion slow-down for equiluminant stimuli
(Cavanagh et al, 1984). Studies of V5 have shown that over 90% of neurons in this
region have some degree of direction tuning, indicating the extreme motion sensitivity
of this area. The link between neural firing in V5 in the macaque and motion
discrimination performance has been beautifully demonstrated in pioneering
experiments by Britten, Newsome, Shadlen and Movshon (Newsome et al, 1989;
Britten et al, 1992; Britten et al 1996), showing that individual neurons in MT (V5) are
at least, if not more, sensitive to the direction of motion of a stochastic motion signal
than the monkey. This suggests that a monkey’s perceptual decision may rely directly
on a small population of neurons in area V5.
The identification of the centres of the human brain involved in motion
detection begins with the discovery of a patient with bilateral damage to her lateral
occipto-temporal cortex who had severely impaired motion perception (Zihl et al,
1983), a condition termed cerebral akinetopsia by Zeki (1991b). She had some limited
movement perception in the central parts of her visual fields, provided the speed o f the
stimulus did not exceed 10 deg/s but her ability to discriminate the direction of motion
was very limited (Shipp et al, 1994). The site of the brain damage of this patient
coincides with the brain activations produced by motion versus static stimuli (Zeki et al
1991a; Watson et al 1993; Tootell et al 1995a), although the lesion was very large and
extended into other regions. This area, which has been named V5 (Zeki et al, 1991),
and is also known as MT+ (Tootell et al, 1995a), responds well to illusory motion
(Zeki et al, 1993), and to motion after-effects (Tootell et al, 1995b). But see Huk et al
(2001) for a different interpretation of these findings. It also responds well to motion
defined by equiluminant colours (ffytche et al, 1995). Its location has been confirmed
found at the junction of the ascending limb of the inferior temporal sulcus and the
lateral occipital sulcus (Figure 3), mostly buried in the sulcus of the ascending limb
(Dumoulin et al, 2000). Many authors suggest that V5/MT is a complex of at least two
distinct areas, MT and MST. This idea was based purely on assumed homology
between human and macaque, but several authors have demonstrated subdivisions of
the V5/MT+ complex (Howard et al, 1996; Dukelow et al, 2001; Huk and Heeger,
2002).
V5
Lateral Occipital Sulcus
Inferior Temporal Sulcus
Figure 3. The position of V5 in the human brain. The blue shading indicates the position of V5; it is normally buried in the ascending limb of the inferior temporal sulcus at the point where it meets the lateral occipital sulcus.
V5 is by no means the only area of the visual brain activated by motion. All
areas of the V3 complex are activated by both first and second order motion stimuli
(Smith et al, 1998). Some studies show V3A as more motion sensitive than V3
(Tootell et al, 1997) whereas some show the opposite effect (Smith et al, 1998), The
latter study also shows motion sensitivity in a further subdivision o f the V3 complex,
V3B. In the macaque, neurons selective for the direction o f motion of the stimulus are
found as early as VI (Hubei and Wiesel, 1968) and their responses may be based on the
orientation cue provided by integrating motion over time (Geisler et al, 2001). There
can however, be little doubt that V5 is the motion processing centre par excellence in
the visual system. Whether this means that area V5 is directly responsible for the
perception of motion (Zeki and Bartels, 1999) is a matter o f debate. Micro-stimulation
experiment in monkey V5 have shown that the perceptual decision of the monkey can
be biased by stimulating directionally selective cells in monkey V5 and given the
wealth of imaging data implicating V5 in motion-related tasks and the studies of
akinetopsia reviewed above it seems that V5 undertakes the processing that, in some
way, leads to our perception o f motion.
1.2.2. The colour system
The processing of colour by the human visual system is a subject o f much more
controversy than that of motion processing, with evidence for achromatopsia, an
inability to see the world in colour, being dismissed by various authors for well over a
century (see Zeki, 1990b for a review). The search for a human colour centre was
triggered by the work of Zeki studying the physiological properties of neurons in
macaque pre-striate cortex. Zeki (1973) found an area o f cortex, containing the fourth
visual map, in the preluneate sulcus containing neurons that responded specifically to
colour. Meadows’ review of published cases o f achromatopsia in humans showed a
consistent pattern of damage to the fusiform and lingual gyri suggesting homology
between human and monkey (1974). Further evidence for a human colour centre was
provided with the development of the positron emission tomography (PET) brain
imaging technique. The first brain imaging study to address the issue o f colour vision
came from this lab in 1989 (Lueck et al). This PET study revealed a region of the
lingual gyrus that was more active when subjects viewed coloured abstract scenes
(named Mondrians after the art of Piet Mondrian) than viewing the same abstracts in
black and white. This area was named V4 as it was assumed to be the homologue of
the macaque colour vision centre. More recent fMRI imaging experiments have shown
Zeki, 2000) and that V4 itself is retinotopically mapped, containing complete
representations of the two quadrants of the contra-lateral hemifields (McKeetfy and
Zeki, 1997; Wade et al, 2002). Other early PET studies (Gulyas et al, 1994b) came to
a different conclusion. Their studies found that many areas throughout the brain were
involved in colour discrimination. But these studies were poorly controlled for task
and for attention, and a re-analysis o f this data using more standard statistical
techniques (Frackowiak et al, 1996), found activations for colour stimuli versus black
and white stimuli in the lingual gyrus at the location of V4 and were in agreement with
the Lueck et al (1989) study. Recently however, some authors have revived the view
that colour is processed by a distributed system (Gegenfurtner, 2003, see below).
Further discussion over whether V4 was the site of colour processing in the human was
triggered by the study of Hadjikhani et al (1998) claiming to have found a new colour
centre, V8. The main claim of this study was based on the interpretation of retinotopic
maps. Their interpretation was that human V4 is split into dorsal and ventral sub
divisions as in the monkey. They proceeded to describe area ‘V4v’, which has only a
quarter-field representation o f the visual scene, although no evidence was found (or has
ever been found) for the existence of a dorsal V4. They then claimed that there exists a
full hemifield representation beyond V4v that was colour sensitive, they named this
‘new’ area V8. More careful analysis of their retinotopy and a subsequent study (Wade
et al, 2002) has revealed that V4 has a full hemifield representation that lies in exactly
the same location as V8. This discovery is inconsistent with the idea of V4v indicating
that V4v (and by implication, V4d) is an ‘improbable area’ (Zeki, 2003b). The true
explanation of these findings is that the colour sensitivity measured by Hadjikhani et al
was, in fact, that of V4.
The detailed anatomy of the colour systems o f the brain (Figure 4), determined
largely in the monkey, reveal a pathway taking inputs mainly (but not entirely) from
the P pathway, through the CO blobs in VI to the thin stripes and interstripes of V2
onto V4. V4 is thought to be the main centre for colour vision in the brain from the
evidence of the studies described above. V4 receives projections from the thin stripes
of V2; it also receives projections from the interstripes o f V2 and direct projections
from the CO blobs of VI (Zeki, 1973; Zeki, 1977; Zeki, 1978a; Nakamura et al, 1993).
V 4 a ( r ) ^ _ j M ^ - 7 ^ | ^ V4a(r)
V4„
V 4 ( r ) ^ ' # #
Figure 4. A view of the ventral surface of the brain showing the position of V4 and V4a. The red colour indicates regions responding to colour in the upper hemifield and the green colour indicates those responding to the lower hemifield. (Bartels and Zeki, 2000).
The most compelling evidence for the role of V4 in colour vision comes from
studies of colour constancy. Colour constancy is the ability the primate visual system
to generate the same colour regardless of how the surface is illuminated. The brain
achieves this by taking ratios between the amounts of light reflected in different
wavebands (which does not change with illumination) and using these ratios to
generate a colour. This theory is the basis of the Retinex theory of colour vision
proposed by Edwin Land (Land, 1974). Therefore wavelength and colour are two
different properties, as can be observed in lesion studies. Lesions to V4 in monkeys
impairs the ability of the monkey to make colour judgements, but the animal's
wavelength discrimination remains qualitatively similar, although the thresholds for
discriminating between different wavelengths are raised (Heywood et al, 1992.
Although this is not the author's interpretation; see below). Similar results are
described in a patient study by Kennard et al (1995). In this study a patient with
bilateral cortical lesions to the fusiform and lingual gyri, the location of V4, had raised
thresholds for discriminating between different wavelengths. They also found that the
patient changed the name he attributed to a surface colour when the illuminant was
changed, indicating a loss of the mechanisms of colour constancy.
Electrophysiological studies of V4 in the macaque have shown that it contains neurons
that respond to the constant colour of a stimulus regardless of the wavelength of light it
with cells being driven by the wavelength in their receptive field, regardless of the
colour o f the surface (Zeki, 1983b, Zeki, 1983c). Similarly a recent study (Moutoussis
and Zeki, 2002) has found that colour constant cells are not found in the thin stripes of
V2, although a recent study by Wachtler et al (2003) has suggested that VI neurons
may be colour selective in the macaque, although the colour tuning reported was
extremely weak.
The studies described above seem to leave little doubt that area V4 is the centre
of colour vision in both man and monkey. But this view is still under contention from a
number o f studies that claim that V4 is more involved in the processing of form.
Anatomical studies of V2 suggest that form (orientation) and colour signals are
segregated according the cellular compartments as revealed by staining for CO, with
the thin stripes containing mainly colour-selective neurons and the thick- and inter
stripe regions containing mainly orientation selective neurons (Shipp and Zeki, 2002;
Gegenfurtner et al, 1996; Gegenfurtner, 2003). These authors differ in their
interpretation with Shipp and Zeki stating that whilst “...these properties (colour and
orientation selectivity) are not absolutely segregated...thin stripes show a clear
negative correlation (between colour and orientation selectivity)” whilst Gegenfurtner
states that “...at the functional level, there is no evidence for segregation”. The
difference between these two views is crucial as a lack of segregation in V2 implies
that V4, which receives the majority of its projections from V2 (but also foveal VI),
may not be specialised for colour but rather colour and form. Infact the pattern of
results from both studies are very similar. If one looks at the distribution of cells tuned
for colour, orientation and direction across the cell compartments then the same pattern
is observed in both studies. In the Gegenfurtner study the distribution is just under the
threshold o f being significantly different from a random assortment of functions across
the cell compartments, whereas in the Shipp and Zeki study there is a clear, significant
assortment of different functions to different cell compartments. Taking the results
from both studies together it appears that there is segregation o f function in V2. The
lack of significance in the Gegenfurtner study may have been due to differences in the
way cells were assigned to the different stripe compartments (not an easy task), but as
no details were given to how this was done in this study we cannot comment.
Gegenfurtner also ascertains that V4 may not be the only area specialised for
colour processing and may in fact not he specialised for colour processing at all, but
rather for form and the assignation of a colour to a form. Similar arguments have been
made in the past by other authors (Heywood et al, 1992). The reasons behind this
claim are firstly that electrophysiological studies have shown that V4 neurons show
some selectivity for orientation (Desimone and Schein, 1987), although the bandwidth
of the cells’ tuning is much larger than in earlier visual areas suggesting a lack of fine
orientation discrimination. This form (orientation) selectivity has been confirmed
using optical imaging techniques (Ghose and Ts’o, 1997). Secondly lesions of V4 in
the monkey have been claimed to have little effect on colour processing, instead colour
sensitivity was disrupted by more anterior lesions (Heywood et al 1992). On closer
inspection of these studies it can he seen that whilst wavelength discrimination remains
intact after lesions of V4, colour constancy is disrupted (Walsh et al, 1993). Therefore
the claim by Heywood et al that V4 is not involved in colour discrimination is false.
The lack of disruption of wavelength sensitivity is entirely consistent with the known
wavelength sensitivity o f cells in earlier visual areas such as VI and V2 which are
unaffected by the V4 lesion (Kulikowski et al, 1994). Therefore we can confidently
state that area V4 is the cortical site for the generation of constant colours in both
monkey and man. The response of V4 to form is more unclear. This confusion may
result from differences between monkey and human V4. Whereas monkey V4
undoubtedly shows some specialisation for form, no convincing demonstration for
form selectivity has been made in humans. This issue is still a matter of much debate
and the relationship between form and colour processing in humans remains unknown.
On the basis o f current evidence it seems that form processing in humans may he the
domain of the lateral occipital complex (see below) with V4 being entirely specialised
for colour processing.
1.2.3. The form system
Before discussing the form system we must be clear about the terms we use.
The term ‘form’ is generally applied to any independent, spatial region that can be
form can be broadly divided into studies of orientation in early visual areas and studies
of shapes and objects in later visual areas. Implicit in these studies is the idea that
oriented lines are the building blocks for more complex forms, and therefore cells tuned
for orientation are part of the form hierarchy. It should be borne in mind that no good
evidence to support this assumption currently exists, so one must wary of inferring
much about the form system from observations of orientation using in early visual
areas.
The processing of form in the human is associated with the “ventral stream”, a
set of areas in the temporal lobes and on the ventral surface of the brain (Goodale et al,
1991). The reasoning behind this association stems largely from studies of patients
(and monkeys) suffering from lesions in the inferior temporal cortex and fusiform gyri
who have object agnosias, i.e. difficulty recognising objects (Goodale et al, 1991;
Goodale et al, 1994; Dean, 1982; Weiskrantz and Saunders, 1984). From
electrophysiological and anatomical studies in macaque the processing of simple forms,
shapes and objects is thought to occur in a form system beginning in VI with the
extraction o f local orientation. Cells with larger and more complex receptive fields can
then be built by integrating the responses of VI cells as one progresses through to V2;
for instance in V2 there are cells which respond to the illusory edges of a Kanizsa
triangle (von der Heydt et al, 1984). After V2 the picture becomes more complex.
Many studies have shown orientation selectivity in V3, V3A and V4 suggesting these
areas may play some role in the extraction of form (Zeki, 1978b; Desimone et al, 1985;
Desimone and Schein, 1987; Gaska et al, 1988). Anterior to these areas many studies
have shown neurons tuned to extremely complex features in the inferior temporal (IT)
cortex (Miyashita, 1993; Tanaka, 1996; Logothetis and Shinberg, 1996) including
neurons with preferences for faces (Perret et al, 1982; Desimone et al, 1984). The
receptive field sizes of these neurons are extremely large, sometimes covering an entire
hemifield (Gross et al, 1969, 1972; Desimone et al, 1984; Kobatake and Tanaka, 1994;
Op de Beeck and Vogels, 2000; DiCarlo and Maunsell, 2002). It is these areas that are
thought of as classical “object-selective” areas that may be the homologues of the
regions damaged in humans suffering from visual object agnosias.
Figure 5. The location of the lateral occipital complex (LOC). The rough location of the LOC shown in relation to V5 (red). The LOC itself may be subdivided into two separate regions: LO (green) and LOa/pFs (blue). LOa/pFs overlaps with the face responsive fusiform face area.
The first brain imaging studies of form perception in humans (Haxby e t al,
1991) found that the lateral occipito-temporal cortex was activated by a dot matching
and face matching paradigm and that the face matching paradigm specifically activated
a more anterior and ventral region, which has since been dubbed the fusiform face area
(Kanwisher et al, 1997). Later studies defined a specific region of lateral occipito
temporal cortex entitled the lateral occipital complex (LOC) which is specifically
activated by shapes and objects compared to texture (Malach et al, 1995; Kanwisher et
al, 1996) and is able to respond to objects regardless of how the object is fornied (Grill-
Spector et al, 1998; Grill-Spector et al, 1999, Kourtzi and Kanwisher, 2000). The LOC
is a large area running from just posterior to V5, antero-ventrally down the lateral
surface of the brain onto the ventral surface and anteriorly along the ventral surface up
to and including the fusiform face area (Figure 5). This large area undoubtedly consists
of smaller sub-regions and a possible subdivision along a postero-dorsal/antero-ventral
axis has been proposed by Grill-Spector et al, 1999 (see Discussion). In their study
Grill-Spector et al demonstrated that this area contains neurons that are invariant to the
size of the object or the viewpoint from which the object is seen, properties essential
for a working model of object recognition.
There is currently much debate about the organisation of form sensitive areas.
One view is that areas are organised according to the category of object (Spiridon and
(Kanwisher et al, 1997), for places in the para-hippocampal place area (Epstein and
Kanwisher, 1998) and the human body in the lateral occipito-temporal cortex
(Downing et al, 2001). Objects that do not fall into one of these categories are
processed in an unorganised fashion by the lateral occipital complex. The alternative
view (Ishai et al, 1999; Haxby et al, 2001) is that objects are processed in a distributed
manner across a relatively large expanse of cortex with the pattern o f activity changing
according to the category of the object. The experiments o f Lemer et al (2001) suggest
a hierarchy of form processing similar to that seen in the monkey with the more
posterior areas, including V4, being sensitive to object fragments and more anterior
areas (such as LOC) having more holistic representations o f objects. However, the
question of whether objects are represented in categorically organised regions or in a
distributed fashion remains to be answered.
1.3. Integration and the binding
problem.
In the previous presiding theory of the functioning o f the primate visual system,
as proposed by Hubei and Wiesel (1968, 1977), the visual system was thought to be
arranged as a hierarchy. Each subsequent level of the hierarchy re-represented the
information from the previous level, but a higher level o f complexity. In this view each
different attribute of the visual scene is processed in every visual area. This meant that
the problems of integration and binding in the visual system never arose. The theory of
functional specialisation (Zeki, 1978a) was a revolutionary new theory, which provided
an explanation for many more observations. This theory also raised important
questions about how different functionally specialised systems interact with one
another and how the brain deals with information that is held in several anatomically
separate areas. These questions are at the heart of the problems of integration and
binding in the visual system. The terms integration and binding have been used in an
interchangeable fashion throughout the literature. To avoid the confusion this
invariably produces we shall discuss four problems with strict definitions:
1) Figure-ground segregation: the use of different types of information to guide the
segmentation of an image into figure and background.
2) Cue integration: The use of the many different attributes that define form in the
visual scene to improve the ability of our visual system to discriminate a form from its
background.
3) The binding problem: the problem of how the many different properties that belong
to objects, such as surface colour, or direction of motion, are associated with the correct
object.
4) The unity consciousness: why is our perception that o f a unified, coherent world
1.3.1. Figure/ground segregation
How are neural representations of the foreground object different from the
neural representations of the background? This problem, also known as parsing
(Treisman, 1999) or image segmentation (Moller and Hurlbert, 1996; 1997), can be
rephrased as: how does the brain know which areas of the visual scene belong to the
same object?
This problem was first addressed by the Gestalt psychologists of the 1930s (for
review see Watt and Phillips, 2000) who determined a set o f rules for grouping features
into an object. These rules such as colinearity, common fate, proximity, and common
features (e.g. same colour, depth etc) amongst others, determine how we group low-
level features together to segregate the visual scene into different objects. The neural
mechanisms that underlie these rules are still to be fully examined, although it is
commonly assumed that these processes occur at an early stage (for review see von der
Malsburg, 1995), the most commonly cited region being the primary visual cortex (Li,
1998). In the context of this thesis, it is interesting to note that different cues can be
used for image segmentation and there are interactions between these cues. Moller and
Hurlbert (1996, 1997) have found that motion is a strong cue for segmentation o f an
image into different regions and that motion signals guide segmentation by colour in a
facilitatory fashion. In a similar fashion Croner and Albright (1997) have found that
colour signals can be used to improve the detection of a motion signal. These studies
suggest that the mechanisms that segment an image into separate regions rely on
interactions between different cues but the mechanisms o f these interactions remain
unknown.
Whichever mechanisms the brain uses to separate the visual scene into different
objects the question remains as to how the neural representation o f the object is
different from the background or other objects. One influential theory is that
synchrony between the firing of separate neurons may be used as a code to ‘bind’
neurons responding to the same object (Milner, 1974; von der Malsburg, 1981). This
idea is supported by experiments (Gray and Singer, 1989), which demonstrate that
neurons in area 17 of the cat's visual cortex synchronise their firing at a rate o f 30-50Hz