Population Change in Nepal: A Comparative Study between
Census 2001 and 2011
Basanta Dhakal,
Associate Professor
Tribhuvan University, Nepal Commerce Campus, Kathmandu, Nepal
Abstract:
This paper tries to compare the demographic parameters between the National Census years 2001and 2011 and to find growth rate, sex ratio, percentage change of population on the basis of ecological belt, development zone, urban-rural area, and age-sex composition during the census year 2001 to 2011. It also tries to analyze exponential growth and population density from first census 1911 to last census 2011. It is found that the maximum percentage change of population in Terai region is19.07% but it is the least in Mountain i.e. 6.37%. It is the maximum in central development region which is 20.94% and minimum in western development region i.e.8.19%. Similarly, the percentage change of population in urban and rural area is 40% and 10.89% respectively. The age dependency ratio is 67.17 in the census 2011 where as it observed 84.68 in the census 2001. The sex ratio is 94.14(males per hundred females) in 2011 but it was 99.8 in 2001.The population density is changed from 157.30 square kilometer to 181.00 square kilometer during the census 2001 to 2011. This study expects that the findings of this paper may facilitate the planners and decision makers to formulate the population policies and programs for people of the nation regarding economic, social and political decision.
Keywords
Introduction
The literal meaning of population is the whole number of people or inhabitants in a country or region. Population change is the difference of population size between the end and beginning of a time period. A census of population is the total process of collecting, compiling, evaluating, analyzing and publishing demographic, economic and social data pertaining, at a specific time, to all persons in a country or well – delimited part of a country (Bhende & Kanitkar,2010:29). So it is the oldest statistics of all statistics collected by nation. Even in the ancient days, when statistical organizations were not developed and human race was comparatively less civilized, leaders of the tribes estimated their manpower to protect themselves and their group from other tribes. At that time leaders of tribes wanted to grow their population for safety of property, people and nation (Singh & Saymi, 1990:1). However, population growth has become major problem in the present world. This problem is hindering development of the world. It is not just a problem of a country. Now days, population growth is common problem of all countries.
The effects of over population are evident in the increasing poverty, unemployment, air and water pollution and shortage food, health resources and education resources. Currently, Nepal faces a vicious cycle of population increase due to poverty. The people, who have struggled to make two ends meet, produce more children because more children means more earning hands. The infant mortality rate among in poor family is higher due to the lack of facilities like food and medical resources. Thus, they produce more children assuming that not all of them could be able to survive, that results into population growth. Due to the increase of population, the problems of scare resources, jobs and poverty increases. If poverty and population both increase simultaneously, the development of the country and society will far-fetched.
In Nepal, the constitution of the Kingdom of Nepal (1990) had given the importance of the population census. According to it, the number of seats of House of Representative from each of the 75 administrative districts is determined on the basis of population census. So, population census is one of the largest statistical operations in Nepal. The 2011 census marked 100 years of population counting in Nepal, during these 100 years, the population of country grew phenomenally. In 1911, the population of Nepal was 5,638,749 which increased more than four times and reached 26,620,809 in 2011(Bastola and GC, 2003).
Nepal has experienced a very high unemployment rate and underemployment rate that compelled people to remain under the vicious cycles of poverty that resulted to involve in the process of migration to other places within and outside the country for looking better opportunities of livelihood (Aryal, 2013). Social scientists and researchers have been tried to search the solution of complex problems like hunger, poverty, illiteracy and other socio economic problems facing the human beings of third world countries due to high rate of population growth, limited land and natural resources, low level of literacy, a large percentage of unskilled dependent man power, agro- based economy and land locked geography.
Nepal, being a developing country, has had to face several economic and political challenges. One of the most important problems is the over population. Some of the reasons for over population are poverty, excess of medical facilities and migration from neighboring countries from India, Bhutan and Tibet. Although, the rate of increase has decreased, the rate has not reached the satisfactory level yet. The population in Nepal constitutes to increase at an alarming threat. In this respect, it needs to study the population change in Nepal, which may help to planners for making policiesregarding economic, social and political decision. In this context, this paper attempts to investigate the comparative study between the population change of census year 2001 and 2011 on the basis of ecological belt, development region, and place of residence, gender and age.
Materials
and Methods
All analysis and discussion have been based on published source of secondary data such as National Population and Housing Census 2011, Statistical Year Book of Nepal 2011, Nepal in Figure (2010) and National Demographic Health Survey (2011), Preliminary Results of National Population Census 2011 and other related materials. Population in 2001 and 2011 are the main variables of this study. Some demographic statistics such as sex ratio, percentage change, age dependency ratio and exponential growth are used to compare the demographic parameters between the National Censuses 2001 and 2011.
Exponential growth is an increase in number or size at constantly growing rate.
Exponential growth, Pt=Poer (1)
Where Pt = population at current year, Po = population at base year, t = time interval between Po and Pt, r = the growth of population and e = exponential constant value is equal to 2.71828.
The concept of ratio has also been used to measure the percentage change “before” and “after” the intervention.
Percentage change = 𝐴𝑓𝑡𝑒𝑟 𝑣𝑎𝑙𝑢𝑒
𝐵𝑒𝑓𝑜𝑟𝑒 𝑣𝑎𝑙𝑢𝑒 − 1 × 100
(2)
Sex ratio = 𝑃𝑃𝑚
𝑓 × 100 (3)
Where Pm= population of male, Pf = population of female
Age dependency ratio is defined as the ratio of the combined child population and aged population to the population of the intermediate ages.
Age dependency ratio == 𝑃0−14𝑃 +𝑃60+
15−59 × 100 (4)
Where P 0-14= population under the age 15 year, P 60+= population in the age 60 and over, and
P 15-59 = population of intermediate age.
Results and Discussions
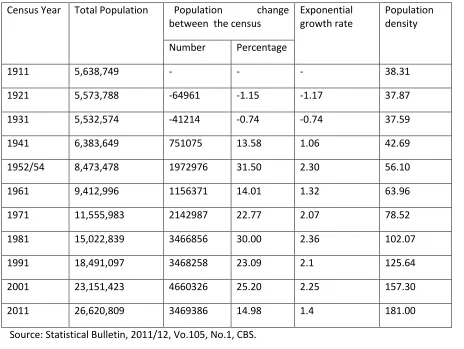
The history of Nepalese census is not so long, it has crossed only a century. At the first time, the National Census was taken in the year 1911.After that it has been taking every ten year interval. The population of Nepal in the first census year 1911 was 5,638,749. The following table shows the population of Nepal from first to last census year.
Table 1: Population Census in Nepal
Census Year Total Population Population change between the census
Exponential growth rate
Population density
Number Percentage
1911 5,638,749 - - - 38.31
1921 5,573,788 -64961 -1.15 -1.17 37.87
1931 5,532,574 -41214 -0.74 -0.74 37.59
1941 6,383,649 751075 13.58 1.06 42.69
1952/54 8,473,478 1972976 31.50 2.30 56.10
1961 9,412,996 1156371 14.01 1.32 63.96
1971 11,555,983 2142987 22.77 2.07 78.52
1981 15,022,839 3466856 30.00 2.36 102.07
1991 18,491,097 3468258 23.09 2.1 125.64
2001 23,151,423 4660326 25.20 2.25 157.30
2011 26,620,809 3469386 14.98 1.4 181.00
Table 1 shows the population percentage change between the censuses 1911 to 1921 is decreased by 1.15 percent but it is increased between the censuses 2001 to 2011 by 14.98 percent. Similarly, the population growth rate is negatively projected at the first three decades then it is continuously in a positive way. The country’s annual population growth rate is just 1.4 percent in 2011 as against 2.25 percent in 2001. There is drastic changed in population density of the country. In 1911, the population density of the country was less than 39 persons per square kilometer.By, 2011; the figure has risen to 181 persons for the same area.
Figure 1: Population Trend in Nepal
Figure 1 indicates that growth rate was always recorded over two percent between 1971 and 2001. Nepal’s population has seen negative growth rates twice. The first and second census had shown negative growth rates of 0.12 and 0.07 percents respectively.
The population growth rate had never declined to less than two percent in Nepal since1961. For the first time in the last 40 years, few babies are born and more people are either dying or migrating, especially outside Nepal. The decreasing rate of population growth is a very positive aspect for Nepal. This has revealed Nepal’s increasing education level and awareness.
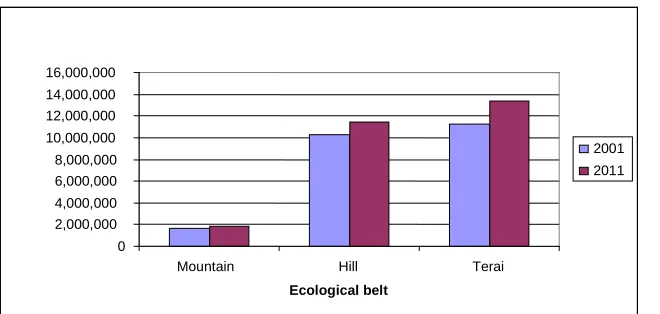
Ecologically, Nepal is divided into three regions, running east to west. They are mountain, hill and terai. The population is 1,795,354 in the mountain; 11,475,001 in the hill and 13,350,454 in the terai. The population is distributed over the three regions are shown in the following table:
0 5,000,000 10,000,000 15,000,000 20,000,000 25,000,000 30,000,000
1911 1931 1951 1971 1991 2011
Year
Table 2: Population Change by Ecological Region
Region
Population
Growth rate Sex ratio Population change
between the census
2001 2011 2001 2011 2001 2011 Number Percent
Mount. 1,687,859 1,795,354 1.57 0.62 98.2 94.0 107,495 6.37
Hill 10,251,111 11,475,001 1.97 1.13 96.3 92.0 1,223,890 11.97
Terai 11,212,453 13,350454 2.62 1.74 104.4 97.0 2,138,001 19.07
Source: National Population and Housing Census 2011, CBS.
Table 2 shows that Terai constitutes 50.15 percent of the population, hill and mountain constitute 43.1 percent and 6.75 per cent respectively. The growth rate of population in terai, hill and mountain regions have 1.74; 1.13 and 0.62 respectively in 2011 but it was 2.62; 1.97 and 1.57 in 2001.The sex ratio of terai, hill and mountain regions are 97.0; 92.0 and 94.0 respectively but it was 104.4; 96.3 and 98.2 in 2001 respectively. The percentage change of population in terai region is 19.07% whereas it is 11.97% in hill and 6.37% in mountain. The population change by ecological region can be shown in the following figure:
Figure 2: Population Change by Ecological Belt
Figure 2 indicates that the population is highly increased in Terai region from 2001 to 2011 in comparison to other ecological regions.
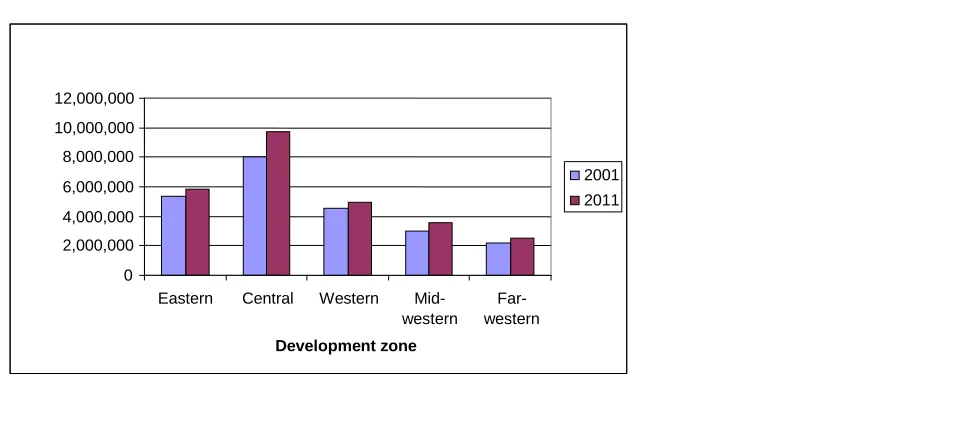
Nepal is divided into five administrative development regions. Central development region has the highest population and far-western region has the lowest population. The population is 5,834,128 in eastern, 9,713,702 in central, 4,945,190 in western, 3,584,586 in mid-western and 2,543,349 in far-western region in the census year 2011. The population changes by development region can be shown in the following figure:
0 2,000,000 4,000,000 6,000,000 8,000,000 10,000,000 12,000,000 14,000,000 16,000,000
Mountain Hill Terai
Ecological belt
Table 3: Population Change by Development Region
Development region
Population
Growth rate Sex ratio Population change
between the census
2001 2011 2001 2011 2001 2011 Number Percent
Eastern 5,344,467 5,834,128 1.84 0.88 99.9 93.0 489,661 9.16
Central 8,031,629 9,713,702 2.61 1.90 104.8 100.0 1,682,073 20.94
Western 4,571,013 4,945,190 1.9 0.79 92.6 87.0 374,177 8.19
Mid-western 3,012,975 3,584,386 2.26 1.74 99.2 93.0 571,711 18.97
Far-western 2,191,330 2,543,349 2.26 1.49 98.2 92.0 352,019 16.04
Total 23,151,423 26,620,809 2.25 1.40 99.8 94.4 3,469,386 14.98
Source: National Population and Housing Census 2011, CBS.
Table 3 shows that 21.9% of total population lies in the eastern region, 36.5% in central region, 18.6% in western region, 13.5% in mid western region and only 9.6% in far western region in 2011 whereas 23.1% of total population lies in eastern region, 34.7% in central region, 19.7% in western region, 13% in mid western region and 9.7% in far western region in 2001. The growth rate of population is 0.88, 1.90, 0.79, 1.74, and 1.49 in eastern, central, western, mid-western and far western development regions in 2011 whereas it is 1.84, 2.61, 1.90, 2.26 and 2.26 respectively in 2001. The percentage change of population is 9.16% in eastern, 20.94% in central, 8.19% in western, 18.97% in mid-western and 16.04% in far-western development region from 2001 to 2011. The population changes by development regions can be shown in the following figure:
Figure 3: Population Change by Development Zone
0 2,000,000 4,000,000 6,000,000 8,000,000 10,000,000 12,000,000
Eastern Central Western Mid-western
Far-western
Development zone
Figure 3 indicates that central development region is the most densely populated with 9.71 million holding 36% of the overall population, while the far western region remains the least populated with 2.5 million people making 9.6% of the total population.
The total number of people is 4,525,787 in urban area and 22,095,022 in rural area in the census year 2011 whereas the figure was 3,227,879 and 19,923,544 in the census year 2001.
Table 4: Population by Place of Residence
Place of Residence
Population
Growth rate Sex ratio Population change
between the census
2001 2011 2001 2011 2001 2011 Number Percentage
Urban 3,227,879 4,525,787 6.65 3.38 98.8 92.0 1,297,908 40.00
Rural 19,923,544 22,095,022 1.72 1.03 106.4 104.0 2,171,478 10.89
Total 23,151,423 26,620,809 2.25 1.40 99.8 94.4 3,469,386 14.98
Source: National Population and Housing Census 2011, CBS.
Table 4 shows that urban population is increased by 3.1 percent and the rural population is decreased by 3.1 percent from census years 2001 to 2011. Similarly 17% of total population resides in urban areas and 83% in rural areas in 2011 where as 13.9% of total population resides in urban areas and 86.1% in rural areas in 2001. The population growth rate is 3.38 in urban area and 1.03 in rural area in 2011 but this figure was 6.65 in urban area and 1.72 in rural area in 2001. The sex ratio is 92.0 in urban area and 104.0 in rural area in 2011 whereas it was 98.8 in urban area and 106.4 in rural area in 2001.the percentage change of the population 40 percent in urban area and 10.89 percent in rural area from 2001 to 2011. The population change by rural-urban areas can be shown in following figure:
Figure 4: Population Change by Rural/Urban Area
Population Change by Urban/Rural Aera
0 5,000,000 10,000,000 15,000,000 20,000,000 25,000,000
2001 2011
Year
P
op
ul
a
ti
on
The urban population is increased by 3.1 percent and the rural population is decreased by 3.1 percent from census years 2001 to 2011.
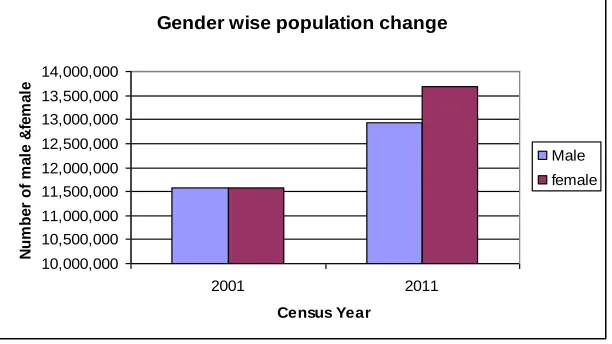
The male population is 12,927,431 and female population is 13,693,378 in the census year 2011 but it was 11,587,502 and 11587502 in the census year 2001. The following table shows the population of male and female in the census year 2001 and 2011.
Table 5: Gender wise Population Change
Gender 2001 2011 Population Change between the census
Population Population Number Percentage
Male 11,563,921 12,927,431 1,363,510 11.79
Female 11,587,502 13,693,378 2,105,876 18.17
Source: National Population and Housing Census 2011, CBS.
Table 5 shows that sex ratio is 94.14(males per hundred females) in 2011 but it was 99.8 in 2001. So the sex ratio is decreased by 5.39 from 2001 to 2011. It means that there is slightly skewed female- to- male ratio with the female population at 51.44 percent against the 48.56 males.
Figure 5: Gender wise Population Change
Figure 5 indicates that the female population in the census year 2011 is significantly increased with compare the census year 2001.
The population of age group between 15 to 59 years is known as economically active, and the people below this age group (0-14 years and 60 and 60+ years) are considered as economically dependent. The following table shows the different age group of population.
Gender wise population change
10,000,000 10,500,000 11,000,000 11,500,000 12,000,000 12,500,000 13,000,000 13,500,000 14,000,000
2001 2011
Census Year
N
um
be
r
of
m
a
le
&
fe
m
a
le
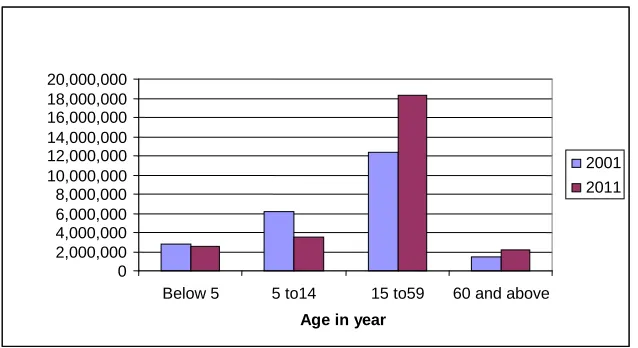
Table 6: Age wise Population Change
Age in year 2001 2011 Population Change between the census
Population Population Number Percentage
0- 4 2,755,213 2,567,963 (-187,250) -6.80
5 -14 6,193,374 3,552,284 (-2,641,091) -42.64
15 -59 12,310,968 18,346,152 6,035,184 49.02
60+ 1,477,379 2,154,410 677,031 45.82
Source: National Population and Housing Census 2011, CBS.
Table 6 shows that age dependency ratio is 67.17 in the census 2011 where as it observed 77.19 in the census 2001.The percentage of population changes in the age group (15 to 59) year and (60 and 60+) are 49.02% and 45.82% respectively. It is decreased in the age group 0-4 year and 5-14 year by 6.80% and 42.64% respectively.
Figure 6: Age wise Population Change
Figure 6 clearly indicates that the economically active population within the age group 15 to 59 years is increased in the census year 2011 in comparison to the past census 2001.
0 2,000,000 4,000,000 6,000,000 8,000,000 10,000,000 12,000,000 14,000,000 16,000,000 18,000,000 20,000,000
Below 5 5 to14 15 to59 60 and above
Age in year
2001
Conclusion
There is maximum percentage change of population in terai region (19.07%) in comparison to hill (11.97%) and mountain (6.37%) regions. The national census 2011 shows that more than 50 percent people habitat in the 17% area (terai). The percentage of population change is maximum in central development region (20.94%) and minimum in western development region (9.19%). Similarly, the percentage changes of population in urban and rural area are 40% and 10.89% respectively.The age dependency ratio is 67.17 in the census 2011 where as it observed 84.68 in the census 2001. The sex ratio is 94.14(males per hundred females) in 2011 but it was 99.8 in 2001.The population density is changed from 157.30 square kilometer to 181.00 square kilometer during the census 2001 to 2011.The population growth rate had never declined to less than 2% in Nepal since 1961 but it is 1.4 in 2011.. Nepal is in the third stage of demographic transition. This stage of characteristics is low death rate and low birth rate as a result of which the population growth rate has slowed down. The decreasing rate of population growth is a very positive aspect for Nepal. Both literates and illiterates people have adopted contraceptive measures. It has revealed Nepal’s increasing education level and awareness about over population. Besides, population growth is low due to the fluctuation in migration trend as well as the growing trend of people to go to abroad for various regions. A huge chunk of population has shifted from agro-based profession to wage-based livelihood where family size is controlled by limited resources for living rather then farming. It means that the family size will further decrease in coming years. There is a slightly skewed in female to male ratio by the cause of birth selective trend of Nepalese people and large number of males going out of the country for employment.
References
Aryal, T.R.(2013). Application of demographic models to investigate levels, differentials and determinants of
fertility of Nepal. Journal of Institute of Science and Technology.18(1):148-156.
Bastola,T. and GC, R.K. (2003).Perspective on population census 2001 of Nepal, Population monograph 2003 of Nepal, Kathmandu: Central Bureau of Statistics /National Planning Commission.
Bhende, A.A. and Kanitkar, T. (2010). Principal of population studies, New Delhi: Himalaya Publishing House.
CBS. (2009). Statistical year book of Nepal, Kathmandu; Central Bureau of Statistics /National Planning Commission.
CBS. (2003). Population monograph of Nepal, Kathmandu: Central Bureau of Statistics /National Planning Commission.
Dhakal B.(2011). Population growth in Nepal : An overview. Management Dynamics.15(1):124-130.
Dhakal, B. (2068). An analysis of present status of Nepalese women, Pragya Pravat, Pokhara: DEPAN-Prithibi Narayan Campus.
NDHS. (2011). National demographic health survey, Ministry of Health, Kathmandu: Nepal Government. Pangeni, R. (2011). Census 2011:26.62 million and counting, The Himalaya, Kathmandu: International
Media Network.
Rai O.A. (2011). Nepal’s population touches 26,6 million, Republica, Kathmandu: Nepal Republic Media. Sharma, N. (2011). Country’s population 26.6m, TheKathmandu Post, Kathmandu: Kantipur Publication Singh,M.L.and Saymi,S.B. (1990). An Introduction to mathematical demography , Kathmandu: Published by