IJEDRCP1502025
International Journal of Engineering Development and Research (www.ijedr.org)1
Automatic Identification ECG Anomalous Using Xml
Data Processing
1
Anusha F.G,2 Jeba Sheela.A
1
PG Student, 2Assistant Professor,
1, 2 Department of Computer Science, 1, 2 DMI College of Engineering, Chennai, India,
________________________________________________________________________________________________________
Abstract - Electrocardiography deals with the recording and study of electrical activity of heart. The electrocardiogram gives details of the state of the heart and any disturbance in the heart rhythm can be diagnosed. The automatic generation of diagnosis report with ECG image that will be a useful innovation to the medical field. The manipulation of diagnosis report with the ECG curve acquires many variations in heartbeat such as irregular, slow, fast and normal. The validation of histogram check is performed to rectify the noise from the input image and the image is tuned up. The tuned up image with enhancement in quality is performed in perfectly. Then the RGB image is converted to the grayscale using the image blending technique for the segmentation process. The Validated ECG sample image has been measured with its height and amplitude to measure the abnormalities using XML ontology. An ontological schema is designed to identify the cardiac predictions of curves and then it is used to map the ontological schema information with the input image. Then disease will be predicted accurately and automatically report will be generated.
Index Terms - Automated ECG Anomalous, Ontology, Validation
________________________________________________________________________________________________________ I.INTRODUCTION
IJEDRCP1502025
International Journal of Engineering Development and Research (www.ijedr.org)2
II. REPRESENTATION AND DIAGNOSISThe HL7 is the health level 7 was used as the exchange and sharing of electronic information. The ontology was developed to represent the ECG waveform data, measurements of the ECG waveforms and the detection of cardiac abnormalities. A.ECG Wave Structure:
The complete waveform is called electrocardiogram with labels PQRSTU. This is indicating important diagnostic features.
Figure I: Standard ECG wave structure
The P wave represents the atrial contraction and normal value of P wave amplitude is 0.25mV and the interval is 0.12 to 0.22 sec. The PR interval represents the time from onset of atrial contraction to onset of ventricular activation. The QRS complex represents the ventricular activation and normal value of QRS complex amplitude is 1.60 mV and the interval is 20 sec. The R wave represents the relaxation of atria contraction of ventricles and normal value of R wave amplitude is 160 mV and the interval is 0.07 to 0.1 sec. The T wave represents the relaxation of ventricles and normal value of T wave amplitude is 0.1 to 0.5 mV and the interval is 0.05 to 0.15 sec. The U wave represents the relaxation of intra ventricular system and normal value of U wave amplitude is less than 0.1 mV and the interval is 0.1 sec. The QT interval represents the duration of ventricular activation and recovery. The P wave, QRS complex and T wave are measured based on the following information given in the table (Table I).
WAVES MEASUREMENTS
P wave Duration
Amplitude P-P Interval
QRS complex Duration
Amplitude R-R Interval P-R Interval
T wave Duration
Amplitude Q-T Interval
Table I: ECG Measurement Properties
B. Health Level 7 Medical Device Communication:
The HL7 is the health level 7 was used as the exchange and sharing of electronic health information. HL7 provides the data dictionary of health information. The health level 7 medical device communication used as the ontology schema. The clinical, financial, and administrative information are there in the HL7 and the HL7 used to address the interface requirements of an entire health care organization.
The HL7 to provide for open systems communication between the medical devices and the patient care information systems. The one of the main use of HL7 is data dictionary for ECG measurements.
C. Ontology Schema:
IJEDRCP1502025
International Journal of Engineering Development and Research (www.ijedr.org)3
The input terms will be provided by the schema and ontology. All kinds of heart beat is considered in the ontology. The waveform structure consists of ECG plots and associated waves. In the wave boundary, start represents the sample number of the starting point of the wave. Peak represents the sample number of the peak point of the wave and End represents the sample number of the end point of the wave.III. SYSTEM MODEL
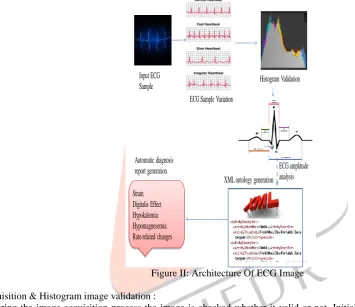
The ECG sample image is extracted and processed. The heart beat conditions such as slow heart beat, fast heart beat, normal heart beat and irregular heart beat is identified. Then the ECG sample image is compared with the heart beat conditions. Then the validation is performed using histogram validation technique for this validation purpose ECG signals are used. Thus the computerized ECG recorders will detect the pathological conditions by utilizing frequency information.
Then the ECG sample will be segmented using Region vs Edge based segmentation algorithm. Then the validated sample image has been measured with this height and amplitude to measure the abnormalities using XML ontology. The validated data are compared with the previous data using ontology. Finally cardiac abnormalities will be detected and ECG report will be generated automatically.
Input ECG Sample
Strain Digitalis Effect Hypokalemia Hypomagnesemia Rate-related changes
ECG Sample Variation
XML ontology generation Histogram Validation
ECG amplitude analysis Automatic diagnosis
report generation
Figure II: Architecture Of ECG Image
A.Image acquisition & Histogram image validation :
During the image acquisition process the image is checked whether it valid or not. Initially the jpeg image involves retrieving images from a source that automatically capture images. To identify whether the image is valid or not a histogram check is performed. The histogram processes under goes various kinds of checks. These checks are based on primary colors such as red, blue and green along with these checks the luminosity check is also performed. Once after performing all these checks then the image is accepted as a valid image and the image is moved in for object extraction.
After the image validation process the image tune up process is performed for the purpose of improving the quality of image. The tuned up image values of height, width, dimension, horizontal resolution, vertical resolution, image pixel format are automatically taken from the input image. The tuned up image with enhancement in quality is performed in perfectly. Then the RGB image is converted to the grayscale using the image blending technique for the segmentation process.
B.Image Segmentation:
The converted grayscale image is performed with segmentation. The ECG sample image is segmented using the boundary value segmentation technique for a set contours extracted from the input ECG image. Then fetch the segmented image to further processing
C.XML Ontology Generation:
IJEDRCP1502025
International Journal of Engineering Development and Research (www.ijedr.org)4
IV. EXPERIMENTAL RESULT AND DISCUSSION:The proposed methodology has been implemented in Dot net using more than 100 ECG images of various sizes are collected and ECG databases are available in Physio Bank, there are totally eight databases provided in it. In previous technique it focuses on diagnosing the 37 cardiac abnormalities by using XML ontology and ontological schema to identify the disease acquired. This technique does not tune-up the image of the ECG before processing as the noise percentage misleads to the diagnose report. In the proposed methodology, an image validation is performed using the histogram validation technique formulated to rectify the noise acquired in the input ECG Image. The Validated ECG sample image has been measured with its height and amplitude to measure the abnormalities using XML ontology. The implemented technique overcomes the problem of false prediction of syndrome by validating the input image using histogram techniques that validates the pixel for further processing.
V. CONCLUSION
The ECG image is taken as the input. This input image is further validated using the histogram validation technique. The validation technique includes noise rectification. Noise is rectified so that we could predict the appropriate disease. The quality is improved by performing tune-up operation, the grayscale conversion is done further using image blending technique. The grayscale conversion is mainly performed in order to focus on clarity of segmentation. Further the image is compared with XML ontology to categories cardiac abnormality. Finally the report is generated for the identified cardiac disease.
REFERENCES
[1].Rami Oweis, Lily Hijazi,” A computer-aided ECG diagnostic tool”, computer methods and programs in biomedicine 8 1 ( 2 0 0 6).
[2].A. L. Goldberger, L. A. N. Amaral, L. Glass, J. M. Hausdorff, P. C. Ivanov, R. G. Mark, J. E. Mietus, G. B. Moody, C. K. Peng, and H. E. Stanley, “PhysioBank, PhysioToolkit, and PhysioNet: Components of a New Research Resource for Complex Physiologic Signals,” Circulation, vol 101(23), e215-e220
[3].N. Hughes, L. Tarassenko, and S. Roberts, “Markov models for automated ECG interval analysis,” Advances in Neural Information Processing Systems 16 NIPS 2003.
[4]. S. S. Mehta, IAENG Member and N. S. Lingayat, IAENG Member,” Detection of P and T-waves in Electrocardiogram”, Proceedings of the World Congress on Engineering and Computer Science 2008 WCECS 2008, October 22 - 24, 2008, San Francisco, USA
[5]. Rodrigo V. Andreão*, Bernadette Dorizzi, And Jérôme Boudy,” ECG Signal Analysis Through Hidden Markov Models”, IEEE Transactions On Biomedical Engineering, Vol. 53, No. 8, August 2006
[6]. Norbert Sram,” An Ontology Model-based ECG Diagnostic Solution”, Óbuda University Doctoral School of Applied Informatics, PhD student Budapest, Hungary.
[7]. S. Kaufman, I. Poupyrev, E. Miller, M. Billinghurst, P. Oppenheimer, and S. Weghorst, “New interface metaphors for complex information space visualization: An ECG monitor object prototype,” in Medicine Meets Virtual Reality: Global Healthcare Grid, San Diego, CA, 1997, pp. 131-140
[8]. Aline Cabasson, Olivier Meste, Member, IEEE, And Jean-marc Vesin, Member, IEEE” Estimation And Modeling Of Qt-interval Adaptation To Heart Rate Changes”, IEEE Transactions On Biomedical Engineering, VOL. 59, No. 4, April 2012. [9]. Barry D. Brown,” HL7 aECG Implementation Guide”, FinalMarch 21, 2005
[10].B. Heden, O. Hans, R. Rittner, and L. Edenbrandt, “Acute myocardial infarction detected in the 12-lead ECG by artificial neural networks,” Circulation, vol. 96, no. 6, pp. 1798–1802, 1997
[11]. Health Level Seven (HL7). [Online]. Available: http://www.hl7.org
[12] .U. Ayesta, L. Serrano, and I. Romero, “Complexity measure revisited: A new algorithm for classifying cardiac arrhythmias,” in Engineering in Medicine and Biology Society, Proceedings of the 23rd Annual International Conference of IEEE, vol. 2, 2001.
[13]. P. Porela, K. Hanninen, T. Vuorenmaa, M. Arstila, K. Pulkki, A. Bredbacka, K. J. Antila, J. Jalonen, H. Helenius, and L-M Voipio-Pulkki, “Computer-assisted electrocardiograhy in structured diagnosis of acute myocardial infarction,” Scandinavian Cardiovascular Journal, vol. 33, no. 2, pp. 89–96, 1999
[14].Draft Standard for Health informatics – Point-of-care medical device communication – Nomenclature, IEEE P1073-1.1.1/d08, pp. 62 - 81, 2003
[15].J. L. Rodr´ıguez-Sotelo · D. Cuesta-Frau, D. Peluffo-Ord´o˜nez · G. Castellanos-Dom´ınguez,” Unsupervised Feature Selection in Cardiac Arrhythmias Analysis”, 31st Annual International Conference of the IEEE EMBS Minneapolis, Minnesota, USA, September 2-6, 2009
[16].Qinghua Zhang*, Alfredo Illanes Manriquez, Claire Médigue, Yves Papelier, and Michel Sorine,” An Algorithm for Robust and Efficient Location of T-Wave Ends in Electrocardiograms”, IEEE TRANSACTIONS ON BIOMEDICAL ENGINEERING, VOL. 53, NO. 12, DECEMBER 2006
IJEDRCP1502025
International Journal of Engineering Development and Research (www.ijedr.org)5
[18].S. S. Mehta, S.C. Sexana, and H.K Verma, “Computer-aided interpretation of ECG for diagnostics,” Int. Journal of System Science,vol. 27, 1996, pp. 43-58.[19].S. C. Saxena, V. Kumar, and S. T. Hamde, “Feature extraction from ECG signals is using wavelet transform for disease diagnostics,” Int.Journal of System Science, vol. 33, 2002, pp. 1073- 1085.
[20].H. Bazett, “An analysis of time relations of electrocardiograms,” Heart,vol. 7, pp. 353–367, 1920.