Article
Modeling and Simulation of Passenger Flow Distribution in
Urban Rail Transit Hub Platform
Long Gao 1, and Limin Jia 2,3,*
1 School of Traffic and Transportation, Beijing Jiaotong University, Beijing 100044, China; [email protected]
2 State Key Laboratory of Rail Traffic Control and Safety, Beijing Jiaotong University, Beijing 100044, China
3 Beijing Research Center of Urban Traffic Information Sensing and Service Technologies, Beijing Jiaotong University, Beijing 100044, China
* Correspondence: [email protected]; Tel: +86-152-0132-8873
Abstract: Urban rail transit hub platform is the most important area for passenger flow distribution. In order to calculate passenger flow volume in platform and evaluate platform service level during rush hours, this paper presents a method for modeling and simulation of passenger flow distribution in platform. Passenger flow distribution model (PFDM) is proposed based on the basic analysis and the superposition principle of passenger flow. Simulation design for PFDM is proposed by Anylogic, which contains simulation process and simulation model. Experiment results show that PFDM and simulation design are effective and accordant with the reality scenario, and the simulation precision is comparatively ideal. This research could provide a beneficial reference for train scheduling and operation management under the viewpoint of traffic safety and service level.
Keywords: passenger flow distribution model; simulation design; performance evaluation; passenger flow volume; service level; urban rail transit hub platform
1.Introduction
In recent years, urban rail transit has become the main mode to ease traffic congestion. For an urban rail transit hub, the platform is the most important area for passenger flow distribution. Passenger flow volume in platform is the fundamental and crucial data for train scheduling and operation management under the viewpoint of traffic safety and service level. In order to calculate passenger flow volume in platform and evaluate platform service level during rush hours, this paper tries to present a method for modeling and simulation of passenger flow distribution in platform.
In summary, there were two sides to the related research on passenger flow distribution in urban rail transit, one side was the research on modeling and simulation of passenger flow distribution, the other side was the research on application of passenger flow distribution. The research purpose is to improve passenger traffic service quality and reliability. According to the hierarchy of modeling and simulation, passenger flow model contains macroscopic model, mesoscopic model and microscopic model. Early research mainly focused on the correlation among traffic flow, speed and density, research findings represented by FruinJ. J. [1] were adopted as an effective macroscopic analysis approach for passenger traffic in the US Highway Capacity Manual [2]. As the representative of mesoscopic model, lattice gas model was firstly proposed to passenger flow simulation by Muramatsu. M., et al. [3]. With the rapid development of computer technology, microscopic model was proposed and applied to simulation, which mainly included magnetic model [4], benefit cost cellular model [5], queuing network model [6], social force model [7] and cellular automata model [8,9]. On the other hand, application of passenger flow distribution mainly focused on traffic system planning, operation organization design, facility performance evaluation, emergency evacuation and so on.
characteristic of passenger flow. Xiong. H., et al. [11] proposed a continuous-time random walk model to simulate the walking behavior of passenger flow. Lu. L. L., et al. [12] explored the effects of different walking strategies on bi-directional pedestrian flow in the channel with cellular-automata formulation. Daamen. W., et al. [13,14] analyzed the interrelation between passenger path-finding behavior and interlayer facility layout, experiment results showed that passenger flow crowd degree of interlayer facility was the key factor affecting route choice behavior directly. Duive. D. C., et al. [15] proposed the state-of-the-art crowd motion simulation models to explain the different phenomena of crowd motion such as lane formation, stop-and-go waves, faster-is-slower effect, turbulence and zipper effect. Guillermo H. G. [16] built a mathematical model of the formation of lanes in crowds of pedestrians moving in opposite directions. Bandini. S., et al. [17] improved the traditional floor field cellular automata model to simulate the negative interaction among pedestrians of high density.
Especially, aiming at the research on passenger flow distribution and service levlel in urban rail transit station, Seriani. S., et al. [18] explored the pedestrian traffic management of boarding and alighting in metro stations, obtained the management criteria of platform and metro doors by micro-simulator and laboratory experiments, results showed that service level, service time and passenger flow density could provide reference for pedestrian traffic management in metro systems. Zhang. Q., et al. [19,20] proposed a cellular automata-based alighting and boarding micro-simulation model, and a grid-based micro-simulation model for passengers in Beijing metro stations, simulation experiments with different alighting and boarding group sizes and ratios were developed for model verification, results indicated that efficiency evaluation of transfer stations should consider integrated effects of passenger flow volume, facility attributes and train timetable. Yang. Y. D., et al. [21] proposed a method for passenger flow simulation of subway entrance by Anylogic. Wang. G. and Gao. S. S. proposed passenger flow model in subway platform [22,23]. Wang. S. W. [24] built congestion index of transit station based on passenger flow simulation and gray clustering evaluation. Zhao. H. [25] proposed the service level of pedestrian facility and obtained the corresponding value range of passenger flow density in urban rail transit hub. Furthermore, there was the research on passenger dwell time. Schelenz. T., et al. [26,27,28] proposed an agent-based simulation method for calculating passenger dwell time and analyzing passenger preferences with different vehicle layout designs, results proved that the number of vehicle doors had a direct effect on passenger dwell time.
From the above research, it could be found that kinds of models and methods were widely used to explore passenger flow characteristic and behavior in urban rail transit station. However, there were little research on the passenger flow distribution during rush hours in hub platform under the viewpoint of traffic safety and service level. Therefore, the objective of this research is building an effective method for modeling and simulation of passenger flow distribution with different train headways during rush hours in hub platform, expected results could provide a beneficial reference for train scheduling and operation management.
2. Passenger Flow Distribution Model
2.1. Basic Analysis
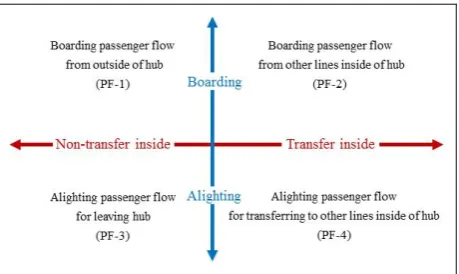
(1) Passenger flow classification and distribution process
Figure 1. Passenger flow classification in hub platform
In urban rail transit hub platform, passenger flow distribution process refers to the traffic behaviors of passenger group dynamics influenced by platform facilities and train scheduling. Passenger flow distribution morphology is regularly changed with train headway. Passenger flow distribution process is shown in Table 1.
Table 1. Passenger flow distribution process in urban rail transit hub platform
Passenger flow classification Passenger flow distribution process
PF-1 hub entrance → hub platform → train
PF-2 other lines inside of hub → hub platform → train PF-3 train → hub platform → hub exit
PF-4 train → hub platform → other lines inside of hub
From Table 1, it could be concluded that there is a same target attribute to PF-3 and PF-4 in hub platform, which is to leave the platform. Therefore, PF-3 and PF-4 could be combined into the alighting passenger flow (PF-5).
Furthermore, during train dwell time, especially after opening train door, the process of passenger flow getting on or off the train includes two phases: alighting phase and boarding phase, as shown in Figure 2, “▲” refers to alighting passenger flow, and “●” refers to boarding passenger flow.
Figure 2. Alighting phase and boarding phase of passenger flow
(2) Influence factors of passenger flow distribution
Based on the relationship between interaction agents, influence factors of passenger flow distribution are derived from platform and train, which are shown in Table 2.
Table 2. Influence factors of passenger flow distribution
Interaction agents Influence factors
platform
platform available area passage traffic capacity
stairs traffic capacity escalator traffic capacity
train
train type train formation
train headway train dwell time
2.2. Basic Definition and Assumption
flow for up train; PF-5+ refers to alighting passenger flow from up train; similarly, PF-i¯ refers to the corresponding passenger flow for (or from) down train.
Figure 3. Structure schematic of island-type platform in urban rail transit hub
(2) Train headway is defined as the time interval between adjacent trains leaving platform in the same direction.
(3) During train headway, it is assumed that all of boarding passengers in platform could get on the train, and all of alighting passengers could leave the platform.
2.3. Passenger Flow Distribution Model
Based on the basic analysis above, it could be concluded that passenger flow distribution morphology in platform is regularly changed with the different train headway. Therefore, the sub-objectives of building passenger flow distribution model in platform are as follows:
(1) Setting up the change rule of passenger flow distribution morphology in platform during train headway.
(2) Calculating the maximum passenger flow volume and passenger flow density value gathered in platform.
(3) Analyzing the dynamic loads of platform facilities, and then evaluating the service level of platform.
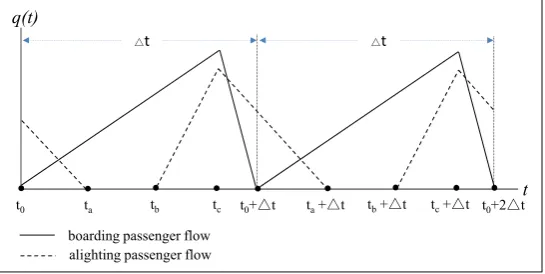
During train headway, variation curves of passenger flow distribution in hub platform could be shown in Figure 4. Where, Δt refers to train headway, s; t0 refers to the time when the prior train leaves hub platform, s; ta refers to the time when alighting passenger flow from the prior train leaves the hub platform completely, s; tb refers to the time when the current train door opens, s; tc refers to the time when boarding passenger flow begin to get on the current train, s; t0+Δt refers to the time when the current train leaves hub platform, s; t0+2Δt refers to the time when the next train leaves hub platform, s. Furthermore, Δt+ refers to train headway for up train, s;
0
t+,
a
t+,
b
t+ and
c
t+ refer to the
corresponding time for up train, s; Δt− refers to train headway for down train, s; 0
t−,
a
t−,
b
t− and
c
t−
refer to the corresponding time for down train, s.
Figure 4. Variation curves ofpassenger flow distribution in hub platform
Firstly, passenger flow volume of PF-1+ at time t is shown in Formula (1): t0
q(t)
ta tb tc t0+△t ta+△t tb+△t tc+△t t0+2△t
boarding passenger flow alighting passenger flow
t
0 0 0
( 1) +
0 1 0 ( ) [ , ( ) [ , ] ( ) c c PF c c
v t t t t t
q t
t t t t v t t t
+ + + + + + − + + + + + + ⋅ − ∈ = ∈ + Δ − ⋅ + Δ − )
(1) And: 0 0 0 Q v T +
+=
(2)
0 1 1 v t v t + + + + ⋅ Δ
=
(3)
Where, q(PF1)( )t +
− refers to passenger flow volume of PF-1+ at time t in platform, p; v0+ refers to average arrival rate of PF-1+ in period
0
T , p/s; Q0+ refers to passenger flow volume of PF-1+ in period
0
T , p; T0 refers to the rush hour, 3600s; v1+ refers to average boarding rate of PF-1+, p/s;
1
t+ refers to
boarding time of PF-1+,
1 0 c
t+= + Δ −t+ t+ t+, s. Because 1
t+ t+
Δ > , so, v1+>v0+. Similarly, passenger flow
volume of PF-1¯ at time t could be defined and calculated.
Secondly, passenger flow volume of PF-2+ at time t is shown in Formula (4):
+ 0 2
1
+
( 2) 0 2, 0 0
1
( ) ( ) k [ , ]
k c
k t t t
k
PF transfer t k t k
q t + q t+ + ++ v dt+ +++Δ v dt+ t t t+ + t
− =
+
−
∈ + Δ(4)
And:
0 max min
1 1 ( ) ( ) k k k k k k Q v
T t t
t t + + + − = ⋅ + ⋅ − Δ Δ
(5) 2, 1 k k v t v t + + + + ⋅ Δ
=
(6)
Where, q(PF−2)( )t + refers to passenger flow volume of PF-2+ at time t in platform, p; ( )0 k transfer
q t+ +
refers to passenger flow volume among PF-2+ transferring from line k at time
0
t+ in platform, p;
1
k
t+
refers to the time when the first passenger among PF-2+ arrives at platform from line k, s;
2
k
t+ refers to
the time when the last passenger among PF-2+ arrives at platform from line k, s;
k
v+ refers to average
arrival rate of passenger flow among PF-2+ transferring from line k in period
0
T , p/s; Qk+ refers to passenger flow volume among PF-2+ from line k in period
0
T , p; Δtk+ refers to train headway of up
train in line k, s; Δtk− refers to train headway of down train in line k, s;
max k
t refers to the maximum walk time from line k, s; min
k
t refers to the minimum walk time from line k, s; v2,k+ refers to average boarding rate of passenger flow among PF-2+ transferring from line k, p/s. Similarly, passenger flow volume of PF-2¯ at time t could be defined and calculated.
Thirdly, passenger flow volume of PF-5+ at time t is shown in Formula (7):
0
4 0
( 5)
3
+
4 0 0
[ , ]
( )
0 [ , ]
( ) ( ) [ , ] ( ) [ , ] a a a b PF
c b b c
c c
t t t v t t
t t t
q t
v t t t t t
v t t t t t t t
+ + + + + + + + − + + + + + + + + + + + − ⋅ − ∈ ∈ = ⋅ − ∈ − ⋅ + Δ − ∈ + Δ
(7) And: 3 3 0 3 Q t v T t + + + + ⋅Δ =
⋅
(8)
3 4 0 4 Q t v T t + + + + ⋅Δ =
⋅
(9)
Where, q(PF−5)( )t + refers to passenger flow volume of PF-5+ at time t in platform, p; v3+ refers to average alighting rate of PF-5+, p/s;
4
v+ refers to average rate of PF-5+ for leaving platform, p/s;
3
Q+
refers to passenger flow volume of PF-5+ in period
0
3 c b
t+= −t+ t+, s; 4
t+ refers to the walk time PF-5+ for leaving platform,
4 a b
t+= + Δ −t+ t+ t+, s. Because
4 3
t+>t+,so,
3 4
v+>v+. Similarly, passenger flow volume of PF-5¯ at time t could be defined and calculated.
Therefore, based on the research above and the superposition principle for passenger flow, passenger flow volume in hub platform at time t is shown in Formula (10):
0 0
( )= ( ) ( ) , [ , ]
Q t Q t ++Q t − t∈ t t + Δt
(10)
And:
+
( 1) ( 2) ( 5) 0 0
( 1) ( 2) ( 5) 0 0
( ) ( ) ( ) ( ) [ , ] ( ) ( ) ( ) ( ) [ , ]
PF PF PF
PF PF PF
Q t q t q t q t t t t t
Q t q t q t q t t t t t
+ + + + + + − − − − − − − − − − − − − = + + ∈ + Δ = + + ∈ + Δ
(11)
Where, Q t( ) refers to passenger flow volume in hub platform at time t, p; Q t( )+ refers to
passenger flow volume for up train in hub platform at time t, p; Q t( )− refers to passenger flow volume
for down train in hub platform at time t, p.
3. Simulation Design and Case Study
3.1. Simulation Design
(1) Simulation process
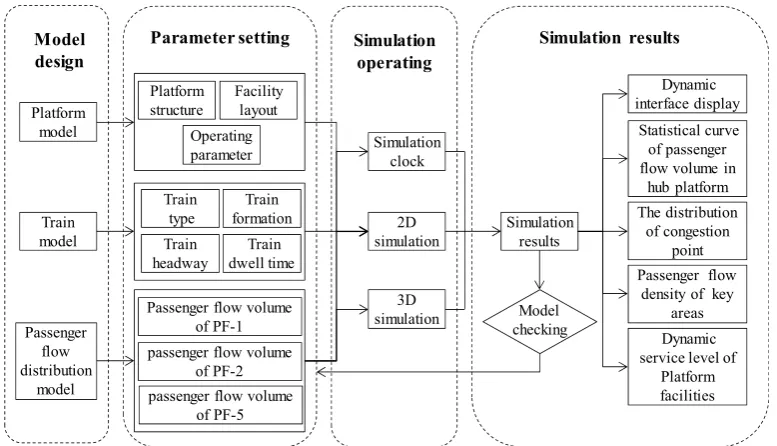
Anylogic is a professional simulation environment for virtual prototyping based on UML-RT, Java and differential equation. It is efficiently used for the simulation of complex systems which contain discrete system, continuous system and hybrid system [29]. So far, Anylogic is widely applied to the dynamic simulation in traffic. In this research, pedestrian library and rail library in Anylogic are adopted to design the simulation environment. Simulation process design of passenger flow distribution in hub platform by Anylogic is shown in Figure 5.
Figure 5. Simulation process design of passenger flow distribution in hub platform by Anylogic
(2) Simulation model
Firstly, simulation model of platform could be proposed according to platform structure and facility layout, and the scale of simulation model could be set as 10.5 pixels per meter, as shown in Figure 6.
Train model Platform model Model design Passenger flow distribution model Facility layout Platform structure Train type Operating parameter Train formation Train dwell time Train headway
Passenger flow volume of PF-1 passenger flow volume
of PF-2 2D simulation 3D simulation Simulation clock Simulation results
Passenger flow density of key
areas Statistical curve
of passenger flow volume in
hub platform Dynamic interface display
Model checking
Parameter setting Simulation operating Simulation results The distribution of congestion point Dynamic service level of
Platform facilities passenger flow volume
Figure 6. Simulation model of platform
Secondly, simulation model of train could be proposed according to rail library, as shown in Figure 7.
Figure 7. Simulation model of train
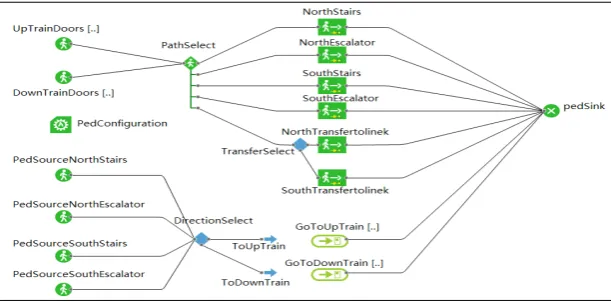
Thirdly, simulation model of passenger flow could be proposed according to pedestrian library, as shown in Figure 8.
Figure 8. Simulation model of passenger flow
3.2. Case Study
(1) Experiment scenario and data
Figure 9. Structure schematic of Beijing South Subway Station
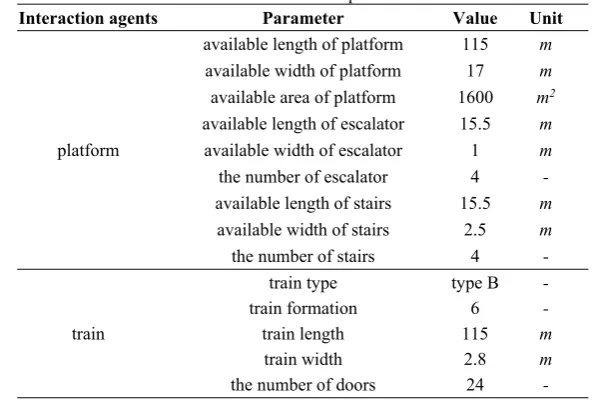
According to the practical investigation from June 6 to June 12, 2016 and data processing, parameters values of platform and train are listed in Table 3, parameters values of passenger flow distribution model are listed in Table 4.
Table 3. Parameters values of platform and train
Interaction agents Parameter Value Unit
platform
available length of platform 115 m
available width of platform 17 m
available area of platform 1600 m2
available length of escalator 15.5 m
available width of escalator 1 m
the number of escalator 4 -
available length of stairs 15.5 m
available width of stairs 2.5 m
the number of stairs 4 -
train
train type type B -
train formation 6 -
train length 115 m
train width 2.8 m
the number of doors 24 -
Table 4. Parameters values of passenger flow distribution model in rush hours
Rush hour Symbol Value Unit Symbol Value Unit
07:30-08:30
0
Q+ 6650 p
0
Q− 950 p
k
Q+ 2100 p
k
Q− 300 p
3
Q+ 4590 p
3
Q− 1800 p
0
v+ 1.85 p/s
0
v− 0.26 p/s
1
v+ 9.53 p/s
1
v− 1.21 p/s
2,k
v+ 22.56 p/s
2,k
v− 2.94 p/s
3
v+ 26.27 p/s
3
v− 14 p/s
4
v+ 2.39 p/s
4
v− 1.08 p/s
k
v+ 4.38 p/s
k
v− 0.63 p/s
12:30-13:30
0
Q+ 2300 p
0
Q− 650 p
k
Q+ 800 p
k
Q− 180 p
3
Q+ 1500 p
3
Q− 2050 p
0
v+ 0.64 p/s
0
v− 0.18 p/s
1
v+ 3.30 p/s
1
v− 0.84 p/s
2,k
v+ 8.60 p/s
2,k
3
v+ 8.58 p/s
3
v− 15.94 p/s
4
v+ 0.78 p/s
4
v− 1.23 p/s
k
v+ 1.67 p/s
k
v− 0.38 p/s
18:30-19:30
0
Q+ 5850 p
0
Q− 3350 p
k
Q+ 1000 p
k
Q− 1800 p
3
Q+ 2000 p
3
Q− 5400 p
0
v+ 1.63 p/s
0
v− 0.93 p/s
1
v+ 8.39 p/s
1
v− 4.34 p/s
2,k
v+ 10.71 p/s
2,k
v− 17.50 p/s
3
v+ 11.44 p/s
3
v− 42 p/s
4
v+ 1.04 p/s
4
v− 3.23 p/s
k
v+ 2.08 p/s
k
v− 3.75 p/s
07:30-08:30 12:30-13:30 18:30-19:30
1 0 c
t+= + Δ −t+ t+ t+ 20 s
1 0 c
t−= + Δ −t− t− t− 30 s
3 c b
t+= −t+ t+ 5 s
3 c b
t−= −t− t− 5 s
4
t+ 55 s
4
t− 65 s
0
a
t+−t+ 30 s
0
a
t−−t− 30 s
b a
t+−t+ 48 s
b a
t−−t− 75 s
mink
t 120 s tmaxk 140 s
t+
Δ 103 s Δt− 140 s
k t+
Δ 300 s Δtk− 300 s
0
T 3600 s
(2) Results analysis
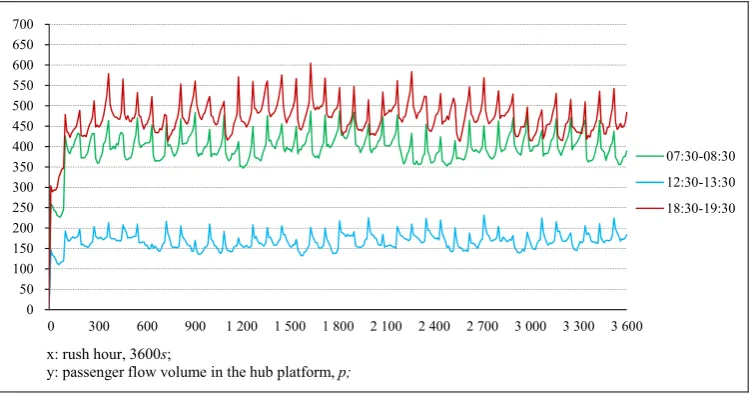
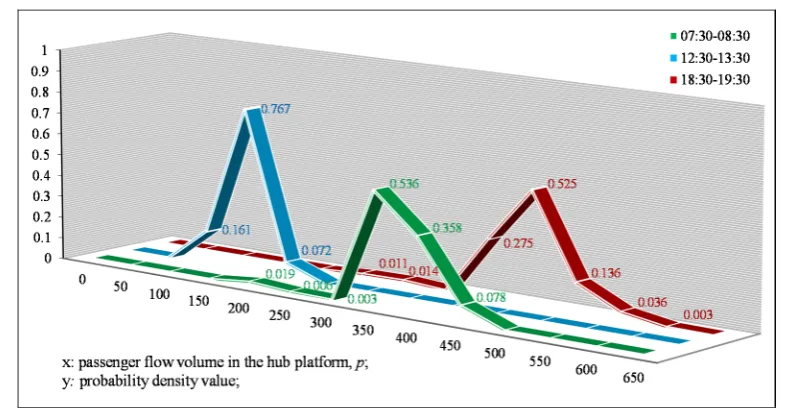
Based on the research above, during the rush hours, the values of passenger flow volume in hub platform are calculated, as shown in Figure 10; probability density values of passenger flow volume in hub platform are calculated, as shown in Figure 11; and then, statistical results of passenger flow volume and density in hub platform are calculated, as shown in Table 5 and Table 6.
Figure 10. Statistical curves of passenger flow volume in hub platform
0 50 100 150 200 250 300 350 400 450 500 550 600 650 700
0 300 600 900 1 200 1 500 1 800 2 100 2 400 2 700 3 000 3 300 3 600 x: rush hour, 3600s;
y: passenger flow volume in the hub platform, p;
Figure 11. Probability density curves of passenger flow volume in hub platform
Table 5. Statistical results of passenger flow volume in hub platform
Rush hour Numerical simulation Actual statistic Average error Maximum value Average value Maximum value Average value
07:30-08:30 487 396 473 379
2.33%
12:30-13:30 238 167 245 171
18:30-19:30 605 468 612 467
Table 6. Statistical results of passenger flow density in hub platform
Rush hour Numerical simulation Actual statistic Service level of platform Maximum value Average value Maximum value Average value
07:30-08:30 0.30 0.25 0.30 0.24 C
12:30-13:30 0.15 0.10 0.15 0.11 A
18:30-19:30 0.38 0.29 0.38 0.29 C
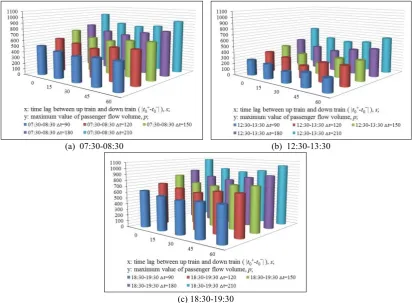
Furthermore, during the rush hours, with different train headways (Δ =t 90,120,150,180,210,s) and different time lags between up train and down train (t0+−t0− =0,15,30, 45,60,s), more experiments could
be developed. The maximum values of passenger flow volume with different Δt and t0+−t0− during
the rush hours are calculated, as shown in Table 7 and Figure 12.
Table 7. Maximum values of passenger flow volume with different train headways and time lags in hub platform
Rush hour Train headway (Δt, s) Time lag between up train and down train (t0 t0
+− − , s)
0 15 30 45 60
07:30-08:30
90 506 456 427 455 463
120 588 540 493 560 573
150 701 599 578 620 642
180 773 678 642 712 767
210 963 801 763 798 908
12:30-13:30
90 266 251 187 239 223
120 348 300 212 320 333
150 408 306 194 327 349
180 480 385 349 419 474
210 670 508 470 505 615
18:30-19:30
90 625 574 548 575 587
120 708 660 621 680 693
150 826 715 693 743 760
180 893 798 762 832 887
(a) 07:30-08:30 (b) 12:30-13:30
(c) 18:30-19:30
Figure 12. Statistical histograms of the maximum passenger flow volume with different train headways and time lags in hub platform
Examining these tables and figures above, the following statements could be drawn:
(1) In Table 5, the average error of passenger flow volume between numerical simulation and actual statistic is 2.33%, it could be indicated that the simulation precision is comparatively ideal, passenger flow distribution model proposed in section 2 and simulation design proposed in section 3 are effective and accordant with the reality scenario.
(2) In Figure 10, Figure 11 and Table 5, it is shown that the maximum value of passenger flow volume from 18:30 to 19:30 (605, 18:30-19:30) is greater than any other maximum value in each rush hour (487, 07:30-08:30; 238, 12:30-13:30).
(3) In Table 6, the maximum value and average value of passenger flow density are less than 0.40p/m2, it could be indicated that the service level of hub platform during rush hours is reliable.
(4) In Table 7 and Figure 12, the minimum value among the maximum values of passenger flow volume with different train headways and time lags in each rush hour could be obtained as Δt=90 and
0 0 30
t+−t− = , which could provide a beneficial reference for train scheduling under the viewpoint of
traffic safety and service level.
4. Conclusion
For an urban rail transit hub, hub platform is the most important area for passenger flow distribution. Passenger flow volume of hub platform has become the fundamental and crucial data for hub capacity design, operation management and train scheduling. In this paper, in order to research the dynamic variation regularity of passenger flow distribution and calculate the passenger flow volume of hub platform, a method for modeling and simulation of passenger flow distribution is proposed, and some conclusions are obtained as follows.
(1) Passenger flow distribution model is built based on the basic analysis and the superposition principle of passenger flow. Simulation design for passenger flow distribution model is built based on Anylogic, which contains simulation process and simulation model.
experiments are developed with different train headways and time lags, which could provide a beneficial reference for train scheduling under the viewpoint of traffic safety and service level.
In this research, because of the basic definition and assumption, it is not free of mistakes and limitations. Future research could be conducted to improve the performance of passenger flow distribution model, and focus on the reality application.
Acknowledgements: Authors gratefully acknowledge the financial support from the National Natural ScienceFoundation of China (Grant No. 71171015).
Author Contributions: This research is not free of mistakes and inconveniences. L.G. and L.J. conceived and designed the model and experiment; L.G. performed the experiment and analyzed the results; L.G. wrote this paper; all authors collaborated on the interpretation of the results and on the preparation of the manuscript.
Conflict of Interest: The authors declare no conflict of interest.
References
1. Fruin. J. J. Designing for pedestrians: a level of service concept. Washington DC: Highway Research Board. vol. 355, no. 12, pp. 1-15, 1971.
2. Transportation Research Board. Highway Capacity Manual. Washington DC: National Research Council Press. pp. 635-670, 2000.
3. Muramatsu. M, Irie. T, and Nagatani. T. Jamming transition in pedestrian counter flow. Physica A. vol. 267, no. 3, pp. 487-498, 1999.
4. Okazaki. S. A study of pedestrian movement in architectural space, part 1: pedestrian movement by the application on of magnetic models. Transactions of the Architectural Institute of Japan. vol. 283, no. 3, pp. 111-119, 1979. 5. Gipps. P. G., and Marksjo. B. A micro-simulation model for pedestrian flows. Mathematics and Computers in
Simulation. vol. 27, no. 2, pp. 95-105, 1985.
6. Lovas. G. G. Modeling and simulation of pedestrian traffic flow. Transportation Research Part B. vol. 28, no. 3, pp. 429-443, 1994.
7. Helbing. D, and Molnar. P. Social force model for pedestrian dynamics. Physical Review E. vol. 51, pp. 4282-4286,
1995.
8. Blue. V. J, and Adler. J. L. Cellular automata microsimulation for modeling bi-directional pedestrian walkways.
Transportation Research Part B. vol. 35, pp. 293-312, 2001.
9. Li. X. M, Yan. X. D, and Li. X. G. Using cellular automata to investigate pedestrian conflicts with vehicles in crosswalk at signalized intersection. Discrete Dynamics in Nature and Society. vol. 3, pp. 1555-1565, 2012.
10. Helbing. D. Collective Phenomena and States in Traffic and Self-driven Many-particle Systems. Computational Materials Science. vol. 30, pp. 180-187, 2004.
11. Xiong. H. W, Yao. L. Y, and Wang. W. H. Pedestrian walking behavior revealed through a random walk model.
Discrete Dynamics in Nature and Society. vol. 12, pp. 1951-1965, 2012.
12. Lu. L. L, Ren. G, and Wang. W. Exploring the effects of different walking strategies on bi-directional pedestrian flow. Discrete Dynamics in Nature and Society. vol. 2, pp. 1-9, 2013.
13. Daamen. W, Bovy. P. H. L, and Hoogendoorn. S. P. Influence of changes in level on passenger route choice in railway stations. 84th Annual Meeting of the Transportation Research Board, Washington DC: National Research Council Press. pp. 12-20, 2005.
14. Daamen. W, Bovy. P. H. L, and Hoogendoorn. S. P. Choices between stairs, escalators and ramps in stations. 10th International Conference on Computer System Design and Operation in the Railway and Other Transit Systems. pp. 3-12, 2006.
15. Duive. D. C, Daamen. W, and Hoogendoorn. S. P. State-of-the-art crowd motion simulation models. Transportation Research Part C. vol. 37, no. 3, pp. 193-209, 2013.
16. Guillermo H. G. A mathematical model of the formation of lanes in crowds of pedestrians moving in opposite directions. Discrete Dynamics in Nature and Society. vol. 2, pp. 56-63, 2015.
17. Bandini. S, Mondini. M, and Vizzari. G. Modelling negative interaction among pedestrians in high density situations.
Transportation Research Part C. vol. 40, no. 1, pp. 251-270, 2014.
18. Seriani. S, and Fernandez. R. Pedestrian traffic management of boarding and alighting in metro stations.
Transportation Research Part C. vol. 53, pp. 76-92, 2015.
19. Zhang. Q., Han. B. M., and Li. D. W. Modeling and simulation of passenger alighting and boarding movement in Beijing metro stations. Transportation Research Part C. vol. 16, no. 5, pp. 635-649, 2008.
20. Zhang. Q., Han. B. M. Modeling and simulation of transfer performance in Beijing metro stations. 8th IEEE International Conference on Control and Automation. vol. 17, no. 1, pp. 1888-1891, 2010.
22. Wang. G. Research on the model of assembling in the urban rail transit platform [Master dissertation]. Beijing Jiaotong University, China, 2012.
23. Gao. S. S. Analysis and calculation of assembling passengers at urban rail transit platform [Master dissertation]. Beijing Jiaotong University, China, 2015.
24. Wang S. W, and Rong. J. Transit station congestion index research based on pedestrian simulation and gray clustering evaluation. Discrete Dynamics in Nature and Society. vol. 12, pp. 1-8, 2013.
25. Zhao. H. Study on the service level of pedestrian facility in urban rail transit hub[Master dissertation]. Beijing University of Civil Engineering and Architecture, China, 2011.
26. Schelenz. T, Suescun. A, and Wikstrom. L. Passenger-centered design of future buses using agent-based simulation.
Procedia-Social and Behavioral Sciences. vol. 48, pp. 1662-1671, 2012.
27. Schelenz. T, Suescun. A, and Karlsson. M. Decision making algorithm for bus passenger simulation during the vehicle design process. Transport Policy. vol. 25, no. 1, pp. 178-185, 2013.
28. Schelenz. T, Suescun. A, and Wikstrom. L. Application of agent based simulation for evaluating a bus layout design from passengers’ perspective. Transportation Research Part C. vol. 43, no. 2, pp. 222-229, 2014.
29. Zhao. N, and An. S. Collaborative management of complex major construction projects: anylogic-based simulation modeling. Discrete Dynamics in Nature and Society. vol. 10, pp. 1-8, 2016.