The University of Western Ontario Supervisor
Wisner, James A.
The University of Western Ontario Graduate Program in Chemistry
A thesis submitted in partial fulfillment of the requirements for the degree in Doctor of Philosophy
© Jeffrey S. Pleizier 2018
Follow this and additional works at: https://ir.lib.uwo.ca/etd
Part of the Materials Chemistry Commons, Organic Chemistry Commons, and the Physical Chemistry Commons
Recommended Citation Recommended Citation
Pleizier, Jeffrey S., "Photo-Isomerizable Complementary Hydrogen Bond Arrays" (2018). Electronic Thesis and Dissertation Repository. 5983.
https://ir.lib.uwo.ca/etd/5983
This Dissertation/Thesis is brought to you for free and open access by Scholarship@Western. It has been accepted for inclusion in Electronic Thesis and Dissertation Repository by an authorized administrator of
i
Abstract
The use of light as an external stimulus provides a non-invasive technique to
induce large changes in physical and chemical properties of a substrate. The
incorporation of a photochromic subunit into supramolecular polymeric systems therefore
adds a potential "smart" quality for polymer manipulation. The azo moiety (-N=N-) is
one of the most popular photochromic units as the trans to cis isomerization results in a
large degree of spatial rearrangement. This present thesis exploits the azo group by its
incorporation into complementary hydrogen bonded complexes. Hydrogen bonding
acceptor groups attached to the periphery of the central azo photoswitch provided strong
complexation with donor arrays in the trans state. Isomerization to the cis isomer
disrupted complex stability by rearrangement from the optimal binding geometry.
Furthermore, one of the azo nitrogen atoms also participated in hydrogen bonding which
is a new use for these types of photoswitches.
The arrays used as photoswitchable hydrogen bonding acceptors in this work
were synthesized through high yielding synthetic methods with inexpensive,
commercially available starting materials. The donor arrays chosen for this work were
2-aminoindoles which are small, planar compounds. They were chosen as they have a
multitude of positions where substitutions can take place which can result in a large
library of compounds. Complex stability of these arrays were analyzed in solution using
1
H NMR titration methods and these results were validated in the solid state by X-ray
ii
NMR extrapolation method which allowed for the determination of lower association
constants for the cis isomeric complexes. The reversibility of the system was also tested
and showed stability and reproducibility.
Keywords
________________________________________________________________________
Supramolecular, Hydrogen Bonding, Complementary, Substituent Effects,
Photochromism, Azo, Trans, Cis, NMR Titrations, Extrapolations
iii
Co-Authorship Statement
Dr. Janic Linares Mendez assisted in 1H NMR spectra collection for the
extrapolation experiments. All crystal structures were solved and refined by Dr. Paul
Boyle, Dr. Bhanu Mudraboyina, or Aneta Boreki. Mass spectra were collected by Doug
Hairsine. Figure 1.20 was used with permission by Springer Nature; License Number
iv
in his lab as an undergraduate and he just couldn't get rid me. He is a great mentor, a
great chemist, a great leader, and now a great friend. His patience with me in particular
has been enormous (chemistry and life). Cannot thank him enough for letting me be a
part of his research group, and of course the Hong Ping lunch trips.
Everyone that I have had the pleasure to work within the Wisner lab has been
amazing. Past or present, thank you all for support and knowledge. In particular, Dr.
Janic Linares Mendez has been my sister from a Mexican mister my whole time here.
We helped each other, in the lab and out, bounced ideas off each other and truly made
each other better people. Not seeing her beside me 5 days a week for several hours will
be a true hardship. Much love Janic.
Western University has bought me into contact with some amazing individuals.
Dr. Paul Boyle from X-ray, Doug Hairsine from Mass Spec, Mat Willians from NMR,
the ladies from ChemBioStores (and Don), my Tim Hortons ladies: Kula, Kathy, Rhonda
and Brenda, I could continue. You all have helped me in life or my studies one way or
another and I am truly grateful.
I truly did not think I would be here today and a lot of that is because of my
v
always out of respect. Steph, Mike, Jason, Chris, Cami, Kelly, Iman, Jennifer...you
individuals in particular are the greatest friends a silly chemist like myself could have.
This thesis would not exist without you pushing me, and I may even not be on this earth
today if I didn't have you people in my life. Love you all.
Lastly, this thesis is dedicated to my late mother Grace Pleizier. She was
removed from my life in March 16th, 2017 from a long fight with cancer. If there is one
thing she taught me, it's perseverance. She surpassed her life expectancy two times
because knew she couldn't leave yet. I know she is proud of everything I have achieved
and is excited to watch my defense from above. I promised her on her hospital bed that I
would get my Ph.D. and be the best dang organic chemist out there. This is my first step
to that promise. Will always love and miss you mom.
vi
List of Tables ... xi
List of Figures ... xv
List of Schemes ... xxx
List of Abbreviations and Symbols... xxviv
Chapter 1 ... 1
1 Introduction ... 1
1.1 Supramolecular Polymers... 1
1.2 Types of Supramolecular Polymers... 1
1.3 Intermolecular Interactions... 2
1.4 Hydrogen bonding... 5
1.5 Factors which affect Hydrogen Bonding Complexes... 9
1.5.1 Number of Binding Pairs... 10
1.5.2 Sequence Dependence of Binding Pairs... 11
1.5.3 Polarization... 13
1.5.4 Preorganization... 16
1.5.5 Tautomerization... 18
1.5.6 Solvation... 21
vii
1.7 Families... 24
1.8 Photodegradation and Fatigue Resistance... 28
1.9 Azoaromatic Photoswitches... 31
1.9.1 Different Classes of Azobenzenes... 32
1.9.2 Utilizing Azobenzene Isomerization... 33
1.10 Photocontrollable Self-Assembly... 36
1.11 Photoswitchable Hydrogen Bonded Supramolecular Polymers... 43
1.12 Scope of the Thesis... 45
1.13 References... 47
Chapter 2... 52
2 Synthesis and Characterization of Complementary DD-AAA Hydrogen Bond Arrays... 52
2.1 Hydrogen Bonded Supramolecular Polymers... 52
2.2 Complementary Hydrogen Bonded Arrays... 54
2.3 Design of Initial Arrays... 63
2.4 Results and Discussion... 66
2.4.1 Synthesis of Donor Arrays: 2-Aminoindoles... 66
2.4.2 Synthesis of Acceptor Array: 2,2'-Azopyridine... 72
2.4.3 Solution State Studies... 73
2.4.4 Studies of Ethyl 2-Aminoindole-3-Carboxylates with (E)-2... 76
2.4.5 Studied of 2-Aminoindole-3-Carbonitriles with (E)-2... 83
2.4.6 Solid State Analysis of Complementary Arrays... 90
viii
Chapter 3... 129
3 Synthesis and Characterization of Modified Complementary Hydrogen Bond Arrays... 129
3.1 Solvent Effects... 129
3.2 Effects of Additional Preorganized Donors or Acceptors... 132
3.3 Design of Improved Donor and Acceptor Arrays... 134
3.4 Results and Discussion... 136
3.4.1 Synthesis of 3-Substituted-1H-2-Aminoindoles... 136
3.4.2 Synthesis of Extended Acceptor Arrays... 147
3.4.3 Solution State Studies: Complexation of 3-Substituted-1H-2- Aminoindoles with (E)-2... 149
3.4.4 Solution State Studies: Comparison of Complexation Strength and Solvents Effects of 3-21b with Acceptor Arrays (E)-2, (E)-3, and (E)-4... 154
3.4.5 Synthesis and Study of 3-Perfluoroacyl-1H-2-Aminoindole Derivatives with (E)-2 and (E)-3 Acceptor Arrays... 166
3.4.6 Solid State Studied... 174
ix
3.6 Experimental Methodology... 187
3.6.1 General Information... 187
3.6.2 Titration Procedure... 187
3.6.3 Synthetic Methods... 188
3.7 References... 211
Chapter 4... 214
2 Photochemistry of Photoswitchable Complementary Hydrogen Bond Arrays.. 214
4.1 Photoisomerizable Hydrogen Bonded Complexes... 214
4.2 Results and Discussion... 221
4.2.1 Isomerization behavior of (E)-2 and (E)-3 and isolation of (Z)-2 and (Z)-3... 221
4.2.2 Determination of Complex Stability of (Z)-2 in CDCl3... 229
4.2.3 Determination of Complex Strength of (Z)-2 and (Z)-3 with 3-21b in Toluene-d8... 233
4.2.4 Determination of Complex Strength of (Z)-2 and (Z)-3 with 3-2e in Toluene-d8... 251
4.2.5 Solid State Structure if (Z)-2... 258
4.3 Summary and Conclusions... 261
4.4 Experimental Methodology... 263
4.4.1 General Information... 263
4.4.2 Titration Procedure... 264
4.4.3 Extrapolation Procedure for (Z)-2 and 2-3k... 264
x
4.5 References... 269
Chapter 5... 271
5 Conclusions and Future Work... 271
5.1 Conclusions... 271
5.2 Scope for Future Work... 273
xi
List of Tables
Chapter 1
Table 1.1 Types of molecular interactions with respective strengths, examples, and
directionalities... 3
Table 1.2 Strengths of Hydrogen Bonds and outcomes of those bonds... 6
Chapter 2
Table 2.1 Association constants of each indole species 2-3a-k with (E)-2 (Ka), free
energies of complexation (∆G), and calculated chemical shifts of free indole, fully
complexed indole and total change in chemical shift (δfree, δbound and δmax respectively) in
CDCl3 at 298 K... 78
Table 2.2 Association constants of each indole species 2-4a-d, f, g, j, k with (E)-2 (Ka),
free energies of complexation (∆G), and calculated chemical shifts of free indole, fully
complexed indole and total change in chemical shift (δfree, δbound and δmax respectively) in
CDCl3 at 298 K . (-) indicates insolubility in CDCl3... 84
Table 2.3 Crystallographic X-Ray Crystal Structure Data of 2-3f·(E)-2, 2-3g·(E)-2 and
2-3e·(E)-2... 92
Table 2.4 Bond lengths and bond angles of hydrogen bonds of interest from crystal
2-3g·(E)-2... 95
Table 2.5 Bond lengths and bond angles of hydrogen bonds of interest from crystal
2-3e·(E)-2... 95
Table 2.6 Crystallographic X-Ray Crystal Structure Data of 2-4a·(E)-2 and 2-4g·(E)-2.
xii
crystals 2-3f·(E)-2, 2-3g·(E)-2, 2-3e·(E)-2, 2-4a·(E)-2, and 2-4g·(E)-2... 101
Chapter 3
Table 3.1 Association constants (Ka) of each indole species 3-8b, 3-9b, 3-14b, and
3-18b with (E)-2, free energies of complexation (∆G), calculated chemical shifts of free
indole, fully complexed indole and total change in chemical shift (δfree, δbound, and ∆δmax
respectively) in CDCl3 at 298 K...152
Table 3.2 Association constants (Ka) of indole 3-21b with (E)-2, (E)-3, and (E)-4, free
energies of complexation (∆G), calculated chemical shifts of free indole, fully complexed
indole and total change in chemical shift (δfree, δbound, and ∆δmax respectively) in CDCl3
and Toluene-d8 at 298 K...158
Table 3.3 Association constants (Ka) of indole 3-2d with (E)-2 and (E)-3, free energies
of complexation (∆G), calculated chemical shifts of free indole, fully complexed indole
and total change in chemical shift (δfree, δbound, and ∆δmax respectively) in CDCl3 and
Toluene-d8 at 298 K...170
Table 3.4 Association constants (Ka) of indole 2-2e with (E)-2 and (E)-3, free energies
of complexation (∆G), calculated chemical shifts of free indole, fully complexed indole
and total change in chemical shift (δfree, δbound, and ∆δmax respectively) in CD2Cl2 and
xiii
Table 3.5 Crystallographic Data of crystals (E)-2·3-8b and (E)-2·3-14b... 178
Table 3.6 Crystallographic data of crystals (E)-2·3.21b, (E)-3·2-5f, and (E)-4·2-3b.179
Table 3.7 Bond length and bond angles of hydrogen bonds of interest from crystal (E
)-2·3.21b... 181
Chapter 4
Table 4.1 The extrapolated NH chemical shifts of each (Z)-2 reversion experiment..232
Table 4.2 The extrapolated NH chemical shifts of each (Z)-2 reversion experiment with
3-21b... 237
Table 4.3 Association constants (Ka), free energies of complexation (∆G), calculated
chemical shifts of free indole, fully complexed indole, and total change in chemical shift
(δfree, δbound, and ∆δmax respectively) of (E)-2, (Z)-2, and Py with 3-21b. All experiments
were performed in toluene-d8 at 298 K... 240
Table 4.4 The extrapolated NH chemical shifts of each (Z)-3 reversion experiment with
3-21b.... 242
Table 4.5 Association constants (Ka), free energies of complexation (∆G), calculated
chemical shifts of free indole, fully complexed indole, and total change in chemical shift
(δfree, δbound, and ∆δmax respectively) of (E)-3, (Z)-3, and Nap with 3-21b. All
experiments were performed in toluene-d8 at 298 K... 244
Table 4.6 The extrapolated NH chemical shifts of each (Z)-2 reversion experiment with
3-2e...251
Table 4.7 Association constants (Ka), free energies of complexation (∆G), calculated
xiv
chemical shifts of free indole, fully complexed indole, and total change in chemical shift
(δfree, δbound, and ∆δmax respectively) of (E)-3 and (Z)-3 with 3-2e. All experiments were
performed in toluene-d8 at 298 K... 256
Table 4.10 Crystal data and structure refinement for cis-2,2’-azopyridine, (Z)-2... 260
Table 4.11 Selected bond distances and angles of (Z)-2 and trans-2,2’-azopyridine in
xv
List of Figures
Chapter 1
Figure 1.1 Complementary purine-pyrimidine base pairing within the DNA double
helix... 4
Figure 1.2 Hydrogen bonding displayed with two water molecules. The strong
hydrogen bond (above) has the optimal 180o angle as the electrostatic surface potentials
are maximized in dipole pairs. Red surfaces represents electron rich areas and blue
surfaces and H atoms electron poor areas... 7
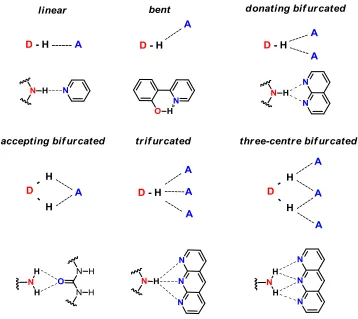
Figure 1.3 Common spatial arrangements of hydrogen bonding interactions with
possible structural examples below each classification... 9
Figure 1.4 Hydrogen bonding complexes examined by Leigh and co-workers
demonstrating the importance of multiple binding pairs... 11
Figure 1.5 Secondary interactions in triply hydrogen bonded complexes... 12
Figure 1.6 Two hydrogen bonded complexes depicting their respective secondary
interactions and the resulting complex strengths. Red and black arrows represent
repulsive and attractive secondary interactions, respectively... 12
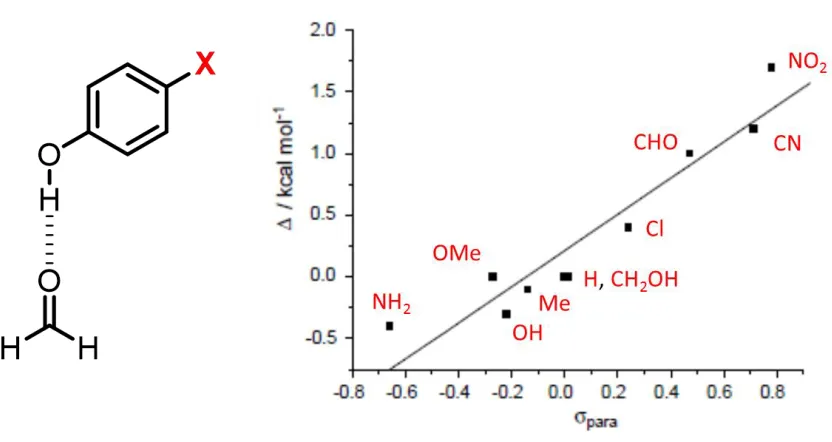
Figure 1.7 Plot of Hammett constants (σpara) corresponding to substituent X on phenol
derivatives with the change in binding strength with a formaldehyde acceptor studied by
Reynisson and McDonald. Depiction of the singly hydrogen bonded complex is shown
on the left... 14
Figure 1.8 The gas phase AAA-DDD arrays studied by Boyd and co-workers.
Depiction of the complex studied shown on the left with substituents and binding
xvi
Figure 1.11 Self-complementary dimers studied by Meijer and co-workers. The
complex on the right is the stronger complex due to preorganized intramolecular
hydrogen bonds which are shown in red... 18
Figure 1.12 The three types of interactions involved in molecular solvation... 21
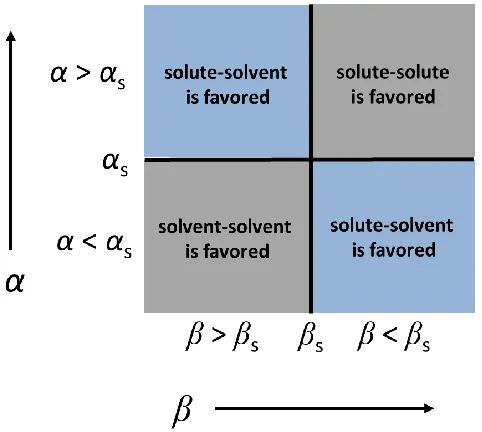
Figure 1.13 Favorable and unfavorable interactions between solvent and solute utilizing
Hunter's parameters α and β... 22
Figure 1.14 Absorbance spectra of molecule A and the absorbance spectra after
irradiation, molecule B... 23
Figure 1.15 Previtamin D3, a precursor to vitamin D which is a result of
7-dehydrocholestrol reacting with UVB light... 24
Figure 1.16 Diarylethene derivatives used in live cell imaging (left) and anion sensing
(right)... 28
Figure 1.17 Two cycling plots of a non-fatigue resistant photoswitch (left) and a fatigue
resistant photoswitch (right)... 31
Figure 1.18 Differences between trans- and cis-azobenzene... 32
xvii
Figure 1.20 Photoresponsive liquid-crystal elastomer synthesized by Ikeda and
co-workers. Figure reproduced with permission (License Number:
4446540504167)... 36
Figure 1.21 Photocontrolled precipitation and dissolution performed by Shibasaki and
co-workers... 41
Figure 1.22 Photoswitchable hydrogen bonded supramolecular polymer containing a
diarylethene moiety synthesized by Takeshita and co-workers... 44
Chapter 2
Figure 2.1 Synthesis of 6-methyl-2-butylureidopyrimidone demonstrating the popular
AADD self-complementary hydrogen bonded arrangement; donors depicted in red and
acceptors in blue. Dashed lines indicate attractive interactions... 53
Figure 2.2 i) UPy terminated monomers with showing a variety of different linkers. ii)
depiction demonstrating how these monomers bind and dissociate and reanneal upon
heating and cooling... 54
Figure 2.3 Two complementary arrays demonstrating sequence dependence when
constructing complexes; black arrows indicate attractive secondary interactions and red
arrows repulsive... 56
Figure 2.4 a) 2,6-acetamidopyridine array; b) cyanuric (X = NR) and barbituric (X =
CR2) acid arrays; c) double-edged 6-point hydrogen bonded polymer created from the
two arrays to which are bound to solubilizing linkers... 56
Figure 2.5 Lehn and co-workers monomers utilizing the ADA-DAD hydrogen bonding
xviii
Figure 2.8 An AAA-DDD supramolecular polymer synthesized by Wang and
co-workers. Experimental conditions and methods reported in brackets... 61
Figure 2.9 Theoretical plot demonstrating the linear relationship between association
constant and the degree of polymerization for a concentration dependent supramolecular
polymer... 62
Figure 2.10 Schematic representation of 2,6-diaminopyridinium tetraphenylborate-
1,2-bis(5,7-dimethyl-1,8-naphthyridin-2-yl)diazene complex (left). Stick representation
of the X-Ray crystal structure obtained by Wisner and co-workers (right). C-H protons
have been removed for clarity and hydrogen bonds are depicted as orange dashed lines.
...63
Figure 2.11 Schematic displaying how the rotation of amide bonds in ureas/thioureas
would affectively block the ideal hydrogen bonding arrangement... 64
Figure 2.12 The 2-aminoindole and azopyridine complex as a combination which arose
from the initial complex and urea donor system... 65
Figure 2.13 2-aminoindoles where the 3, 5, and 6 positions contain additional electron
withdrawing substituents (X, Y, Z)... 66
xix
0.25 mM (stacked top to bottom) at room temperature. 1H NMR spectra at
concentrations 0.75 and 0.5 mM are not shown... 77
Figure 2.15 Indole N-H 1H NMR titration data and calculated binding isotherm for
complex formation between 2-3i and (E)-2. Ka, calculated free energy of complexation
and schematic of complex depicted on the left... 79
Figure 2.16 Indole N-H 1H NMR titration data and calculated binding isotherm for
complex formation between 2-3k and (E)-2. Ka, calculated free energy of complexation
and schematic of complex depicted on the left... 80
Figure 2.17 1H NMR titration stacked plot of array 2-3k·(E)-2 in CDCl3 at 298 K; red
lines corresponds to N-H and blue to NH2. i) 0 equivalents of (E)-2, ii) 1 molar
equivalent of (E)-2, iii) 4 molar equivalents of (E)-2, iv) 9 molar equivalents of (E)-2.. 81
Figure 2.18 LFER of Ʃσ vs log(Ka) for derivatives 2-3a-k with (E)-2. Linear fit
representation by the dotted black line (ρσ = 0.8121, R2 = 0.9833)... 82
Figure 2.19 2D 1H NOESY spectrum of 2-3j·(E)-2 in CDCl3 at 298 K. Correlations of
interest are indicated by red arrows in structure and red lines on spectrum... 83
Figure 2.20 Indole N-H 1H NMR titration data and calculated binding isotherm for
complex formation between 1-4a and (E)-2. Ka, calculated free energy of complexation
and schematic of complex depicted on the left... 87
Figure 2.21 Indole N-H 1H NMR titration data and calculated binding isotherm for
complex formation between 1-5f and (E)-2. Ka, calculated free energy of complexation
and schematic of complex depicted on the left... 87
Figure 2.22 Plot of Ʃσ vs log(Ka) for derivatives 2-4a, b, f and 2-5f with (E)-2. Linear
xx
Figure 2.25 Stick representation of complexes 2-3g·(E)-2 (i) and 2-3e·(E)-2 (ii).
Hydrogen bonds depicted as orange dashed lines. C-H bonds have been removed for
clarity...95
Figure 2.26 Stick representation of crystals 2-4a·(E)-2 (i) and 2-4g·(E)-2 (ii).
Hydrogen bonds depicted as orange dashed lines; C-H bonds removed for clarity... 98
Figure 2.27 Stick representation of 2-4a·2-4a dimer (i) and 2-4g·2-4g dimer (ii).
Intermolecular hydrogen bonds depicted as dashed orange lines. C-H bonds removed for
clarity... 100
Chapter 3
Figure 3.1 Results of 31P NMR titrations showing association constants for a 1:1
complex at 295 K as a function of solvent properties. Experiments were repeated thrice
and average values reported. Errors in Ka are ± 20% except for NMF, DMSO, and
n-decanol where only 30-40% of the binding isotherm was accessible. Values are accurate
to within an order of magnitude... 130
Figure 3.2 Dimerization equilibria of self-complementary photoswitchable azo
containing arrays. Kt·t for three derivatives are given in CDCl3 and Toluene-d8 at 298 K.
Experiments were performed in triplicate, average Kt·t values reported and errors are
xxi
Figure 3.3 Preorganization effects of double helical bis-indolyl-thiazine dioxide ·
bis-pyridyl-3,5-lutidine complexes... 132
Figure 3.4 1,4-dihydropyridine analogues and fused pyridyl acceptors demonstrating
the importance of preorganization in conjunction with the number of contiguous binding
pairs... 134
Figure 3.5 Illustration showing the proposed divergent synthesis to create a library of
3-substituted 2-aminoindoles from a common precursor... 135
Figure 3.6 Diagram showing the proposed modifications of the 2,2-azopyridine core to
add an additional acceptor via a napthyridine (left) or alkoxide (right)... 136
Figure 3.7 Complexation equilibria between indoles 3-8b, 3-9b, 3-14b, and 3-18b and
(E)-2... 150
Figure 3.8 Indole N-H 1H NMR titration data and calculated binding isotherms for
complex formation between 3-8b, 3-9b, 3-14b, and 3-28b with (E)-2. Ka and calculated
free energy of complexation for each complex are noted beneath their respective binding
curves. All titrations were performed in CDCl3 at 298 K... 151
Figure 3.9 Indole 3-21b and acceptors (E)-2, (E)-3, and (E)-4 used for complexation
studies in CDCl3 and Toluene-d8... 154
Figure 3.10 Indole N-H 1H NMR titration data and calculated binding isotherms for
complex formation between 3-21b and (E)-2. Ka, calculated free energy of
complexation, and titration conditions are noted below their respected curves. Schematic
of complex is depicted at left... 155
Figure 3.11 Indole N-H 1H NMR titration data and calculated binding isotherms for
xxii
of the predicted complex is depicted at left... 157
Figure 3.13 Amido-napthyridine DAA array and a guanosine ADD array studied by
Hamilton (shown left) and a similar preorganized complex studied by Zimmerman and
Murray (shown right)... 160
Figure 3.14 Stacked plot of complex 2-21b·(E)-3 titration in toluene-d8 at 298 K; red
lines corresponds to the N-H, blue lines to NH2, and green lines to the C7-H. i) [(E)-3]: 0
M, ii) [(E)-3]: 5.25 x 10⁻⁴ M, iii) [(E)-3]: 1.09 x 10⁻³ M, iv) [(E)-3]: 2.00 x 10⁻³ M.
Schematic of the predicted binding complex is depicted above the spectra... 162
Figure 3.15 2D 1H NOESY spectrum of (E)-2·3-21b in toluene-d8 at 298 K.
Correlations of interest are indicated by red arrows in structure (shown left) and red lines
on spectrum... 163
Figure 3.16 Structures of 2 possible complex geometries of (E)-3·3-21b in solution.
Red arrows depict the NOESY correlations detected in the 2D 1H NMR spectrum... 164
Figure 3.17 2D 1H NOESY spectrum of (E)-4·3-21b·in toluene-d8 at 298 K.
Correlations of interest are indicated by green and red arrows in the above structures and
their corresponding green and red lines on spectrum... 165
Figure 3.18 Premise for synthesizing strong and soluble 2-aminoindole donors for
xxiii
Figure 3.19 Indole N-H 1H NMR titration data and calculated binding isotherms for
complex formation between 3-2d and (E)-2. Ka, calculated free energy of complexation,
and titration conditions are noted below their respected curves. Schematic of complex is
depicted at left... 168
Figure 3.20 Indole N-H 1H NMR titration data and calculated binding isotherms for
complex formation between 2-2d and (E)-3. Ka, calculated free energy of complexation,
and titration conditions are noted below their respected curves. Schematic of possible
complex geometries is depicted above titration curves... 169
Figure 3.21 Indole N-H 1H NMR titration data and calculated binding isotherms for
complex formation between 3-2e and (E)-2. Ka, calculated free energy of complexation,
and titration conditions are noted below their respected curves. Schematic of complex is
depicted at left... 171
Figure 3.22 Left: Indole N-H1H NMR titration data and calculated binding isotherm for
complex formation between 2-2e and (E)-3. Right: Indole Ar-H 1H NMR titration data
and calculated binding isotherm for complex formation between 2-2e and (E)-3. Ka,
calculated free energy of complexation, and titration conditions are noted below their
respected curves. Schematic of possible complex geometries are depicted above titration
curves... 172
Figure 3.23 Stacked plot of complex 3-23·(E)-3 titration in toluene-d8 at 298K. NH
resonances are labeled in red, NH2 resonances are labeled in blue, green lines correspond
to the Ar-H shifts. i) [(E)-3]: 0 M, ii) [(E)-3]: 7.50 x 10⁻⁴ M, iii) [(E)-3]: 1.50 x 10⁻³ M.
xxiv
aryl protons without NOESY interactions have been omitted for clarity... 180
Figure 3.26 Stick representations of complex (E)-3·2-5f. All N-H···N hydrogen bonds
of are shown as dashed orange lines, 7C-H5···N3 shown in red. All protons not
participating in hydrogen bonding have been removed for clarity... 182
Figure 3.27 Stick representation of the 1-5f·1-5f hydrogen bonded dimer in complex
(E)-3·1-5f. N2-H2B···N8' = N2'-H2B'···N8 = 3.03 Å, N2-H2B···N8' = N2'-H2B'···N8 =
171o... 183
Figure 3.28 Stick representations of complex (E)-4·2-3b. All hydrogen bonds are
shown as dashed orange lines. All protons not participating in hydrogen bonding have
been removed for clarity... 184
Chapter 4
Figure 4.1 Alternate forms of hydrogen bonded aggregates of trans- and
cis-p-azodibenzoic acids studied by Sleiman and co-workers... 215
Figure 4.2 Diarylethene maleimide and diaminotriazine hydrogen bonded complexes
studied by Hecht and co-workers. Ka values were determined via 1H NMR in CDCl3 at
298 K... 217
Figure 4.3 Photoswitchable indolylfulgimide and 2,6-bis(octanoylamino)pyridine
hydrogen bonded complexes studied by Yokoyama and co-workers. Ka values were
xxv
Figure 4.4 Complexation of guanadinium to a trans, trans di-azo isomer and a 33.3%
mixture of a cis, cis di-azo isomer studied by Hunter and co-workers. The star dictates the
signals monitored via 1H NMR to determine Ka values in DMSO-d6 at 298 K... 219
Figure 4.5 Isomerization of our hydrogen bonded complexes depicting strong and weak
interactions as a result of the Z isomers. The dashed lines of the acceptor array indicates
possible binding geometries... 220
Figure 4.6 UV-Vis absorption spectra of (E)-2 (top) and (E)-3 (bottom). Spectra were
recorded in CHCl3 at 1.0 x 10⁻⁴ M-1... 222
Figure 4.7 1H NMR spectra of (E)-2 recorded at 1 mM in toluene-d8 at 298 K (i) and
the photostationary state after 30 minutes of irradiation @ 360 nm (ii). Approximately
70% (Z)-2 was formed at the steady state... 223
Figure 4.8 1H NMR spectra of (E)-3 recorded at 1 mM in toluene-d8 at 298 K (i) and
the photostationary state after 30 minutes of irradiation @ 360 nm (ii). Approximately
35% (Z)-3 was formed at the steady state... 224
Figure 4.9 1H NMR spectra of pure (E)-2 isomer (i) and (Z)-2 isomer (ii) in CDCl3 at
298 K... 225
Figure 4.10 1H NMR spectra of pure (E)-3 isomer (i) and (Z)-3 isomer (ii) in CDCl3 at
298 K... 226
Figure 4.11 UV-Vis absorption spectra of (Z)-2 and its thermal reversion to (E)-2 in
toluene at 298 K. [(Z)-2] = 1.0 x 10⁻⁴ M-1. Isosbestic point at 380 nm... 227
Figure 4.12 UV-Vis absorption spectra (Z)-3 and its thermal reversion to (E)-3 in
xxvi
Figure 4.15 1H NMR stacked plot of the (Z)-2·2-3k reversion experiment performed in
CDCl3 at 298 K for 1 molar equivalent of (Z)-2. Red dots are (Z)-2 and blue dots are
(E)-2. The percentage of (Z)-2 for the correlating spectra is depicted at the right. The
shifting of the NH peak is illustrated by green dashed lines... 231
Figure 4.16 Plot of (E)-2 concentration and the NH chemical shift for 1, 3, 5, and 7
molar equivalents of (Z)-2 with respect to 2-3k. Regression fits are shown at the end of
the corresponding curves... 232
Figure 4.17 The NH chemical shift data of (E)-2 titration (black squares) and calculated
1:1 binding isotherm (red curve) and (Z)-2 extrapolated values (red dots) with a line of
best fit to guide the eye (red line)... 233
Figure 4.18 1H NMR stacked plot of the (Z)-2·3-21b reversion experiment performed
in toluene-d8 at 298 K for 1 molar equivalent of (Z)-2. Red dots are (Z)-2 and blue dots
are (E)-2. The percentage of (Z)-2 for the spectra is depicted at the right. The shifting of
the NH peak is identified using red lines and NH2 peak is identified using blue lines.. 235
Figure 4.19 Plot of (E)-2 concentration and the NH chemical shift for 1, 2, 3, 4, and 5
molar equivalents of (Z)-2 with respect to 3-21b. Regression R2 values are noted beside
xxvii
Figure 4.20 Plot of (E)-2 concentration and the NH chemical shift for 6, 8, and 10
molar equivalents of (Z)-2 with respect to 3-21b. Regression R2 values are noted beside
the legend... 236
Figure 4.21 Plot of (E)-2 concentration and the NH chemical shift for 15, 20, 25, and 30
molar equivalents of (Z)-2 with respect to 3-21b. Regression R2 values are noted beside
the legend... 237
Figure 4.22 Calculated indole N-H binding isotherm and the extrapolated data points of
the (Z)-2·3-21b reversions. Ka, calculated free energy of complexation, and experimental
conditions are noted below the schematic of the possible complex... 238
Figure 4.23 Calculated indole N-H binding isotherm and 1H NMR titration data for
complex formation between Pyridine and 3-21b. Ka, calculated free energy of
complexation, and titration conditions are noted below the schematic of the complex..239
Figure 4.24 A comparison of all data points and calculated N-H binding isotherms for
(E)-2, (Z)-2, and Py with 3-21b... 239
Figure 4.25 Calculated indole N-H binding isotherm and 1H NMR titration data for
complex formation between Nap and 3-21b. Ka, calculated free energy of complexation,
and titration conditions are noted below the schematic of the complex.. Dashed methyl
groups indicate that they could be on either side during complexation... 241
Figure 4.26 Plot of (E)-3 concentration and the NH chemical shift for 0.5, 1, 1.5, 2, and
2.5 molar equivalents of (Z)-3 with respect to 3-21b. Regression R2 values are noted
xxviii
Figure 4.29 The diaminopyridine and uracil-E- and Z-azobenzene hydrogen bonded
DAD-ADA complexes studied by Bonifizi and co-workers... 246
Figure 4.30 The rate of thermal reversion of the Z-DAD-ADA complex (above) and the
uracil-Z-azobenzene separately (below)... 247
Figure 4.31 1H NMR spectra of a 1:1 solution of (E)-2·3-21b (i), the same solution
after 350 nm irradiation (ii), the same solution after 530 nm irradiation (iii). The shifting
of the NH peaks are identified by red lines and the NH2 peaks by blue lines. Spectra
were collected in toluene-d8 at 298 K... 248
Figure 4.32 Cyclization isomerization plot of a 1:1 solution of (E)-2·3-21b in
toluene-d8 at 298 K. Blue areas indicate UV irradiation (350 nm) and white areas visible light
irradiation (~530 nm)... 249
Figure 4.33 1H NMR spectra of a 2:1 solution of (E)-3·3-21b (i), the same solution
after 350 nm irradiation (ii), the same solution after 530 nm irradiation (iii). The shifts of
the NH peaks are identified by red lines and the NH2 peaks by blue lines. Spectra were
collected in toluene-d8 at 298 K... 250
Figure 4.34 The NH binding data and calculated isotherms of (E)-2 titration (black
xxix
energies of complexation, and experimental conditions are listed below the respective
complexes... 252
Figure 4.35 The NH (red dots), NH2 (black squares), and C7-H (green triangles)
binding data and calculated binding isotherms of the (Z)-3 extrapolated values with 3-2e.
Possible binding geometries are depicted on the left. All data collected in toluene-d8 at
298 K... 255
Figure 4.36 1H NMR spectra of a 1:1 solution of (E)-2·3-2e (i), the same solution after
350 nm irradiation (ii), the same solution after 530 nm irradiation (iii). The shifts of the
NH peaks are identified by red lines and the NH2 peaks by blue lines. Spectra were
collected in toluene-d8 at 298 K... 257
Figure 4.37 Stick representation of the P and M conformers of molecule A of (Z)-2. 259
Chapter 5
Figure 5.1 Plausible hydrogen bonded complexes which would provide strong
association constants... 274
Figure 5.2 Modification of (E)-3 where an aryl group would sterically block hydrogen
bonding in the trans form and strong binding in the cis form... 275
Figure 5.3 A photoswitchable, double helical hydrogen bonded complex... 276
Figure 5.4 Plausible tritopic indole monomers synthesized via Sonogashira and click
coupling... 277
Figure 5.5 Plausible ditopic indole monomers synthesized by coupling reactions (i) and
xxx
affinity to cations when the ether is fused as a macrocycle... 17
Scheme 1.3 Meijer's 6(1H)-pyrimidinone and its respective two tautomeric forms and
their resulting complexes. Intramolecular hydrogen bonds are shown in red... 19
Scheme 1.4 The two tautomeric forms of dihydropyridine array and the resulting
complex with a AAA array... 20
Scheme 1.5 Photoswitching examples where isomerization occurs via intramolecular
pericyclic processes... 25
Scheme 1.6 Photoswitching examples were isomerization occurs via trans/cis (E/Z)
processes... 25
Scheme 1.7 Isomerization by intramolecular group transfer of a polycyclic quinone
(above) and a perimidinespirocyclohexadienone (below)... 26
Scheme 1.8 Photoswitching examples were isomerization occurs via intermolecular
pericyclic processes... 26
Scheme 1.9 Examples of "stilbene" type photoswitches which participate in E/Z
isomerization... 27
Scheme 1.10 Synthesis of phenanthrene via continuous irradiation of stilbene... 29
xxxi
Scheme 1.12 Photodegradation of a diarylethene photoswitch via 1,2-dyotropic
rearrangement... 30
Scheme 1.13 Molecular hinge synthesized by Tamaoki and co-workers... 34
Scheme 1.14 Molecular scissors synthesized by Aida and co-workers... 35
Scheme 1.15 Metal coordinating molecular "phototweezers" synthesized by Shinkai and
co-workers... 37
Scheme 1.16 Photoswitchable guanidinium receptor synthesized by Hunter and
co-workers... 38
Scheme 1.17 Photoswitchable oligonucleotide synthesized by Komiyama and
co-workers... 39
Scheme 1.18 Photoswitchable aromatic stacking host-guest complexes synthesized by
Rotello and co-workers... 40
Scheme 1.19 Photocontrolled pseudorotaxane synthesized by Jeong and co-workers.. 42
Scheme 1.20 Photoswitchable catalyst for Henry reactions synthesized by Hecht and
co-workers... 43
Scheme 1.21 Photoswitchable hydrogen bonded supramolecular polymer containing a
1,1-biindane moiety synthesized by Yang and co-workers... 45
Chapter 2
Scheme 2.1 Two indole forming reactions from the literature using Ullman Type Cu(I)
coupling procedures... 67
Scheme: 2.2 Synthesis of o-brominated anilines and N-(o
xxxii
...72
Scheme 2.7 Synthesis of 2,2'-azopyridine... 73
Scheme 2.8 Synthesis of 5-hexylsulphonyl-(2-5f) and 5-octyloxycarbonyl-(2-6d)
2-aminoindole-3-carbonitrile... 85
Chapter 3
Scheme 3.1 Synthesis of ortho-iodinated anilines (3-1a,b), 1H-2-carboxylic acid indoles
(3-2a,b), and tert-butyl (1H-indol-2-yl)carbamate indoles (3-3a,b)... 137
Scheme 3.2 Synthesis of the 3-NO2 (3-4a), 3-COCF3 (3-5a), and 3-CHO (3-6a)
derivatives of tert-butyl (5-nitro-6-(trifluoromethyl)-1H-indol-2-yl)carbamate... 139
Scheme 3.3 Synthesis of the 3-NO2 (3-7a), 3-COCF3 (3-8a), and 3-CHO (3-9a)
derivatives of 5-nitro-6-(trifluoromethyl)-1H-indol-2-amine... 140
Scheme 3.4 Synthesis of the 3-NO2 (3-4b), 3-COCF3 (3-5b), and 3-CHO (3-6b)
derivatives of tert-butyl (5-(trifluoromethyl)-1H-indol-2-yl)carbamate... 141
Scheme 3.5 Synthesis of the 3-NO2 (3-7b), 3-COCF3 (3-8b), and 3-CHO (3-9b)
derivatives of 5-(trifluoromethyl)-1H-indol-2-amine... 141
Scheme 3.6 Synthesis of the 3-iodo (3-10b), 3-bromo (3-11b), and 3-chloro (3-12b)
derivatives of tert-butyl (5-(trifluoromethyl)-1H-indol-2-yl)carbamate and unsuccessful
xxxiii
Scheme 3.7 Attempted synthetic strategies to install an alkyl keto-substituent onto
tert-butyl (5-(trifluoromethyl)-1H-indol-2-yl)carbamate... 143
Scheme 3.8 Synthesis of a 3-phen-acyl derivative of tert-butyl (5-(trifluoromethyl)-1H
-indol-2-yl)carbamate (3-13b) and 3-p-NO2-phenacyl-5-(trifluoromethyl)-1H
-indol-2-amine (3-14b)... 144
Scheme 3.9 Attempted synthetic strategies to install a sulfone-substituent onto tert-butyl
(5-(trifluoromethyl)-1H-indol-2-yl)carbamate... 145
Scheme 3.10 Synthesis of the sulfonyl-cyano active methylene compound (3-16b) and
the 3-hexyl-sulphonyl derivative of 5-(trifluoromethyl)-1H-indol-2-amine (3-18b) using
the Cu(I) catalysis procedure... 146
Scheme 3.11 Synthesis of octyl cyanoacetate... 146
Scheme 3.12 Synthesis of octyl 2-amino-5-nitro-6-(trifluoromethyl)-1H
-indole-3-carboxylate (3-21b)... 147
Scheme 3.13 Synthesis of (E
)-2,4-dimethyl-7-(pyridin-2-yl-diazenyl)-1,8-naphthyridine, (E)-3... 148
Scheme 3.14 Synthesis of (E
)-2-methoxy-4-(piperidin-1-yl)-6-(pyridin-2-yl-diazenyl)-1,3,5-triazine, (E)-4... 149
Scheme 3.15 Total synthesis of 5-trifluoromethyl and
xxxiv
Ar aryl
hydrogen bond acceptor properties
ArF tetrakis(3,5-bis(trifluoromethyl)phenyl)borate Boc tert-butoxycarbonyl
BPh4 tetraphenylborate
t
BuOH tert-butanol
BzCl benzoyl chloride
CO2Et ethyl ester
COMe acetyl
d doublet
dd doublet of doublets
D hydrogen bond donor
DABCO 1,4-diazabicyclo[2.2.2]octane
DAP diaminopyridinium
DCC N,N'-dicyclohexylcarbodiimide
DCM dichloromethane
chemical shift
heat
free energy
free energy difference
xxxv DMF N,N'-dimethylformamide
DMSO dimethylsulfoxide
DMSO-d6 deuterated dimethylsulfoxide
DNA deoxyribonucleic acid
DOP degree of polymerization
DPPA diphenylphosphoryl azide
E entgegen or trans
Et ethyl
Et2O diethyl ether
EtOAc ethyl acetate
HRMS(EI) Electron Impact Ionization High Resolution Mass Spectrometry
eq. equivalent
g grams
G guest
h wavelength
Hz hertz
H host
mCPBA meta-chloroperbenzoic acid
MHz megahertz
MeOH methanol
IR infrared
IUPAC International Union of Pure and Applied Chemistry
ITC isothermal titration calorimetry
K Kelvin
Ka association constant
kcal kilocalories
kJ kiloJoules
xxxvi
m multiplet
Me methyl
m.p. melting point
M-1 per molar
min minutes
mL milliliters
L microliters
micromolar
mmol millimole
mol-1 per mole
NBS N-bromosuccinimide
NCS N-chlorosuccinimide
NEt3 triethylamine
NIS N-iodosuccinimide
NMF N-methylformamide
NMR Nuclear Magnetic Resonance
NOESY Nuclear Overhauser Effect Spectroscopy
ºC degrees Celsius
OMe methoxide
P plus-handed helicity
PAP 2,2'-azopyridine
xxxvii PhI(OAc)2 (diacetoxyiodo)benzene
pi orbital
Pg protecting group
pH minus logarithm of proton concentration
ppm parts per million
n-PrOH 1-propanol
PSS photostationary State
Py pyridine
q quartet
R correlation coefficient
Rf retention factor
RT room temperature
s singlet
Σ sum
s-cis "sigma" cis isomer
s-tran "sigma" trans isomer
Hammett substituent constant m substituent constant at meta-position
p substituent constant at para-position
t triplet
T temperature
TBDMS tert-butyldimethylsilyl
TFA trifluoracetic acid
TFAA trifluoroacetic anhydride
THF tetrahydrofuran
TLC thin layer chromatography
Tm melting temperature
xxxviii VDW van der Waals
Vis visible light
v.s. versus
Chapter 1
1
Introduction
1.1 Supramolecular Polymers
E. W. Meijer is one of the highest regarded synthetic supramolecular chemists of
the last 30 years. He and his fellow authors have given a precise definition of
supramolecular polymers in 2001:
" Supramolecular polymers are defined as polymeric arrays of monomeric units that are
brought together by reversible and highly directional secondary interactions, resulting in
polymeric properties in dilute and concentrated solutions, as well as in the bulk."1
In other words, as typical polymers are mainly governed by the covalent linkages
between monomers, monomers or macromonomers for supramolecular networks are held
together by non-covalent forces. If these interactions are arranged properly,
supramolecular polymers can behave like traditional polymers but with an added aspect
of reversibility. Supramolecular monomers contain end groups which can reversibly
interact with one another which is why the term "smart materials" has also been given to
these types of materials. These end groups can self-assemble and dissociate when
exposed to external stimuli of three different classifications: Physical (e.g. light),2
Chemical (e.g. pH),3 and Biochemical (e.g. enzymatic).4
1.2 Types of Supramolecular Polymers
When considering supramolecular polymer synthesis, there are 5 main scaffolds
donor-acceptor type.10 Aromatic donor-acceptor types are usually too weak to involve
π-stacking on their own so other interactions are also used to help drive polymerization (ex.
dipole-dipole, hydrogen bonding, etc). A variety of first three types will be explored in
this dissertation.
1.3 Intermolecular Interactions
Jean-Marie Lehn's description of "chemistry beyond the molecule" for
supramolecular chemistry is possible due to intermolecular interactions.11 These
interactions are intermolecular for supramolecular polymerization but can also occur
intramolecularly for some examples. Non-covalent, supramolecular, and reversible
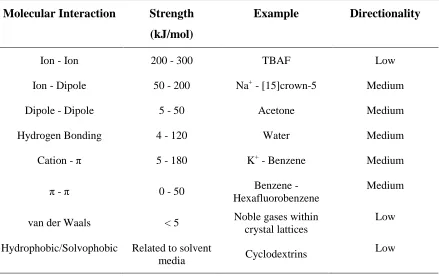
interactions can all be used as a labels for these forces. Table 1.1 lists these interactions
Table 2.1 Types of molecular interactions with respective strengths, examples, and directionalities.
Molecular Interaction Strength
(kJ/mol)
Example Directionality
Ion - Ion 200 - 300 TBAF Low
Ion - Dipole 50 - 200 Na+ - [15]crown-5 Medium
Dipole - Dipole 5 - 50 Acetone Medium
Hydrogen Bonding 4 - 120 Water Medium
Cation - π 5 - 180 K+ - Benzene Medium
π - π 0 - 50 Benzene -
Hexafluorobenzene
Medium
van der Waals < 5 Noble gases within
crystal lattices
Low
Hydrophobic/Solvophobic Related to solvent
media Cyclodextrins
Low
These interactions are important for constructing supramolecular systems but are
also important in nature and biology. Water has a high surface tension and boiling point
due to hydrogen bonding and hydrocarbon boiling points are related to their van der
Waals surface areas. Arguably, the most important biological macromolecule structure is
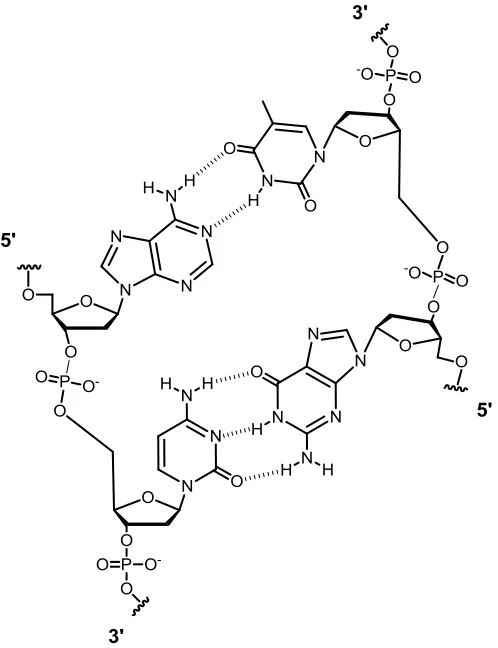
DNA and was structurally elucidated by Watson and Crick.13 Base pairs are hydrogen
bonded together along with π-stacking interactions which is all covalently bound to an
anionically charged phosphate backbone to assist in charge balance and hydrophilicity
(Figure 1.1). Proteins can form multiple simple and complex macromolecular assemblies
Figure 2.1 Complementary purine-pyrimidine base pairing within the DNA double helix.
interactions between amino acid side chains and amide hydrogen bonding between
strands (ex. α-helices and β-pleated sheets).14
Enzymatic processes are also highly
dependent on these interactions. Emil Fischer coined the term "lock and key" for
enzymes where the substrate and enzyme interact with one another to initiate a chemical
transformation.15 A good example is the enzyme chymotrypsin where cleavage at the C
terminus of hydrophobic residues occurs because of a "hydrophobic pocket" next to the
therefore holds a central position in the construction of supramolecular synthons because
of their relative directionality and reversibility.
1.4 Hydrogen Bonding
Hydrogen bonding is an interaction classified on its own but can also be
considered a dipole-dipole interaction. The IUPAC definition states that the hydrogen
bond is an attractive interaction between a hydrogen atom from a molecule or a
molecular fragment D-H in which D is more electronegative than H, and an atom or
group of atoms in the same or a different molecule (A), in which there is evidence of bond
formation.17 Therefore, the electronegativity of D inductively makes the hydrogen atom
electropositive in nature where then a lone pair of a different nearby electronegative atom
can interact through space creating a "hydrogen bond" (Scheme 1.1)
Scheme 2.1 Hydrogen bonded interaction between a donor (D-H) and acceptor (A) with a depiction of their relative dipoles.
There are two main classification methods for hydrogen bonding. The first is
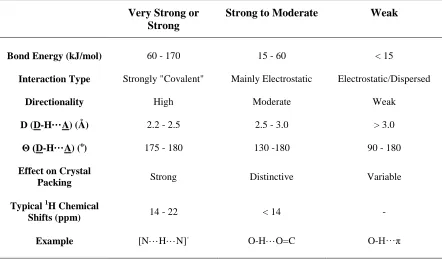
based on the relative strength of the binding pairs. Table 1.2 outlines these strengths,
D (D-H···A) (Å) 2.2 - 2.5 2.5 - 3.0 > 3.0
Θ (D-H···A) (o
) 175 - 180 130 -180 90 - 180
Effect on Crystal
Packing Strong Distinctive Variable
Typical 1H Chemical
Shifts (ppm) 14 - 22 < 14 -
Example [N···H···N]- O-H···O=C O-H···π
This table is a broad classification but there are typical factors displayed which
are evident in all hydrogen bonded complexes. The bond energies are higher when the
hydrogen bonding distance are short ( < 2.5 Å ) and the angle taken up by the three
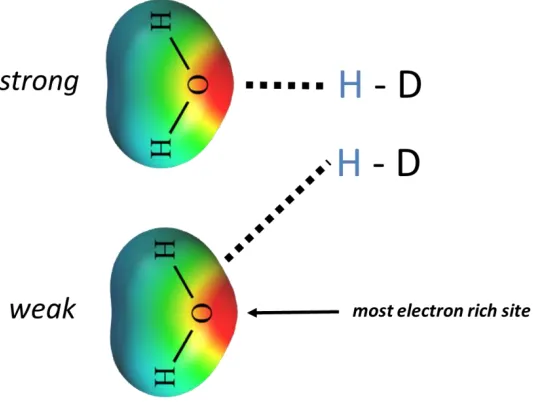
binding atoms are as close to 180o as structurally possible.18,19a,b This angle is dependent
on the surface potentials of the functional groups involved where the energy maxima are
Figure 1.2 Hydrogen bonding displayed with two water molecules. The strong hydrogen bond (above) has the optimal 180o angle as the electrostatic surface potentials
are maximized in dipole pairs. Red surfaces represents electron rich areas and blue surfaces and H atoms electron poor areas.
There are four main properties of intermolecular interactions to take into
consideration when evaluating binding strengths due to hydrogen bonding: repulsion,
induction, dispersion and electrostatics. The first three properties do not contribute a lot
to hydrogen bond complexation so Hunter developed a set of parameters based on
electrostatic surface potentials.20 Expanding on the work of Abraham,21a,b in 2004 Hunter
defined two variables α and β.
α = Emax/52 kJ/mol = 4.1( + 0.33) β = Emax/52 kJ/mol = 10.3( + 0.06)
α defines hydrogen bonding donor strength and β hydrogen bonding acceptor strength.
and are variables developed by Abraham which relate the log K of interacting
functional groups which are free energy related. Emax and Emin are the maxima and
new parameters have effectively been used to estimate binding strengths between two
molecules in a variety of solvents.22
The other method of classification is based on the binding arrangements. Figure
1.3 outlines the most common spatial arrangements observed in the literature. The most
favorable being the linear array with an optimal 180o angle. This mode is seen in
contiguous linear complementary arrays which results in large association constants. The
bent binding pair is not a strong interaction between two different arrays but is a common
intramolecular interaction (see section 1.5.4). The remaining arrangements are all a
combination of linear and bent binding pairs which create bi- and trifurcated structures
which can vary from weak to strong depending on the nature of the participating donors
Figure 1.3 Common spatial arrangements of hydrogen bonding interactions with possible structural examples below each classification.
1.5 Factors which effect Hydrogen Bonding Complexes
Hydrogen bonds are extremely useful when creating complexes for potential
supramolecular polymers. The directionality and reversibility of these interactions are
powerful but there are factors that must be taken into consideration to maximize those
qualities. The number of binding pairs, the sequence of those pairs, and how strongly the
individual donor and acceptor atoms are polarized are primary features which, when
binding strengths are reported as association constants, Ka. Self-complementary
complexes contain a single array where the stabilities are reported as dimerization
constants, Kd, as the array spontaneously forms a dimeric complex.
The number of binding pairs in complementary complexes has been shown to be
directly correlated to the strength of the complex. Leigh and co-workers have
demonstrated this with the popular dihydropyridine donor array.24 The acceptor 1-2a
contains two contiguous acceptor nitrogens shown in Figure 1.4. The association
constant was measured to be 6.0 x 10⁴ M-1 with dihydropyridine array 1-1. The
association constant of the same donor array with acceptor 1-2b was observed to be 2
orders of magnitude greater (7.0 x 10⁶ M-1) as 1-2b contains an additional pyridine
Figure 1.4 Hydrogen bonding complexes examined by Leigh and co-workers demonstrating the importance of multiple binding pairs.
1.5.2 Sequence Dependence of Binding Pairs
Hydrogen bond arrays work cooperatively when they form complexes. Since
each donor and acceptor have their own dipole, when the same dipoles are in close
proximity to one another, repulsions begin to occur. Conversely, if different dipoles are
in close proximity, attractive interactions form. The phenomena are referred to as
secondary interactions and have a large effect on complex stability. Figure 1.5 depicts
these interactions using 3 triply hydrogen bonded complexes as examples. From left to
right, the number of attractive secondary interactions increase as each individual array
begins to contain contiguous donors or acceptors. In doing so, the
Figure 1.5 Secondary interactions in triply hydrogen bonded complexes.
Sartorious and Scheinder proposed that each primary hydrogen bond contributes
7.9 kJ/mol in free energy of complexation and secondary interactions contribute 2.9
kJ/mol in free energy.25a,b If these values are taken into consideration, the complexation
stabilities shown in Figure 1.6 follow this trend. Complex 1-3·1-4 has the lower binding
constant because half of the secondary interactions are repulsive in nature.26 The
complex with entirely attractive secondary interactions (1-1·1-2b) has the higher
complexation constant.
Figure 1.6 Two hydrogen bonded complexes depicting their respective secondary interactions and the resulting complex strengths. Red and black arrows represent
1.5.3 Polarization
Hydrogen bonded arrays can be functionalized with electron withdrawing or
donating substituents to improve the resulting complex stability. Withdrawing groups
attached to donor arrays increase the electropositive charge on the hydrogen atom.
Conversely, electron donating groups incorporated into acceptor arrays increase the
partial negative charge on the heteroatom containing the lone pair for binding. Using
computational methods, Reynisson and McDonald examined this effect with a single
hydrogen bond. Bond strengths of a variety of para-substitutued phenols were calculated
with a formaldehyde acceptor and as the electron withdrawing capabilities of the phenol
substituent increased, the association constant always increased.27 Plotting the change in
binding strength against the Hammett substituents constants (σ values) resulted in a
positive, linear correlation (Figure 1.7). Boyd and co-workers also determined binding
Figure 1.7 Plot of Hammett constants (σpara) corresponding to substituent X on phenol
derivatives with the change in binding strength with a formaldehyde acceptor studied by Reynisson and McDonald. Depiction of the singly hydrogen bonded complex is shown
on the left.
a triply bonded contiguous array was examined in the gas phase and the same increase of
binding strength was observed with stronger withdrawing groups (Figure 1.8).28
Figure 1.8 The gas phase AAA-DDD arrays studied by Boyd and co-workers. Depiction of the complex studied shown on the left with substituents and binding
Our group studied complementary double helical arrays with a variety of
substitution patterns.29 Bis-indolyl-thiazine dioxide hydrogen bond donor arrays were
synthesized with a variety of para-substituted electron withdrawing groups on the indole
relative to the NH. These were titrated with bis-pyridyl lutidine (Z = H) and the
association constants ranged from 3.0 x 10³ to 1.1 x 10⁵ M-1 (Figure 1.9). Even higher
still were the association constants when an amino group was installed in the acceptor
array (Z = NH2) with the highest value reaching 4.8 x 10⁵ M-1 in CDCl3. In all three
examples just discussed, the greatest increase in complexation strength arose from
withdrawing groups with added resonance as opposed to only inductive effects.
Figure 1.9 Double helical AAA-DDD complexes studied by Wisner and co-workers. Depiction of the complex shown on the left and the substituents studied with respective
association constants are compiled on the right.
The addition of charges is also an efficient method to highly polarize donor or
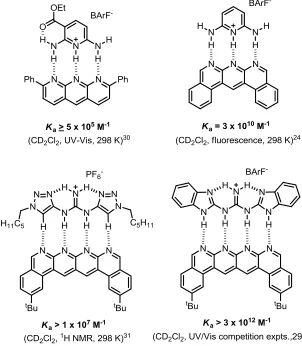
acceptor arrays. For example, diaminopyridinium and guanadinium analogues have
Figure 1.10 Four complementary complexes with extremely high association constants as a result of positively charged donor arrays.
1.5.4 Preorganization
The principle of preorganization was described by Cram and states that the two
arrays should be optimally aligned in a low solvation environment for maximum complex
stability.33 The orientation of the interacting groups should therefore be at their optimal
binding geometry with little to no position deviation for complex formation. Rotation
about these groups around sigma bonds can cause disruptions in the binding
arrangements and require additional energy to obtain the proper complex geometry.
approximately 1 kcal/mol in free energy of the complex.34 Cram and co-workers have
extensively studied this preorganization concept with cation complexation to linear and
cyclic crown ethers.35a,b The acyclic polyether 1-5 in Scheme 1.2 is free to exist in many
conformers in solution as it is not preorganized into a macrocycle.
Scheme 1.2 Polyethers studied by Cram and co-workers which demonstrate a stronger affinity to cations when the ether is fused as a macrocycle.
Cram and co-workers determined the association constants with sodium and potassium
cations (provided as picrate salts) were chips measured to be a maximum of 4.2 x 10³
M-1. Polyether 1-6 provided much higher association constants for the same cations, an
effect attributed to the ether's fusion to the naphthalene ring. This tethering technique has
since been applied to complementary linear arrays36 and double helical arrays.37
Intramolecular hydrogen bonding is also a useful technique for preorganizing
binding pairs. In particular, 6-membered intramolecular hydrogen bonding will form in