Entropy-based Training Data Selection
for Domain Adaptation
Yan Song
1,2P rescot t Klassen
1Fei X ia
1Chun yu Kit
21University of Washington, Seattle, WA 98195, USA 2City University of Hong Kong, Kowloon, Hong Kong SAR, China
{yansong,klassp,fxia}@uw.edu, [email protected]
A
BSTRACTTraining data selection is a common method for domain adaptation, the goal of which is to choose a subset of training data that works well for a given test set. It has been shown to be effective for tasks such as machine translation and parsing. In this paper, we propose sev-eral entropy-based measures for training data selection and test their effectiveness on two tasks: Chinese word segmentation and part-of-speech tagging. The experimental results on the Chinese Penn Treebank indicate that some of the measures provide a statistically significant improvement over random selection for both tasks.
1 Introduction
The performance of Natural Language Processing (NLP) systems often degrades signifi-cantly when training and testing data come from different domains. There has been extensive research on methods for domain adaptation including training data selection (e.g.,(Moore and Lewis, 2010; Plank and van Noord, 2011)), model combination (e.g., (McClosky et al., 2010)), feature copying (Daume III, 2007), semi-supervised learning (e.g., (McClosky et al., 2006)), and many more.
The goal of training data selection is to choose a subset of training data that was similar to a given test data set. The challenge is to find a good measure for calculating the similarity between training sentences and the test data set. Moore and Lewis (2010) calculated the difference of the cross entropy values for a given sentence, based on language models from the source domain and the target domain. Axelrod et al. (2011) adopted the idea of cross entropy measurement for training data selection for machine translation, in three different ways: the first directly measured cross entropy for the source side of the text; the second is similar to (Moore and Lewis, 2010) and ranked the data using cross entropy difference; and the third, took into account the bilingual data on both the source and target side of translations. Both studies showed that the selected subset of training data worked better than the entire training corpus for machine translation. Plank and van Noord (2011) inves-tigated several different training data selection methods aimed at enhancing dependency parsing and part-of-speech (POS) tagging. These methods were classified into two cate-gories, probabilistically-motivated and geometrically-motivated. Their work proved again that models trained on data selected by data selection methods outperform those trained on randomly selected data.
In this paper, we explore the use of entropy-based methods for training data selection and evaluate their effect on the tasks of Chinese word segmentation (CWS) and POS tagging.
2 Methodology
In this study, we first test whether there is a strong correlation between system performance and cross entropy of two probability distributions estimated from the training data and the test data. If that is the case, it implies that entropy-based measures could be effective for training data selection. We then propose several new entropy-based measures and test their effects on two NLP tasks: CWS and POS tagging. For evaluation, we use the Chinese Penn Treebank as described below.
2.1 Data
The Chinese Penn Treebank (CTB) was developed in the late 1990s (Xia et al., 2000) and each sentence is word segmented, part-of-speech tagged, and bracketed with a scheme similar to the English Penn Treebank (Marcus et al., 1993). Its latest release is version 7.0
1, which contains more than one million words from five genres: Broadcast Conversation
(BC), Broadcast News (BN), Magazine (MZ), Newswire (NW), and Weblog (WB). Some statistics of CTB7 are given in Table 1.
We have used CTB 7.0 for multiple experiments, some of them not directly related to this study. To prepare the data for all of our experiments, we divide the data in each genre into
Genre # of
chars # ofwords # offiles Source Broadcast
Conver-sation (BC) 275,289 184,161 86 China Central TV, CNN,MSNBC, Phoenix TV, etc. Broadcast News
(BN) 482,667 287,442 1,146 China Broadcasting Sys-tem, China Central TV, China National Radio, Voice of America, etc. Magazine (MZ) 402,979 256,305 137 Sinaroma
[image:3.420.68.366.68.213.2]Newswire (NW) 442,993 260,164 790 Xinhua News, Guangming Daily, People’s Daily, etc. Weblog (WB) 342,116 208,257 214 Newsgroups, Weblogs Total 1,946,044 1,196,329 2,373
Table 1: Statistics of the CTB 7.0.
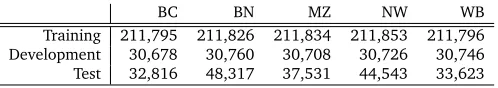
ten folds based on character counts, and use the first eight folds for training, the next fold for development, and the last fold for testing. In order to study the effect of genre variation on system performance, we want the size of the training data for each genre to be the same, so we set the training size to be the size of the training folds in the BC genre (the smallest genre in the CTB 7.0). We do the same for the development data. For testing, we use the whole test fold for each genre. The sizes of the data sets used in the experiments are shown in Table 2. Although we are not using the development fold for the experiments in this study, we chose to use the same data split for training and test to facilitate comparison with our other experiments.
BC BN MZ NW WB
Training 211,795 211,826 211,834 211,853 211,796 Development 30,678 30,760 30,708 30,726 30,746 Test 32,816 48,317 37,531 44,543 33,623
Table 2: CTB 7.0 Genre character counts for data splitting.
2.2 System performance and cross entropy
In order to determine whether entropy-based measures are helpful in training data selec-tion, we first check whether cross entropy correlates with system performance. For this, we first trained and tested the Stanford POS Tagger2(Toutanova et al., 2003) on the CTB
7.0. The results are in Table 3, in which the training and testing genres are indicated by row labels and column labels, respectively.
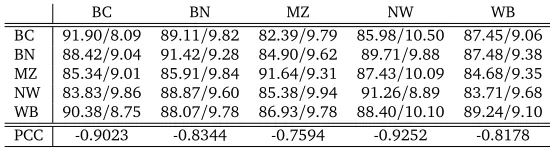
In the top part of the table, each cell(i,j)has two numbers, whereiis the row andjis the column. The first number is the tagging accuracy, when the tagger is trained on the training data of the genrei, and tested on the test data of the genrej. The second number is cross entropy of the test data, estimated by a trigram language model built from the training data using the CMU-Cambridge LM Toolkit3. The final row in the table lists the
[image:3.420.94.343.320.364.2]Pearson Correlation Coefficient (PCC) between tagging accuracy and the cross-entropy for each column.
BC BN MZ NW WB
[image:4.420.64.339.96.170.2]BC 91.90/8.09 89.11/9.82 82.39/9.79 85.98/10.50 87.45/9.06 BN 88.42/9.04 91.42/9.28 84.90/9.62 89.71/9.88 87.48/9.38 MZ 85.34/9.01 85.91/9.84 91.64/9.31 87.43/10.09 84.68/9.35 NW 83.83/9.86 88.87/9.60 85.38/9.94 91.26/8.89 83.71/9.68 WB 90.38/8.75 88.07/9.78 86.93/9.78 88.40/10.10 89.24/9.10 PCC -0.9023 -0.8344 -0.7594 -0.9252 -0.8178
Table 3: Results of Stanford POS Tagger on CTB 7.0 genre sub corpora with trigram cross entropy calculated on training and test and Pearson Correlation Coefficient on columns.
Table 3 indicates there is a strong inverse correlation between cross entropy and perfor-mance for POS tagging. Based on this result, we propose to use entropy-based measures for training data selection and test their effect on the tasks of Chinese word segmentation and POS tagging.
3 Entropy-based Measures
In this section, we propose several new entropy-based measures for training data selection.
3.1 Difference of Entropy (DE)
Eq 1 shows the standard definition of entropy in information theory, whereXis a discrete random variable withmpossible outcomes{x1, ...,xm}andpis a probability distribution
ofX.
H(X) =−
m ∑
i=1
p(xi)logp(xi) (1)
Given a sentences, we represent sas a set of information units {x1, ...,xn}, where an
information unit can be a word/character unigram or a bigram.4 Letpbe the probability
distribution over all the information units collected from a data setC. Instead of calculating the entropy of the random variableX as in Eq 1 which uses all the possiblexi inC, we
want to focus only on thexiins; therefore, we define a new functionH(s,p)as in Eq 2.
H(s,p) =−
n ∑
i=1
p(xi)logp(xi) (2)
Now letpandqbe the probability distributions estimated from the training data and the test data, respectively. Letsbe a sentence in the training data. We define the difference of sentence entropy,DE(s,p,q), as in Eq 3. Intuitively, choosing sentences with lowDEvalues
means we prefer sentences whose information unitsxihave similar values with respect to pandq.
DE(s,p,q) =|H(s,p)−H(s,q)| (3)
3.2 Cross Entropy (CE)
Similar to the difference between Eq 1 and 2, one could use a variation of cross entropy (CE) to calculate the cross entropy for a sentencesover two discrete probability distribu-tionspandq, wherepandqare estimated from the training and test data, respectively.
C E(s,p,q) =−
n ∑
i=1
p(xi)logq(xi) (4)
3.3 Average Entropy Gain (AEG)
LetC be the test corpus andsbe a sentence. The third measure, entropy gain (EG), is defined as in Eq 5, whereqis a probability distribution estimated fromC andq1is one estimated fromC+s, a new corpus formed by addingstoC. Intuitively, ifsis similar toC,
q1will be very similar toqandEG(s,c)will be small.
EG(s,C) =|H(C+s,q1)−H(C,q)| (5)
The measures in Eq 3-5 can all be normalized by sentence length. For instance, Eq 6 shows the normalized entropy gain. We call it Average Entropy Gain (AEG).
AEG(s,C) =leng th(s)EG(s,C) (6)
3.4 Descriptive Length Gain (DLG)
Description length gain (DLG) is a goodness measure proposed by (Kit and Wilks, 1999) as an unsupervised learning approach to lexical acquisition (Kit, 2005; Kit and Zhao, 2007). Intuitively, the DLG of a stringstrw.r.t. a corpusC,DLG(str, C), indicates the reduction of description length ofCwhen the characters in strare treated as a unit and all the occurrences ofstrinCare replaced by the index of the unit. Therefore, the more frequent
stris inCand the longerstris, the higherDLG(str,C)is. The DLG calculation resorts to a re-implementation of the suffix array approach to counting n-grams (Kit and Wilks, 1998). Based on this property, we define a similarity measure,Sim(s,C), between a training sen-tencesand the test corpusCas the average of DLG scores of substrings ins, as shown in Eq 7. Here,Subst r(s)is the set of substrings ins, andnis the size of the set. HighSim(s,C)
scores indicate thatsis closer toCin the sense that the substrings instend to have high DLG scores with respect toC.
Sim(s,C) =1 n
∑
st r∈Subst r(s)
DLG(st r,C) (7)
4 Experiments
P(wi−1,wi)(DE-2J), a bigram with conditional probabilityP(wi|wi−1)(DE-2C), or other
ngrams. The same is true for CE and AEG. We use each measure to rank training sentences (in ascending order for DE, CE, and AEG and in descending order for the DLG-based mea-sures), choose the top x% of the training data, train a word segmenter or a POS tagger (as described below), and compare the results with the system trained on x% of randomly selected training data (RDM).
The results of our experiments were tested for significance using a ten-partition two-tailed paired Student t-test, comparing each entropy-based measure with the average of three random experiments. To be more specific, the t-test was conducted in the following steps: (1) split the test data into N chunks (N is set to 10 in these experiments). (2) calculate the system performance on each chunk when using random selection vs. a particular selection method (e.g., DLG). That gives us 10 pairs of scores. (3) compute t-test scores to determine whether the difference between random selection and a particular selection method is statistically significant. In Tables 4 and 5, 95% confidence for significance is indicated by a single asterisk and 99% confidence by two asterisks.
Of the five genres in the CTB 7.0, we use BC as the test genre and BN, MZ, NW, WB as training genres. 5The test data is the test portion of BC; the training data is the union of
the training portions of the other four genres.
4.1 Chinese Word Segmentation
For word segmentation, we used a Conditional Random Fields word segmenter as de-scribed in (Song and Xia, 2012), which uses similar character tags and features as in (Zhao and Kit, 2011). We train the segmenter with a fixed percentage of training data and test the segmenter on the test data. The results are in Table 4.6The table shows that
the performances of these entropy-based measures vary a lot: while some measures (e.g., DE-2J) are not better than random selection, others (e.g., DLG) provide a modest gain. For instance, seven of the ten results for DLG are statistically significant better than random selection at p=0.05, and four of these seven are significant at p=0.01.
4.2 POS Tagging
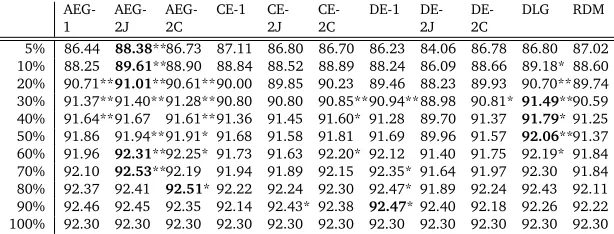
For POS tagging, we used the Stanford POS Tagger (Toutanova et al., 2003). The training and test data are the same as in word segmentation. The results are in Table 5. They show similar patterns as the ones for word segmentation: while measures such as DE-2J are not better than random selection, other measures such as DLG and AEG-2J often provide a small, but statistically significant gain.
5 Discussion
In the previous section, we use four entropy-based measures to select training data and show their performance on two tasks: Chinese word segmentation and POS tagging. Some
[image:7.420.62.374.70.188.2]
AEG-1 AEG-2J AEG-2C CE-1 CE-2J CE-2C DE-1 DE-2J 2CDE- DLG RDM 5% 88.41* 89.28**87.28 87.12 86.11 88.43* 88.41* 84.74 86.28 88.98**85.56 10% 90.03 90.82**89.42 89.89* 88.35 90.66**90.13 87.64 89.52 91.29**89.12 20% 91.60 92.08* 91.95**91.00 90.97 91.87**91.49 89.74 90.91 92.49**91.19 30% 92.29 92.55* 92.52**92.11* 91.74 92.65**92.23 90.86 92.06 92.79**91.71 40% 92.35 92.53 92.88**92.40 92.37 93.01* 93.08**91.17 92.54 92.80* 92.21 50% 92.76 93.22 93.10 93.09 92.71 93.16 92.23 91.58 93.15 93.31 93.01 60% 92.84 93.42 93.36 93.34 93.01 93.31* 93.43 91.92 93.61*93.47**93.12 70% 93.45* 93.43**93.32 93.43 93.33 93.30 93.56**92.12 93.47 93.56* 93.21 80% 93.50 93.54 93.66 93.51 93.51 93.40 93.58 92.58 93.59 93.66 93.59 90% 93.57 93.44 93.96* 93.84* 93.58 93.73 93.74 93.33 93.68 93.80 93.68 100% 93.83 93.83 93.83 93.83 93.83 93.83 93.83 93.83 93.83 93.83 93.83
Table 4: Word segmentation results (in f-score): tested onBCand trained on the other four genres. * and ** indicate significance at 0.05 and 0.01, respectively. The highest score in each row is in bold.
AEG-1 AEG-2J AEG-2C CE-1 CE-2J CE-2C DE-1 DE-2J 2CDE- DLG RDM 5% 86.44 88.38**86.73 87.11 86.80 86.70 86.23 84.06 86.78 86.80 87.02 10% 88.25 89.61**88.90 88.84 88.52 88.89 88.24 86.09 88.66 89.18* 88.60 20% 90.71**91.01**90.61**90.00 89.85 90.23 89.46 88.23 89.93 90.70**89.74 30% 91.37**91.40**91.28**90.80 90.80 90.85**90.94**88.98 90.81*91.49**90.59 40% 91.64**91.67 91.61**91.36 91.45 91.60* 91.28 89.70 91.37 91.79* 91.25 50% 91.86 91.94**91.91* 91.68 91.58 91.81 91.69 89.96 91.57 92.06**91.37 60% 91.96 92.31**92.25* 91.73 91.63 92.20* 92.12 91.40 91.75 92.19* 91.84 70% 92.10 92.53**92.19 91.94 91.89 92.15 92.35* 91.64 91.97 92.30 91.84 80% 92.37 92.41 92.51* 92.22 92.24 92.30 92.47* 91.89 92.24 92.43 92.11 90% 92.46 92.45 92.35 92.14 92.43* 92.38 92.47* 92.40 92.18 92.26 92.22 100% 92.30 92.30 92.30 92.30 92.30 92.30 92.30 92.30 92.30 92.30 92.30
Table 5: POS tagging results (in tagging accuracy): tested onBCand trained on the other four genres. * and ** indicate significance at 0.05 and 0.01, respectively. The highest score in each row is in bold.
measures (e.g., AEG and DLG) provide a small, but statistically significant, improvement over random selection, while others do not. The question is why are some methods better than random selection and others are not.
While it requires more study to provide an adequate answer to the question, a few points are worth noting. First, there are several variants for each of the first three measures (i.e., CE, DE, and EG): the measures can be normalized by sentence length or not normalized; the information unit can a unigram, a bigram, or a higher ngram; probability distribution can be a joint probability or a conditional probability. All these could affect the system performance. Due to the space limit, Tables 4 and 5 list the results of only some of the variants. Second, while all the four measures use the test data to select training sentences, CE and DE also use the entire training data to calculate the scores (see Eq 3 and 4 where
[image:7.420.64.371.225.342.2]CE and DE would not be very effective in training data selection, even when individual training sentences are very different with respect to their similarity to the test data. Third, as mentioned above, the t-test results are based on the scores from ten chunks of the test data; therefore, the variance of the scores for the ten chunks would affect the significant test results. That means, when we compare two measures, we should consider not only the overall evaluation scores on a test set, but also whether the system performance is stable across different subsets of the test data.
Finally, it is quite possible that the effectiveness of a domain adaptation technology in general (and a training data selection measure in particular) would vary depending on NLP tasks, languages, and training/test data sets, because those factors lead to different causes of low system performance when the training and test data come from different domains. For example, in Chinese word segmentation, the out-of-vocabulary word (OOV) problem is usually the main cause of low performance when training and test data come from different domains; whereas in machine translation different word senses could be one factor. All these imply that it is unlikely that one measure is always better than another, for all the tasks, all the languages, and all the data sets.
6 Conclusion and future work
Training data selection is a common approach to domain adaptation. The challenge is to find a good measure for calculating the similarity between training sentences and the test data to improve selection. In this paper, we propose four entropy-based measures for train-ing data selection and test their effectiveness on two tasks: Chinese word segmentation and POS tagging. The experiments show that some measures such as AEG-2J and DLG often provide statistically significant improvement over random selection for both tasks, especially when a small percentage of training data is used.
As illustrated in our experiments, not all the measures we used outperform random selec-tion with statistical significance. This is not surprising given that we know the effectiveness of a domain adaptation method can be influenced by many factors such as the NLP task itself, language, and the differences between the training and the test data. For our future work, we want to study the link between these factors and the behavior of our entropy-based measures and determine whether it is possible to predict what measures work well in particular settings.
Acknowledgments
References
Axelrod, A., He, X., and Gao, J. (2011). Domain adaptation via pseudo in-domain data selection. InProceedings of the Conference on Empirical Methods in Natural Language Pro-cessing, pages 355–362.
Daume III, H. (2007). Frustratingly easy domain adaptation. InProceedings of the 45th Annual Meeting of the Association of Computational Linguistics, pages 256–263.
Kit, C. (2005). Unsupervised lexical learning as inductive inference via compression. In Minett, J. W. and Wang, W. S., editors,Language Acquisition, Change and Emergence, pages 251–296. City University of Hong Kong Press.
Kit, C. and Wilks, Y. (1998). The virtual corpus approach to deriving n-gram statistics from large scale corpora. In Chang-Ning Huang, editor,Proceedings of 1998 International Conference on Chinese Information Processing Conference, pages 223–229, Beijing, China.
Kit, C. and Wilks, Y. (1999). Unsupervised Learning of Word Boundary with Description Length Gain. InCoNLL-99, pages 1–6.
Kit, C. and Zhao, H. (2007). Improving Chinese Word Segmentation with Description Length Gain. InThe 2007 International Conference on Artificial Intelligence (ICAI-2007), Monte Carlo Resort, Las Vegas, Nevada, USA.
Marcus, M., Marcinkiewicz, M. A., and Santorini, B. (1993). Building a large annotated corpus of English: the Penn Treebank.Computational Linguistics, 19(2):313–330.
McClosky, D., Charniak, E., and Johnson, M. (2006). Reranking and self-training for parser adaptation. InProceedings of the 21st International Conference on Computational Linguistics and the 44th annual meeting of the Association for Computational Linguistics, pages 337–344.
McClosky, D., Charniak, E., and Johnson, M. (2010). Automatic Domain Adaptation for Parsing. InProceedings of HLT-NAACL, pages 28–36.
Moore, R. and Lewis, W. (2010). Intelligent selection of language model training data. In
Proceedings of the ACL 2010 Conference Short Papers, pages 220–224.
Plank, B. and van Noord, G. (2011). Effective measures of domain similarity for parsing. InProceedings of the 49th Annual Meeting of the Association for Computational Linguistics: Human Language Technologies-Volume 1, pages 1566–1576.
Song, Y. and Xia, F. (2012). Using a Goodness Measurement for Domain Adaptation: A Case Study on Chinese Word Segmentation. InProceedings of the Eight International Conference on Language Resources and Evaluation (LREC’12).
Xia, F., Palmer, M., Xue, N., Okurowski, M. E., Kovarik, J., Chiou, F., Huang, S., Kroch, T., and Marcus, M. (2000). Developing Guidelines and Ensuring Consistency for Chinese Text Annotation. InIn Proceedings of the Second Language Resources and Evaluation Conference.