MACROMOLECULES
Thesis by Youyong Li
In Partial Fulfillment of the Requirements for the degree of
Doctor of Philosophy
CALIFORNIA INSTITUTE OF TECHNOLOGY
Pasadena, California 2004
© 2004
Youyong Li
ACKNOWLEDGEMENTS
Studying at Caltech is very happy and fruitful. The beautiful campus and the excellent weather make everyone enjoy the life here. But the most important thing to me is that I have benefited a lot from the people around here, especially from my advisor, Bill Goddard.
I would like to acknowledge the constant support and encouragement from Bill. I still clearly remember those mornings that Bill spent with me as early as 5 AM. His intellectual integrity, creativity, enthusiasm and dedication to science not only impressed me, but also will guide me for my whole life and career.
I also would like to thank my thesis committee: Aron Kuppermann, Zhen-Gang Wang, and Bob Grubbs. I benefited not only from their excellent course lectures, but also from the fruitful discussion of my proposals.
I owe a great deal to everyone in MSC (Bill’s group), past and present, for his or her friendship in the last four years. My thanks go to Mario Blanco’s instructions of CED calculations, discussion of dendrimer studies with Tahir Cagin, Siddharth Dasgupta’s advice in initiating nylon study, Peter Meulbroek’s help for my walk from C++ to python, Nagarajan Vaidehi’s help to my touch of Bio-field, Shiang-Tai Lin’s help on VAC calculations. I really enjoy the discussion and even casual chat with Peng Xu, Qingsong Zhang, Weiqiao Deng, Seung Soon Jang, Yun Hee Jang, Valeria Molinero, Prabal Maiti, Lvzheng Zhang, Qing Zhang, Huangzhang Shen, Fangqiang Zhu, Victor Kam, Joyce Peng, Darryl Willick, Shirley Wu, and all the other MSC members.
ABSTRACT
This thesis focuses on the atomistic simulation of polymers/dendrimers material properties and development/applications of Monte Carlo methods for macromolecules. The main topics and their outlines are listed as following.
1) Structures and properties of crystalline polymers from theory. Although crystalline polymers such as nylon are important industrial materials, it is difficult to get the details of the various structures/properties and the conversion between them from the experiment. Using molecular modeling, we successfully predicted the complicated structures/properties and illustrated the process of forming the polymer crystal and conversion mechanism among those structures. (Chapters 1 and 2) 2) Packing mechanism of self-assembly dendrimer balls with soft coronas. Using the
vibrational density of state (DoS) derived from molecular dynamic simulations, we investigate the free energy of the liquid crystal formed by soft dendrimer balls. We find that the preferred lattice for soft balls is different from the hard balls and illustrate the mechanism. (Chapter 3)
3) Development of CCBTX Monte Carlo method for polymer and dendrimer. Although computer simulation has developed as a powerful research tool to study polymer/dendrimer materials properties recently, it has been hampered by the difficulties of sampling amorphous polymer/dendrimer configurations efficiently. We develop the efficient Continuous Configurational Biased TX (CCBTX) method to generate high-quality amorphous polymer and dendrimer atomistic structures directly. The code is implemented in C++ and ported in python environment, which provides friendly interface. (Chapter 4)
TABLE OF CONTENTS
Acknowledgements ...iii
Abstract ...iv
Table of Contents... v
Chapter 1: Nylon 6 crystal structures, folds, and lamellae from theory...1
Chapter 2: Crystal structure and properties of N6/AMCC copolymer from theory and fiber XRD...48
Chapter 3: Efficiency of various lattices from hard ball to soft ball: Theoretical study of thermodynamic properties of dendrimer liquid crystal from atomistic simulation 76 Chapter 4: The continuous configurational biased TX method for generation amorphous polymer and dendrimer atomistic structures...115
C h a p t e r 1
NYLON 6 CRYSTAL STRUCTURES, FOLDS, AND LAMELLAE
FROM THEORY
*AB STR ACT
Although polyamide “nylon 6” polymer is an important industrial material, there remain many questions about the details of the various structures and the conversion between them. Using the MSXX force field (developed previously from ab initio quantum calculations), we predict the crystal structures, folds and lamellae of nylon 6, leading to the following results:
(a) Assuming infinite chains and evaluating the free energy of all 112 regular crystal structures, we find three classes of crystal structures: α form, γ form, and δ form. We find that at 300 K the α form is most stable with γ and δ higher by 0.4 and 0.3 kcal/mol/(amide unit), respectively. We calculate the Young’s modulus in the chain direction to be 295 GPa for α, 135 GPa for γ, and 253 GPa for δ. These values are above the experimental value of 168 GPa for α form because the experimental system has a finite lamella thickness, disorder in the chain conformation, and imperfections in the crystallinity.
(b) We find the thermostability of α form over other forms arises from Intra H-bonds in the α form, which are dynamically and entropically favored.
(c) We propose five detailed steps in the transition between the α and γ forms. We also identify the structures of the other two experimentally observed metastable forms, β and δ. Our structures explain the available fiber X-ray results.
(d) The H-bond schemes for all regular crystal structures are examined. We find that the γ form has a more linear (stronger) H-bond than α form, which is consistent with the interpretation from solid state NMR.
(e) Considering that nylon forms lamellae with finite thickness in the chain direction we considered all 5 possible loop structures and the two best (of 8) possible stacking schemes for the folded sheets together with the 14 possible sheet displacements. We find that the optimum lamella for α form has the alkane loop fold (one amide per loop) and packs so that adjacent sheets are displaced by ± 3.7 Å (3b/14), which is in good agreement with the conclusion from fiber X-ray. Our amide pocket model explains the observed sheet displacements in nylon 6, nylon 66, and also the progressive shear in nylon 66 and nylon 46.
1. Introduction
The polyamide “nylon 6” polymer is an important polymeric material with applications ranging from carpet and automotive parts to intimate apparel.1 In addition, nylon 6 stores the a larger amount of iodine2 than any other polymer and it is claimed to be a good solid-state electrolyte.2 Nylon 6 has the -[-NH(CH2)5(CO)-]- repeating group, leading to a structure in which the peptide units (NH-CO) provide hydrogen bonding between polymer chains. Although nylon is highly crystalline, the presence of the crystalline lamella in an amorphous matrix makes it difficult to obtain precise crystallography. Despite the numerous important industrial applications and numerous experimental studies on nylon 6, there remain many questions about the details of the various structures and the conversion between them. As with other highly crystalline polymers (such as polyethylene and PET), the chains in the crystalline regions of nylon 6 tend to be re-entrant to preserve chain-chain bonding and the nature of these folds complicates the optimum spacing and structure of the lamella and the connections between them.
calculations (quantum mechanics, molecular dynamics, and molecular mechanics) to determine the optimum packing and fold structures of nylon 6. Section 2 describes the details of these methods. Section 3 reports the results for infinite chain model structures of nylon 6 and compares to the experimental data. Section 4 discusses the results for fold structures of nylon 6. The summary is in section 5.
2. Calculation details
We used the MSXX FF3 with the MSC version of PolyGraf (version 3.30, Caltech version) for all calculations. Some quantum mechanics (QM) simulations were performed to validate the results with the MSXX FF. Cerius2 (v4.0) was also used for graphics and manipulations. The electrostatic and van der Waals (vdW) interactions used the accuracy bounded convergence acceleration (ABCA) Ewald technique4 for computing the nonbond energies of periodic systems. We used an accuracy of 0.001 kcal/mol. All structures were minimized to an rms force on all atoms of 0.01 kcal/(mol Å) for atom and rms stresses of 0.1 kcal/(mol Å) using conjugate gradient method.
2.1. Force field
The MSXX force field for simulation of nylon polymers was derived from ab initio QM calculations.3 Special emphasis was given to the accuracy of the hydrogen bond potential for the amide unit and the torsional potential between the peptide and alkane fragments.
This hydrogen bond potential was derived from MP2/6-31G** calculations of the formamide dimer. Subtracting electrostatic interactions (based on fixed-point charges extracted from QC on the monomers) leads to a repulsive exponential form (Eq. 1) of the short-range hydrogen bond potential3 with A=0.028 kcal/mol, C=0.251 Å, and R
e=3.017 Å.
from Ref. 5 (see section 2.2). The differences are mainly from the methylene groups, which do not affect the parameters used for hydrogen bond potential.
⎥⎦ ⎤ ⎢⎣
⎡− − =
C R R A
EEXP e
vdW
) (
exp (1)
The full torsion potential between peptide and alkane fragment was calculated by optimizing the geometry (using HF/6-31G**) at each point on the torsional curve and the torsional potential is represented by a Fourier series (Eq. 2) in MSXX force field.3
∑
==
= 6
0 cos 2
1n n
n
torsion V n
E τ (2)
where τ is the torsional angle (τ=0 for cis), and Vn is the barrier (energy of cis over trans).
Detailed MSXX force field was described in previous paper.3
2.2. Charges
N C
C C
C C
C O
H H H
H H
H H
H H
H H
-0.65
0.28 -0.68
0.87
-0.16
0.04 0.04 0.06 -0.03 -0.03
0.06
-0.03 -0.03 0.06 -0.03 -0.03
0.26
0.0 0.0
Figure 1. Charge scheme for a monomer fragment in polymer chain of nylon 6
2.3. Vibrational calculations
The analytic second derivative matrix (Hessian) obtained directly from the complete energy expression was used to calculate the vibrational modes and frequencies. This Hessian was also used with additional terms to calculate the elastic constants (including Young’s Modulus). To obtain the zero point energy and temperature dependent entropy (S), enthalpy (H), and free energy (F) as a function of temperature, we calculated the vibrational modes for a 3x3x3 mesh of reciprocal lattice vectors, based on the unit cell with four chains each with two formula units. We also used a 5x5x5 mesh for the model structure proposed by Holmes6 and found a total free energy change of only 0.03 kcal/mol/(amide unit). The methodologies are reported in Ref. 7, 8 and implemented in the VIBRATE, THERMO, and ELASTICA Modules in PolyGraf.
2.4. R-factor calculation
We used the “Diffraction-Crystal” module in Cerius2 4.0 to calculate the fiber x-ray diffraction intensities and to obtain the R-factor against the experimental data. The intensity for each hkl reflection was calculated using
{
} {
2}
2) (
2 sin )
( 2 cos )
(hkl =
∑
fn hxn+kyn+lzn +∑
fn hxn+kyn+lznwhere fn is the scattering factor of atom n and xn, yn, zn are the fractional coordinates of atom n. The summation is over all atoms in the unit cell.
We used the global anisotropic temperature factor to correct the intensities. In this method, the intensity of an hkl reflection is reduced by a factor of the form:
(
)
[
h Ba k Bb l Bc]
2 2 2
2
exp− + + (4)
where: 2
2 2 2
a a
Ba = π , 2
2 2 2
b b
Bb = π and 2
2 2 2
c c
Bc = π are dimensionless.
2 a , b2 and c2 are mean squared atomic displacements (Å2) in a crystal with unit cell dimensions a, b, c (Å). We determined the a2 , b2 and c2 from NVT molecular dynamics simulations.
No polarization factor or crystal monochromator factors were applied to the intensity calculation.
The R-factor is defined as following:
∑
∑
−=
. . .
obs calcd obs
I I I
R (5)
3. Infinite chain model structures of nylon 6: results and discussion
3.1. α form, γ form, and intermediate forms from fiber X-ray experimental results
are formed between antiparallel full-extended chains in the α form and between parallel pleated chains in the γ form. The α phase is the thermodynamically most stable crystalline form, and can be obtained by slow cooling from the melt. The γ form is obtained by spinning fibers at a high speed or by iodinating nylon 6 in aqueous KI/I2 treatment followed by removal of the iodine and potassium with sodium thiosulphate. The γ form can be converted into α by melting followed by recrystallization10, by annealing at 160oC in a saturated-steam atmosphere without any significant loss of orientation,11 and by applying stress at room temperatures12-14 .
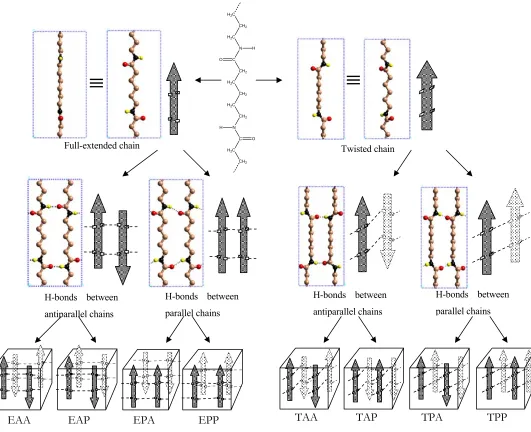
Figure 2. Eight possible classes of crystal structures constructed with different packing schemes
Full-extended chain
≡
Twisted chain
≡
H-bonds between antiparallel chains
H-bonds between parallel chains
H-bonds between antiparallel chains
H-bonds between parallel chains
EAA EAP EPA EPP TAA TAP TPA TPP
H2C
CH2
H2C
N
C
CH2
H2C
CH2
H2C
CH2
N
C
H2C
CH2 H
O O
3.2 All possible regular infinite chain crystal structures of nylon 6
There are two distinct different chain conformations of nylon 6: full-extended chain and twisted chain as shown in Figure 2. H-bonds can be formed between antiparallel chains or parallel chains. The corresponding chains in adjacent sheets can be antiparallel or parallel. Thus there are four possible packing schemes of the chains.
From the two types of chain conformations and the four packing schemes, eight possible classes of regular infinite chain crystal structures are constructed as shown in Figure 2.
We will classify the structures using a 3-letter index:
The first letter describes whether the chains are full-extended (E) or twisted (T).
The second letter describes the relative direction of the chains forming H-bonds parallel (P) or antiparallel (A).
The third letter describes the relative direction of corresponding chains in adjacent sheets parallel (P) or antiparallel (A).
b/7
a. “uncrossed” chains
b/7
b. shift “uncrossed” chains
b/7
c. “crossed” chains
Figure 3. Three stacking schemes of polymer chains in adjacent sheets (b is the cell length of the unit cell in chain direction)
There are three distinct ways to stack adjacent H-bond sheets in nylon 6 crystal, as illustrated in Figure 3. The two chains shown in 3a, 3b or 3c represent the corresponding chains in adjacent H-bond sheets. In Figure 3b, the two chains are shifted in both b and a direction (chain direction and H-bond direction, respectively). The shift “uncrossed”-chains and “crossed”-“uncrossed”-chains stacking schemes as shown in Fig. 3b and 3c are better than “uncrossed”-chains stacking scheme as shown in Fig. 3a. For EPP, EPA, EAP and EAA, the unshifted “uncrossed”-chain structure in Fig. 3a is 0.7~0.8 kcal/mol/(amide unit) higher than the other two.
In addition, the single H-bond sheet in EPP, EPA, EAP and EAA can slide in the chain direction by an integer number of b/7 with respect to the adjacent sheets, as shown in Figure 3.
Multiplying the 8 classes with the 14 stacking schemes (14 sheet displacements) leads to a total of 112 regular infinite chain crystal structures
3.3. Free energy and Young’s modulus of all possible regular crystal structures of nylon 6
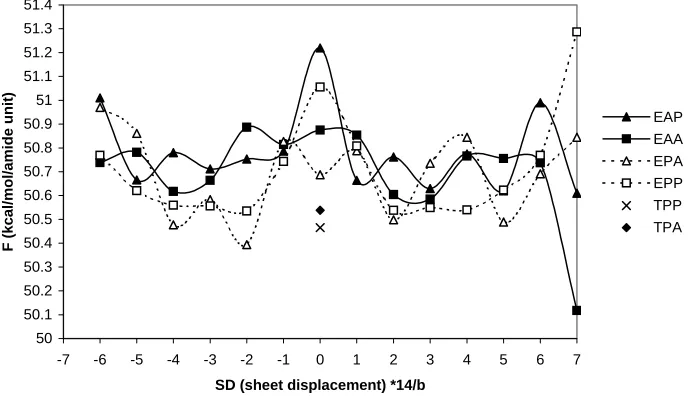
We specified the space group of the simulated unit cell as28 P21 and calculated the potential energy, ZPE (Zero Point Energy), entropy, enthalpy, and free energy of all 112 regular crystal structures after energy minimization in PolyGraf 3.21. The unit cell and the atomic coordinates were optimized simultaneously. To compare the various model structures we consider the free energy at 300K. The results are listed in Table 1 and illustrated in Figure 4. The parameters of the unit cell are listed in Table 2. When the SD (sheet displacement) in Table 1 is an odd integer, the crystal stacks with “crossed”-chains as in Figure 3c. When SD is even, the crystal stacks with shift “uncrossed”-chains as in Figure 3b.
50 50.1 50.2 50.3 50.4 50.5 50.6 50.7 50.8 50.9 51 51.1 51.2 51.3 51.4
-7 -6 -5 -4 -3 -2 -1 0 1 2 3 4 5 6 7
SD (sheet displacement) *14/b
F (kcal/mol/amide unit)
[image:16.595.146.490.448.648.2]EAP EAA EPA EPP TPP TPA
3.3.1 EAP and EAA (α form)
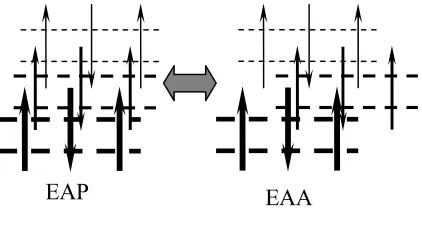
[image:17.595.210.421.326.439.2]First we consider the EAA and EAP classes, each of which has 14 models. All of these are denoted as α form. As shown in Figure 5, EAP and EAA can transform to each other without difficulty. This transformation does not change the chain conformation and does not modify any hydrogen bonds. Thus only vdW interactions are involved in the barrier, which is estimated to be 0.8 kcal/mol/(amide unit). Within the EAA and EAP classes, there are 14 possible model structures differing from each other by the sheet displacement, as shown in Fig. 3. The 14 possible model structures can also transform to each other easily by overcoming the vdW energy barrier of about 0.7 kcal/mol/(amide unit).
Figure 5. The transition between EAP and EAA
For EAP the lowest free energy model is EAP+7 but there are 2 other models (+3, +5) with energies within 0.01 kcal/mol/(amide unit).
For EAA the lowest energy model is EAA+7 and it is 0.5 kcal/mol/(amide unit) lower than EAP+7. As shown in Fig. 4, EAA+7 is the best model structure and is roughly 0.4 kcal/mol/(amide unit) better than other models. In EAA+7, the coulomb interaction between the amide units of the adjacent H-bond sheets is significantly favored over that of the other models.
The model structure concluded by Holmes6 from fiber X-ray (corrected by Simon29) to account for the α form is EAP±3, which is not consistent with the results here. However,
after considering the fold structures in section 4.4, we find the same optimum crystal structure as Holmes6.
Leon et al.30 reported results of rigid body sliding for infinite chains using the PCSP method to estimate interchain separations (PCSP does not minimize the energy of the conformation or cell for each displacement in our understanding). They calculate that the sheet displacement with the most favorable potential energy is 4b/14. From relaxing the chains and unit cells we find that the most favorable is 7b/14. This indicates that it is important to relax the structures.
3.3.2 TPA (γ form) and TPP
The pleating in the hydrogen-bonded sheets in TPP and TPA prevents them from sliding by b/7 with respect to the adjacent sheets. The only reasonable model structures are TPA+0 and TPP+0. For other sheet displacements, the TPP and TPA structures relax to EPP or EPA after energy minimization.
The TPA+0 model structure corresponds to the γ form, which is exactly the same as the model structure proposed by Arimoto9. The free energy is 0.4 kcal/mol/(amide unit) higher than EAA+7.
The free energy of TPP+0 at 300K is very close to TPA+0 (the difference is only 0.07 kcal/mol/(amide unit). But it is not possible to form a folded structure for TPP, since all chains are parallel to each other. Thus TPP is not a reasonable regular crystal structure in the real fiber.
3.3.3 EPA (δ form) and EPP
EPA has the same b length (Table 2) as α form leading then to the same meridional scan,
EPA has very similar a, c, β angle parameters to the γ form (Table 2) leading thus to the same equatorial scan.
This agrees exactly with the experimental observations for the δ form. As discussed in section 3.4 below, EPA (δ form) accounts for an intermediate phase between α form and γ form (more precisely, between β form and γ form). The best model structure of EPA is EPA-2, which is 0.3 kcal/mol/ (amide unit) worse than EAA+7.
The best model structure of EPP is EPP-2 and the free energy of EPP±2, ±3, ±4 are almost undistinguishable. As with TPP, EPP has parallel chains so that it is not possible to form a folded crystal structure for the real fiber.
3.3.4 TAP and TAA
We find that TAP and TAA lead to high energies. Indeed the TAP and TAA unit cells relax to EAP and EAA with energy minimization. Keeping them rigid so that they cannot convert leads to energies 4 to 20 kcal/mol/(amide unit) higher than the other crystal forms. Such high energies make these structures extremely unlikely.
3.3.5 The Young’s modulus
We predict a Young’s modulus in the chain direction of 295 GPa for α, 135 GPa for γ, and 253 GPa for δ. The value for α is above the experimental value31 of 168 GPa, because the experimental system has finite thickness lamellae, disorder in the chain conformation, and imperfections.
3.4 Intramolecular and intermolecular hydrogen bonds and the thermostability of α
Since the molecular weight of Nylon polymer is large, we consider that each lamella involves the same polymer chain folded repeatedly (of course there may be more than one polymer chain in a lamella and the polymer chain in one lamella may exit the lamella and connect through an amorphous region to an adjacent lamella or back to the same one). Each such covalently connected polymer chain we will consider as one molecule. For an isolated molecule, we would expect the chain to fold repeatedly to allow intramolecular hydrogen bonds, denoted hereafter as: Intra H-bonds. Folding an isolated polymer chain to form Intra H-bonds necessarily leads the adjacent chain to be in opposite directions. Thus Intra H-bonds are always between antiparallel chains.
It is also possible to have crystals in which the hydrogen bonds are between different molecules or between remote parts of the same molecule. We will denote this case of intermolecular hydrogen bonds as Inter H-bonds.
The lowest enthalpy for a folded molecule with Intra H-bonds would lead to a 2D sheet with a constant length between folds. Two such sheets could be packed to form a 3D structure where the intermolecular interactions would be dominated by van der Waals (non coulomb) interactions since that H-bonds are all within sheets. As discussed in section 4 (below), this packing leads to the α structure of Nylon, which is the most stable crystal structure for nylon 6.
An alternative packing is to start with the above structure having parallel sheets of intramolecular bonds and rotate the amide groups to make hydrogen bonds to the molecule in the adjacent sheet, leading to Inter H-bonds. As discussed in section 4 (below), this packing leads to the γ structure of Nylon-6, which can be formed experimentally from the α structure by iodination. Also we will find that δ form has only Inter H-bonds.
molecules containing Intra H-bonds. The energetics of individual molecule for nylon 6 are discussed in section 4.3. The recent simulations by Welch P. and Muthukumar32 support this role of Intra H-bonds. They conclude that, “Lamella thickening is a highly cooperative process requiring the mobility of all chains in the crystals.”32 Obviously, intra H-bonds favor molecular mobility and formation of the H-bond sheet inside molecule is enthalpically favored. These considerations lead to the conclusion that Intra H-bonds are favored over Inter H-bonds, both energetically and kinetically. These Intra H-bonds account for the thermostability of the α form over all other forms.
3.5 Transition mechanism and intermediate β form, δ form between α form and γ
form
3.5.1 Fiber X-ray results for intermediate forms in the literature
After the elucidation of the structures for the α form and γ form of nylon 6,6,9,33 many studies have examined the crystalline phase intermediate between α and γ.12,13,16-24 The intermediate phase is normally observed in fibers under stress, but has been observed in relaxed fibers, and it can be transformed into either the conventional α form or γ form using suitable thermo-mechanical treatments. For example, stretching the fibers up to their breaking points12,13 or boiling in water at temperatures between 100oC and 160oC12,13,34 transforms the intermediate phase to α form.
Holmes6 discussed an unstable structure he denoted as the β form. The very obvious difference between β form and α form is that the meridional spot 020 of fiber x-ray (barely visible in the α form) is the strongest spot in the fiber diffraction for the β structure.
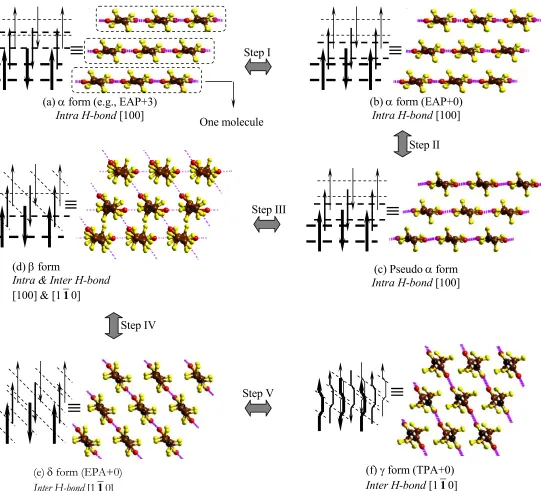
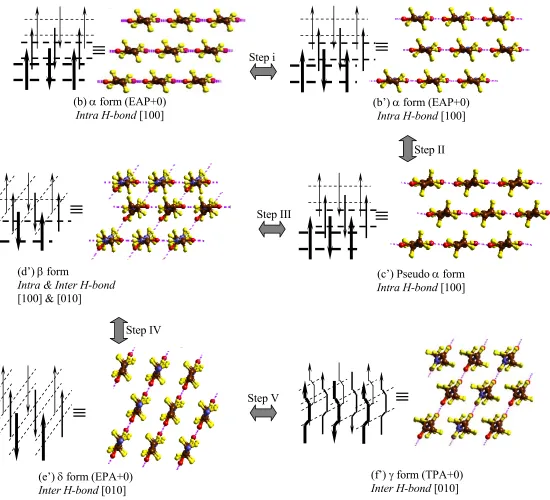
Figure 6. The transition mechanism and metastable forms between α and γ forms
≡
(c) Pseudo α form Intra H-bond [100]
≡
(e) δ form (EPA+0) Inter H-bond [110]
≡
(f) γ form (TPA+0) Inter H-bond [110] Step IV
Step III
Step V Step I
≡
(a) α form (e.g., EAP+3)
Intra H-bond [100] One molecule
Step II
≡
(b) α form (EAP+0) Intra H-bond [100]
(d) β form
Intra & Inter H-bond [100] & [110]
Figure 6’. An alternative of transition mechanism in Fig. 6 Step IV
Step III
Step V Step i
Step II
≡
(b) α form (EAP+0) Intra H-bond [100]
(d’) β form
Intra & Inter H-bond [100] & [010]
≡
≡
(c’) Pseudo α form Intra H-bond [100]
≡
(e’) δ form (EPA+0) Inter H-bond [010]
≡
(f’) γ form (TPA+0) Inter H-bond [010]
≡
3.5.2 Transformation steps between α form and γ form
The transformation between α form and γ form cannot be a direct single-step process because it requires breaking a number of H-bonds, making a number of new H-bonds, and changing chain conformation.
Based on the results in section 3.3 and the fiber X-ray results in section 3.5.1, we propose five detailed transformation steps between α form and γ form as illustrated in Figure 6. Fig. 6, represents the different forms by showing nine chains of nylon 6, consisting of three molecules. The folds connecting chains with each other, are circled in Fig. 6a to help understand the composition of the chains in terms of molecules.
Step I from Fig. 6a to Fig. 6b: The H-bond sheet in the α form slides (by 3b/14) in the chain direction with respect to adjacent H-bond sheet. In Fig. 6a, the amide units in the adjacent H-bond sheets (adjacent molecules) are not on the same height. By overcoming the 0.7 kcal/mol (amide unit) vdW energy barrier (see section 3.3.1), the adjacent H-bond sheet can slide to keep the amide units on the same height as shown in Fig. 6b.
Step II from Fig. 6b to Fig. 6c: All of the amide units are twisted ~10° with respect to the two connected pentamethylene segments while preserving the H-bonds. This structure is similar to α, but has a slightly different chain conformation.
Step III from Fig. 6c to Fig. 6d: Starting from Fig. 6c, we break half of the Intra H-bonds in [100] direction and form new Inter H-bonds in [110] direction while retaining the other half of the Intra H-bonds in [100] direction. This structure is similar to the β form proposed by Auriemma24 and to the interphase form proposed by Murthy23.
Step IV from Fig. 6d to Fig. 6e: The remaining Intra H-bonds are broken while forming Inter H-bonds.
An alternative pathway, which is shown in Fig. 6’, from α to γ is in Step i to slide the middle H-bond sheet with respect to the upper and lower ones by a/4 in the hydrogen bond direction to form Fig. 6’b’ (Fig. 6’b is the same structure as Fig. 6b). Then in step III the half of the amides that twist do so in the opposite direction ([010] for original α form) to form Fig. 6’d’. In this case the step IV leads to a δ form with the hydrogen bonds in this same [010] direction. Then step V leads to γ, but with the hydrogen bonds in the [010] direction.
3.5.3 β form
We find that the structure in Fig. 6d fits the fiber X-ray results from Holmes6, Ziabicki15,16 and Auriemma24. Following their notation6,15,16,24, we name the structure in Fig. 6d(6’d’) as the β form. Because the amide units are on the same height in the structure of Fig. 6d(6’d’), they give a periodicity of 0.835 nm (the 010 spot), which is consistent with the fiber X-ray result from Auriemma24. We consider this same structure to be responsible for the strong 020 diffraction observed by Holmes6, who reported a periodicity of 0.862 nm.
The structures of Fig. 6d and 6’d’ have H-bonds formed in three distinct directions leading to disorder in the chain conformation. These hydrogen bonds would be in the [100], [110] and [010] directions as discussed above, which is consistent with the conclusion of Auriemma24 from fiber X-ray results.
3.5.4 δ form
The structure in Fig. 6e(6’e’) corresponds to the regular crystal structure EPA+0 discussed in section 3.3.3. We denote this as the δ form because it fits the fiber X-ray results of the intermediate phase observed by Murthy.23 (see section 3.3.3)
a different chain conformation. Both α form and δ form are composed of extended chains, leading to a Young’s modulus much larger than the γ form, which is composed of pleated chains. Thus Table 1 shows that the Young’s modulus for the γ form’s (TPA) is lower than EPA (the δ form) and lower than EAA, EAP (α form). It is reasonable that stretching the γ form would lead to the full-extended chains of the δ form (EPA), as found by Murthy.23
Figure 7. Three H-bond schemes for H-bond sheets. (Illustrated is the three strand case with six formula units in each strand.)
3.6 The H-bond schemes in α form (EAP, EAA), δ form (EPA), and EPP
It is well accepted6 that for nylon 6, all H-bonds are made perfectly between antiparallel fully extended chains as shown in Figure 7a. For parallel full-extended chains (Figure 7c), the H-bonds cannot be made perfectly due to the bad H-bond angle.6 Thus the H-bond scheme III in Fig. 7c is worse than the H bond scheme I in Fig. 7a. However, we find that the H-bond scheme I is worse than II and III by 0.6 kcal/mol/(amide unit) (see Table 3).
N O O H N N O N O N H O O N H H H H 5 5 5 N O O H N N O O N H H 5 5 N H O O N H 5 H
a. H-bond scheme I Antiparallel sheet
b. H-bond scheme II
Antiparallel sheet c. H-bond scheme IIIParallel sheet
nth strand
There are two reasons:
There is a bad contact between the pentamethylene units. Bad contact exists between 10 hydrogen atoms of every repeating unit as shown in Fig. 7a. From Table 3, we see that the vdW part of H-bond scheme I in Fig. 7a is 1.0 kcal/mol/(amide unit) worse than in scheme II and III, as shown in Fig. 7b and 7c.
Although a linear H bond is best, the energy cost of small displacements from linear is small. Thus Table 3 shows that the electrostatic part for H-bond scheme I is 0.4 kcal/mol/(amide unit) better than for Fig. 7b and Fig. 7c because of better H-bonds.
3.6.1 Validation of the FF results
To corroborate these results from the FF, we used semi-empirical QM calculations (AM1) to compare the binding energy of different H-bond schemes in Fig. 7.
Using AM1 we first optimized a single chain containing 6 amides (as shown in Figure 7) with the backbone atoms fixed on the same plane. Then we performed rigid body minimization of the dimer, trimer, and etc. until the 5th strand. This was done for the three H-bond schemes shown in Figure 7 for a three-strand case. Defining EB(n) as the total
binding energy with n strands, then we consider:
3.6 4.6 5.6 6.6 7.6 8.6 9.6
1 2 3 4 5 6
the nth strand
Binding energy increment
(kcal/mol/amide unit)
Hbond I-AM1 Hbond II-AM1 Hbond III-AM1 Hbond I-MSXX Hbond II-MSXX Hbond III-MSXX
[image:29.595.120.522.128.364.2]Figure 8. The binding energy increment per amide, εn = En = [EB(n) – EB(n-1)]/6, for adding the nth strand calculated using AM1 and MSXX FF
Figure 8 shows the εn results for each of the three different H-bond schemes. Here we see that εn is about the same for n ≥ 3, but is about 1 kcal/mol weaker for n=2. This suggests a cooperative component to the hydrogen bonding. We see that H bond schemes II and III (with bent hydrogen bonds) are competitive while H-bond scheme I (with linear hydrogen bonds) is 0.5 kcal/mol/residue worse than II and III. This result confirms our MSXX FF result in Table 3.
C
N H
H Ha
Ha N
H
C
H
O O
y
x z
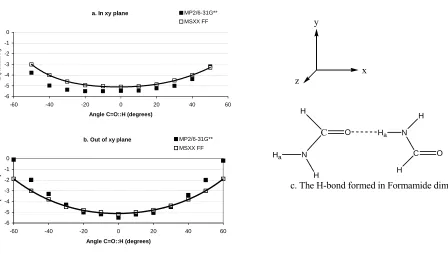
c. The H-bond formed in Formamide dimer
a. In xy plane
-6 -5 -4 -3 -2 -1 0
-60 -40 -20 0 20 40 60
Angle C=O::H (degrees)
E (kcal/mol)
MP2/6-31G** MSXX FF
b. Out of xy plane
-6 -5 -4 -3 -2 -1 0
-60 -40 -20 0 20 40 60
Angle C=O::H (degrees)
E (kcal
/m
ol
)
[image:30.595.82.530.116.370.2]MP2/6-31G** MSXX FF
Figure 9. Dependence of the bond energy Formamide dimer on H-bond angle for translation of one amide unit relative to the other (a) in the y direction (in plane) and (b) in the z direction (out-of-plane) (reproduced from Ref 3)
3.6.2 Dependence of H-bond energy on H-bond angle
In order to understand how the H-bond energy depends on linearity of the bond, we show in Fig. 9 the change in the binding energy of formamide dimer as one formamide is translated in the plane of the dimers (Fig. 9a) or perpendicular to the plane (Fig. 9b). Here we compare the results for the MSXX FF with ab initio QM at the MP2 level. This shows that MSXX FF gives a good description of QM.
interaction energy with the partially positive H favorable for displacements (2 kcal/mol for 50°).
In contrast the electron density at the oxygen drops off quickly in the z direction so that displacement in the out-of-plane z direction results in a much stiffer potential (3 kcal/mol for 50°, see Figure 9b).
C
O
H
H
12H
3Figure 10. A schematic of the hydrogen bond with different COH angles. (The uniform charge density due to the lone pairs of oxygen in the plane leads to similar hydrogen bond energies for H3, H1, and H2, with H1 best.)
The soft in-plane sliding and the packing effects between methylene units make H-bond schemes II and III ~0.5 kcal/mol better than I in Fig. 7. QM calculations (HF-6-31G*) on optimized glycine β-sheet structures also lead to nonlinear H-bonds as in II and III over the linear ones as in I.35
3.7 The H-bond in γ form
It is well accepted that for Nylon 6, the γ form is not stable as α form.9,23,33 On the other hand, Hatfield et al.1 concluded from the results of solid-state 13C and 15N NMR experiments, that the H-bond in the γ phase is stronger than in the α phase. We believe that rather than measuring bond strength, their result is related to the shielding of the amide proton, which is probably related to the linearity of the hydrogen bond.
170.7o in γ form (TPA+0) and
156 to 158o in EAP (α form) and EAA is (H-bond scheme II in Fig. 7b) and
153o in EPA (δ form) and EPP (H-bond scheme III in Fig. 7c).
A linear H-bond angle should lead to the biggest affect on the charge distribution in the amide units, which should directly affect the chemical shifts observed by solid-state NMR.
3.8. Comparison with fiber x-ray results
We used the “Diffraction-Crystal” module in Cerius2 4.0 to calculate the fiber x-ray diffraction and to obtain the R-factor with respect to the experimental data.6,9
We calculated the R-factor of 28 model structures of EAP and EAA with respect to the intensity data of α form from Holmes6 The calculated R-factors range from 0.258 to 0.408. In this calculation the mean squared atomic displacements used for the temperature factor are <a2>=0.39 Å2, <b2>=0.08 Å2, <c2>=0.46 Å2, which we derived from NVT molecular dynamics.
having finite thickness lamella, where we find the interactions between the folds lead directly to the 3b/14 sheet displacement.
We find that for infinite chains all EAP and EAA structures lead to a significant discrepancy in the intensities of the 7th layer line, as originally mentioned by Holmes.6 Displacing the sheet by b/7 as shown in Figure 3 does not affect the intensities of the 7th layer line. However, the “uncrossed” and “crossed” structures shown in Figure 3b and Figure 3c give quite different intensities of the 7th layer line. The “uncrossed” structure gives significant intensities for h7l with even l while the “crossed” structure gives significant intensities for odd l. Unfortunately, Holmes6 listed odd l of h7l only for observed intensities. For this reason the “uncrossed” structure leads to a larger R-factor than the “crossed” structure. We explain the discrepancies for the 7th layer line to the coexistence of “crossed” and “uncrossed” structures.
4. Results and discussion for folded structures (lamella) of nylon 6
4.1 Introduction
It is generally accepted that many linear polymers form crystalline regions or lamella consisting of folded chains. This includes polyethylene, polyoxymethylene, poly(ethylene terephthalate), and nylon. Three models of chain-folded polymer crystals have been proposed36 as shown in Fig. 11:
Fringed Micelle or Bundle-like Model;
Random Re-entry or “Switchboard” Folded Model;
Adjacent Re-entry Chain-Folded Models (Regular Folding, smooth surface).
lamellae with rough surfaces would be expected to have some voids or bubbles between the lamellae, leading to a density somewhat below the x-ray crystal density.
Figure 11. Schematics for suggested fold models of polymer crystals (based on Fig. 2 of Ref. 34)
The measured density of the piece of the monofilament nylon 6 used for the intensity measurements was6 1.160 ± 0.001 g/cm3, which is quite close to the crystal density of 1.233 derived from the x-ray unit cell6 (a=9.56 Å, b=17.24 Å, c=8.01 Å, β=67.5o). For the regular lamellae model we constructed, we find a density at 0K of 1.18 ± 0.02 g/cm3 (the uncertainty depending upon which types of loop). The good agreement with experiment strongly suggests that the experimental system has a regular lamella structure as in Fig. 11c.
Amorphous phase
Crystal
(a). Bundlelike model (b). Switchboard model
l
Figure 12. Five types of loop structures for nylon 6
4.2 Different types of loops for nylon 6
There are five types of loops for the lamella with smooth surface shown in Figure 11c. The loop can be formed
with Intra H-bonds leading to the four cases in Fig 12 abcd or
with Inter H-bonds (inter-sheet, Fig. 12e).
For the first four loops must be compatible with forming the H-bonds (dotted lines in Fig. 12 abcd), leading to a ring constraint. This can be done in two ways:
Two amide units to form the loop (Fig. 12a and 12b), denoted as the Amide loop
One amide unit to form the loop (Fig. 12c and 12d), denoted as the Alkane loop The loop ring of the Amide loop includes
18 atoms (Fig. 12a, type I) or
(a) Amide loop type I (18 atoms in the loop ring)
(b) Amide loop type II (16 atoms in the loop ring)
(c) Alkane loop type I (11 atoms in the loop ring)
(d) Alkane loop type II (9 atoms in the loop ring)
16 atoms (Fig. 12b, type II),
whereas Alkane loop has 11 (Fig. 12c, type I) or
9 (Fig. 12d, type II).
Thus the Amide loop leads to less ring strain than the Alkane loop, but the Alkane loop has one additional amide unit in the stem chain for favorable hydrogen bonding and packing. For both Amide loop and Alkane loop, there are two cases referred to as and type II. Type II has two less atoms in the loop than type I leading to a stiffer more highly strained loop.
In contrast, the inter-sheet loop (between H-bond sheets) leads to very little constraint on the loop ring. In addition, it uses only one amide unit in the loop, just as for the intra-sheet Alkane loop. For comparing the inter-sheet loop case with the various Intra H-bond cases, we selected the lowest energy inter-sheet H-bond case.
In order to determine the energetics for different types of loops, we performed NVE molecular dynamics (MD) of the model structures shown in Figure 12. MD is necessary to allow the loops to achieve their most favorable shape. In these calculations we fixed the stem regions, allowing only the atoms in the loop to move. To be consistent we included the interactions among the 57 atoms shown in Fig. 12 but allowed only the ones in the boxes to move in the dynamics. We then performed a total of 1ns MD using 1 fs time step at 600K. Then we analyzed the 20 potential energy lowest frames and minimized them to get candidate structures for the optimum structure of each type of loop. MD of whole system will give a better analysis in cost of a lot of computer time. By using the strategy described above, in which MD is performed before energy minimization, we get reasonable results in cost of normal computer time.
diffraction is 4.77 ± 0.05 nm. Such systems will fold just once suggesting a lamella thickness for nylon 6 that is 2.8 times the b length of the original unit cell6 (17.24 Å). Trifan et al.38 showed from x-ray experiments that the lamella thickness of nylon 66 is approximately 58 Å (that is 3.3 times the b spacing) and independent of the bath temperature. The optimum lamella thickness involves a balance of thermodynamics and kinetics. Thick lamella leads to increased stability but the kinetics limits the growth rate thick lamella (requiring the long chains to be aligned as the crystal grows). Based on these experimental results we decided to aim at a lamella thickness of ~50 Å.
In order to use just one type of loop for intra-sheet loop cases, it is necessary to have an even number of amides in each stem. To achieve a thickness of ~ 50 Å leads to the choice of four amides per stem for Alkane type and five amides per stem for Amide type.
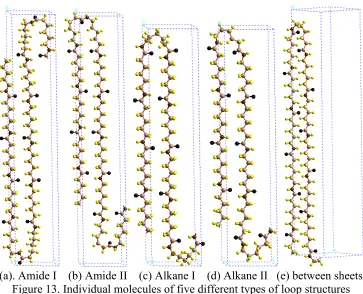
[image:37.595.134.497.365.659.2](a). Amide I (b) Amide II (c) Alkane I (d) Alkane II (e) between sheets
Figure 13. Individual molecules of five different types of loop structures
First we consider the optimum loop type for the individual molecules shown in Fig. 13. In order to eliminate inter-molecule interactions we fixed the distance between layers (molecules) to be 50 Å, and we fix the LSP (b length of the unit cell) to be 100 Å.
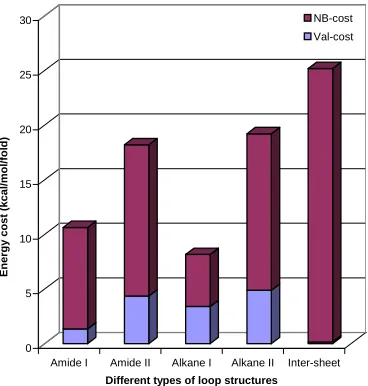
[image:38.595.225.409.309.502.2]The energy cost of forming the various types of loops for individual molecules is shown in Figure 14 and Table 6. The fold energy cost is normalized by the number of folds. The reference energy is a single H-bonded sheet formed between infinite antiparallel chains without a fold (the distance between sheets again fixed at 50 Å). This MSXX FF energy is –35.940 kcal/mol/(amide unit).
0 5 10 15 20 25 30
Energy cost
(
kcal
/m
ol
/f
ol
d)
Amide I Amide II Alkane I Alkane II Inter-sheet
Different types of loop structures
NB-cost Val-cost
Figure 14. Energy cost of different types of loops in individual molecule
The energy cost of the fold part arises from two terms: Nonbond part (packing energy cost) and
Valence part (ring constraint cost).
The cost of losing the H-bond is included in the Nonbond part. Here we see that
next is Amide loop type I (10.6),
then Amide loop type II (18.2), and then Alkane loop type II (19.2).
The difference between Amide loop type I and Alkane loop type I is 2.4 kcal/mol/fold, which is less than one H-bond. For both Amide loop and Alkane loop, Type II is always worse than Type I because of the additional ring constraint in Type II.
For the inter-sheet loop case, the individual molecule energy is much less favorable (by ~ 17 kcal/mol/fold, see Figure 14) than the Alkane loop type I case, because of the lack of H-bonds. We see from Fig. 14 that the energy cost for one molecule of inter-sheet loop almost comes from the Nonbond part (mainly H-bond part). Thus the inter-sheet loop is not favored for individual molecules and is not favored by dynamics.
Jones et al37 discussed the “Amide Fold” and two types of “Alkane Fold” for singly-folded finite chains of nylon 6 using the CVFF force field. They concluded that the “Amide Fold” and one of the two “Alkane Folds” are both good folds for nylon 6. However, they did not provide any details of the fold energy cost.
4.4 The stacking of the fold sheets and the best fold sheet displacement
4.4.1 Two best of eight possible stacking schemes for folded sheets
Before going to 3D lamella crystal structures, we will first consider all possible stacking schemes of the folded sheets.
is less vdW repulsion energy between the adjacent loops. The energy difference between them varies depending on the fold sheet displacements and the way of stacking the folded sheets. In the following calculations we will consider only Loop stacking type I.
(a) Loop stacking type I (b) Loop stacking type II
Figure 15. Two ways of stacking adjacent loops (The fold structure is projected down the chain axis. The wave line and the small circle represent the loop and the straight stem segment, respectively.)
Figure 16. Two ways of stacking adjacent fold sheets
Figure 17. Two ways of stacking the adjacent lamellae
(a) Eclipse fold-sheet stacking (b) Staggered fold-sheet stacking
Besides the two ways of stacking of adjacent loops shown in Figure 15, there are two ways of stacking folded sheets in the H-bond direction as shown in Figure 16. We call these Eclipse fold-sheet stacking and staggered fold-sheet stacking, respectively.
In addition, considering the stacking of the folded sheets in the chain direction, there are two ways of stacking the lamella, as shown in Fig. 17. We call these Eclipse lamella stacking and Staggered lamella stacking. The difference between them and the conversion between them involves only loop vdW interactions. For the folded sheets of Alkane loop type I shown in Figure 12c, Eclipse lamella stacking is better than Staggered lamella stacking by 0.422 kcal/mol/fold (keeping the c length still fixed at 50 Å).
Different lamella stacking type gives different optimum b spacing. For the folded sheets of Alkane loop type I, Staggered lamella stacking gives 45.3 Å, which is 1.3 Å larger than for Eclipse lamella stacking.
To be consistent, all the unit cells simulated below are constructed using Eclipse lamella stacking.
From Fig. 15, 16, 17, there are total 23=8 possible stacking schemes for folded sheets. We will consider just the two best of them.
4.4.2 Folded sheet displacements
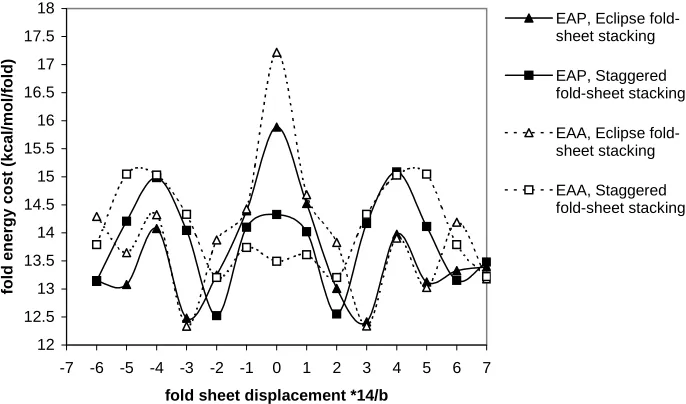
12 12.5 13 13.5 14 14.5 15 15.5 16 16.5 17 17.5 18
-7 -6 -5 -4 -3 -2 -1 0 1 2 3 4 5 6 7
fold sheet displacement *14/b
fold energy cost (kcal/mol/fold)
EAP, Eclipse fold-sheet stacking
EAP, Staggered fold-sheet stacking
EAA, Eclipse fold-sheet stacking
EAA, Staggered fold-sheet stacking
[image:42.595.140.483.127.329.2]Figure 18. Fold energy cost for different sheet displacements of Alkane loop type I
Figure 19. Various fold sheet displacements of Eclipse fold-sheet stacking loop
parts
stem
sheet a sheet b
a. The fold sheet displacement is zero. There is strong vdw repulsion between the folded parts, but the packing of the stem parts is good.
sheet a
sheet b
b. The fold sheet displacement is 3b/14. The
amide part in sheet aprovides much space for
For both EAP and EAA we find that the best displacement for Eclipse fold-sheet stacking is 3/14 b. Two factors affect the fold sheets stacking.
One factor comes from the loop parts (see Fig. 19). The loop parts need more space than the straight stem segment. Thus there exists a strong repulsion energy of the loop parts for zero sheet displacement of Eclipse fold-sheet stacking, as shown in Fig. 19a. In addition, the amide part provides much space for the loop of the adjacent sheet, as shown in Fig. 16b.
The second factor is that the stacking between the stem parts is better than the stacking between the loop part and the stem part, which is not significant compared with the first factor.
C N
C N
N C
C N C O
O
H
H H
H
O
O
C N
C N
O
O
H H
Amide pocket I Amide pocket II
Figure 20 Amide pockets for the loop in adjacent sheet
For Eclipse fold-sheet stacking, the best place to accommodate the adjacent loop is the Amide Pocket I as shown in Fig. 20. Thus the best fold-sheet displacement is 3/14b.
loop is Amide pocket II instead of Amide pocket I, as shown in Fig. 20. Thus the best fold-sheet displacement is 2/14b. See Fig. 18 for the energy comparisons.
These results of the optimum sheet displacement are consistent with the conclusion from fiber X-ray results.6
4.5 Optimum loop type in 3D lamella crystal
Section 4.3 found that the optimum loop type for an individual molecule is Alkane loop type I. In the 3D lamella crystal, this might change because of Inter bonds (including H-bonds formed between adjacent loops) and different ways of stacking of the folded layers.
To simplify the comparisons, we consider only Eclipse fold-sheet stacking and Loop stacking type I in constructing 3D lamella crystals of all five different loop types.
For intra-sheet loop type, the 3D lamella crystal structures were constructed from EAP infinite chain model structures.
For inter-sheet loop type, the lamella crystal structures were constructed from EAA infinite chain model structures.
Figure 21. Fold energy cost of different types of loops for 3D lamella crystal
The results in Figure 21 show that, in the 3D lamella crystal structure, the inter-sheet loop between H-bond sheets is more stable by 5.3 kcal/mol/fold than the best intra-sheet loop (Alkane loop type I). The reason for this is the lack of loop ring constraints for the fold between H-bond sheets, allowing greatly reduced strain and allowing 100% of the H-bonds to be formed.
The Inter-sheet loop leads to Inter H-bonds, which considering the dynamics of the crystal growth should be worse than loops with Intra H-bonds (See section 3.4).
groups in the Amide loop type I can form weak H-bonds between adjacent loops, this costs a significant amount of packing energy (involving the methylene group and the amide group from stem to loop). The result is that Alkane loop type I remains the best type for intra-sheet loops.
Thus Alkane loop type I should be the dominant loop type for 3D lamella crystals of nylon 6. However, it is not possible to have Alkane loop type I in both sides of the stem if there are an odd number of amide units in the straight stem segment. On the other hand Amide loop type I, which is only 4 kcal/mol/fold worse than Alkane loop type I is allowed no matter how many amide units are in the straight stem segment. Thus we expect that the lamella in experimental structures will have coexisting Alkane loop type I and Amide loop type I, but with a majority of Alkane loop type I.
Figure 22. Various stacking schemes for H-bonded sheets
4.6 Monoclinic versus triclinic
All the folded crystal structures above are monoclinic unit cells (Fig. 22a) in which alternate sheet displacements are EAP+3 and EAP-3. In Fig. 22b, we consider the best
a) Monoclinic unit cell (staggered shear)
b) Triclinic unit cell (progressive shear)
lamella structure of nylon 6 when each sheet displacement is the same (EAP+3), leading to a triclinic unit cell. We find that triclinic is 0.213 kcal/mol/residue more stable than monoclinic. This is explained by our Amide Pocket model. The Amide Pocket effect is not quite as good if the same pocket must provide space for both adjacent loop parts as in Fig. 22a. The monoclinic and triclinic lamella in Fig.22a and 22b are the extreme case of perfectly ordered structures. More likely is that growth kinetics will lead to lamella illustrated in Fig.22c, which has a nearly random combination of 22a and 22b. The lamella in 22c would be entropically favored and is probably close to the real lamella for nylon 6.
From fiber x-ray6, it has been determined that the lamella in nylon 66 α form is progressive shear (Fig. 22b) whereas nylon 6 α form and nylon 66 β form have staggered shear (Fig. 22a). This difference between Nylon 66 and Nylon 6 arises because it is easier for the amine residue in Nylon 66 to form the loop (due to less loop constraint than in the carbonic acid residue). Also, the amine residue of nylon 66 is bigger than the residue of nylon 6. Thus the Amide Pocket effect in nylon 66 should be more significant than in nylon 6, leading to a stronger preference for progressive shear observed in nylon 66 α.
A progressive shear was also concluded to be favored for nylon 4639 and explained it from surface H-bonds with an assumption that the fold part including two amide units.39 Our amide pocket model explains the enthalpy favorable progressive shear without such an assumption. Further work need to be performed for nylon 66 and nylon 46 to clarify the best loop structure and competing factors.
5. Summary
(1) Assuming infinite chains and evaluating the free energy for all 112 regular crystal structures, we find three classes of regular crystal structures: α form (with amide bonds parallel to the methylene sheets), γ form (with amide bonds ~ perpendicular to the methylene sheets), and δ form (somewhat intermediate between α and γ). These results for α and γ agree well with experimental data. We find that at 300K the α form is most stable with γ and δ higher by 0.4 and 0.3 kcal/mol (per amide) respectively. The Young’s modulus in the chain direction is 295 GPa for α, 135 GPa for γ, and 253 GPa for δ. The only experimental data is 168 GPa for α which is below the calculated value because of the finite thickness of the lamella, the disorder of the chain conformation, and non-perfect crystal in the experimental system.
(2) The concepts of molecule, Intra & Inter H-bonds are introduced and we find the thermostability of α form over other forms comes from Intra H-bonds in α form, which are dynamically and entropically favored.
(3) Five detailed transition steps between α form and γ form are proposed and the structures of the two metastable crystalline βforms and δ form are identified. The structure of β form, (which has disordered chain conformations and H-bonds in [100], [010], and [110] directions) is consistent with the fiber X-ray results from Auriemma et al24. The δ form defined here accounts for the metastable crystalline phase between β form and γ form, and fits the characteristics of the metastable crystalline discussed by Murthy.23 It has a similar fiber-axis diffraction scan as α form and has a similar equatorial diffraction scan as γ form. These results suggest that stretching and relaxing the fibers, would transform between γ and δ.
(5) Since Nylon forms lamellae with finite thickness in the chain direction, we considered all five possible loop structures and the two best (of 8) possible stacking schemes for folded sheets together with 14 folded-sheet displacements. The Five types of loop structures of nylon 6 are:
Two with Intra H-bonds including two amide units (called Amide loop type I and II)
Two with Intra H-bonds including one amide unit (called Alkane loop type I and II) One with Inter H-bonds including one amide unit
We find that for individual molecules the Alkane loop type I is the best with the others worse by at least 4.5 kcal/mol/fold. However in 3D lamella crystals, the inter-sheet case with loops between hydrogen bond sheets (leading to γ form or δ form packing) has an energy 5.3 kcal/mol/fold lower than the best intra -sheet case. This is because there is no ring constraint on the structure of the loops.
We find that the optimum lamella for α form have the alkane loop fold (one amide per loop) and pack so that adjacent sheets are displaced by ± 3.7 Å (3/14b), which is in good agreement with the conclusion from fiber x-ray (Holmes6). Amide pocket model is proposed to explain the observed sheet displacement in nylon 6, and it can also explain the observed sheet displacement in nylon 66 and progressive shear in nylon 66 and nylon 46.
6. Acknowledgment
Avery-Dennison, General Motors, Kellogg’s, Asahi Chemical, Beckman Institute, and Nippon Steel.
7. References:
1. Hatfield, G. R.; Glans, J. H.; Hammond, W. B. Macromolecules 1990, 23, 1654. 2. Murthy, N. S.; Khanna, Y. P. Chem. Mater. 1993, 5, 672.
3. Dasgupta S.; Hammond, W. B.; Goddard III W. A. J. Am. Chem. Soc. 1996, 118, 12291.
4. Karasawa, N.; Goddard III, W. A. J. Phys. Chem. 1989, 93, 7320.
5. Dasgupta S.; K. A. Brameld, C. -F. Fan, W. A. Goddard III, Spectrochimica Acta Part A 53 1997, 1347.
6. Holmes, D. R.; Bunn C. W. and Smith D. J., J. Polym. Sci. 1955, 17, 159. 7. Karasawa, N.; Dasgupta, S.; Goddard III W. A. J. Phys. Chem. 1991, 95, 2261 8. Karasawa, N.; Goddard III, W. A. Macromolecules 1992, 25, 7268.
9. Arimoto H., Ishibashi M., Hirai M. and Chatani Y., J. Polym. Sci. A 1965, 3, 317. 10.Abu Isa, I. J. Polym. Sci., Polym. Chem. Edn 1971, 9, 199.
11.Murthy, N. S., Szollosi, A. B., Sibilia, J. P. and Krimm, S. J. Polym. Sci., Polym. Phys. Edn 1985, 23, 2369.
12.Miyasaka, K. and Makishima, K. J. Polym. Sci. A1 1967, 5, 3017. 13.Miyasaka, K. and Ishikawa, J. J. Polym. Sci. A2 1968, 6, 1317. 14.Hiramatsu, N. and Hirakawa, S. Polym. J. 1982, 14, 165. 15.Ziabicki, A. Collect. Czech. Chem. Commun. 1957, 22, 64. 16.Ziabicki, A. Kolloid Z 1959, 167, 132.
17.Ziabicki, A. and Kedzierska, K. J. Polym. Sci. 1959, 2, 14 18.Avramova, N. and Fakirov, S. Polym. Commun. 1984, 25, 27. 19.Roldan, L. G. and Kaufman, H. S. Polym. Lett. 1963, 1, 603.
20.Illers, K. H.; Haberkorn, H. and Simak, P. Makromol. Chem. 1972, 158, 285.
21.Stepaniak, R. F.; Garton, A.; Carlsson, D. J. and Wiles, D. M. J. Polym. Sci., Polym. Phys. Edn 1979, 17, 987.
22.Startsev, O. V.; Iordanskii, A. L. and Zaikov, G. Ye. Polym. Sci, USSR 1988, 30, 1625. 23.Murthy N. S., Polymer communications, 1991, 32, 10, 301.
24.Auriemma, F.; Petraccone, V.; Parravicini, L. and Corradini, P. Macromolecules 1997, 30, 7554.
25.Malta, V., Cojazzi, G., Fichera, A., Ajo, D., Zanetti, R. Eur. Polym. J. 1979, 15, 765. 26.Salem, D. R.; Weigmann, H.-D., Polym. Commun. 1989, 30, 336.
27.Murthy N. S., Minor H, Polymer communications, 1991, 32, 10, 297.
29.Simon, P., Argay, Gy. J. Polym. Sci., Polym. Phys. Ed. 1978, 16, 935. 30.Leon, S.; Aleman, C.; Munoz-Guerra, S. Macromolecules 2000, 33, 5754. 31.Sakurada, I.; Kaji, K. J. Polym. Sci., C 1970, 31, 57.
32.Welch P. and Muthukumar M. Phys. Rev. Lett. 2001, 87, 21: art. No. 218302. 33.Arimoto, H., J. Polym. Sci. A 1964, 2, 2283.
34.Murthy, N. S.; Szollosi, A. B.; Sibillia, J. P. and Krimm, S. J. Polym. Sci., Polym. Phys. Edn 1985, 23, 2369.
35.Zhao Y. L. and Wu Y. D., J. Am. Chem. Soc. 2002 124, 1571. 36.Hoffman, J. D. SPE Transactions 1964, 315.
37.Jones, N. A.; Sikorski, P.; Atkins, E. D. T. and Hill M. J., Macromolecules 2000, 33, 4146.
38.Trifan, D. S. and Terenzi, J. F., J. Polymer Sci. 1958, 28, 443.
39. Bermudez, M.; Leon, S.; Aleman, C.; Munoz-Guerra, S.; J. Polym. Sc. Polym. Phys. Edn 2000, 38, 41.
Table 1. The free energy (kcal/mol/amide unit), Young’s modulus (GPa) of regular crystal structures of nylon 6 at 300 K
SD*14/b 7 6 5 4 3 2 1 0 -1 -2 -3 -4 -5 -6 F 50.61 50.99 50.62 50.77 50.63 50.76 50.66 51.22 50.79 50.75 50.71 50.78 50.66 50.01 EAP
α EY 295.8 257.5 285.5 294.6 294.6 284.6 267.3 293.1 268.2 283.4 294.6 294.4 285.2 263.4
F 50.12 50.74 50.76 50.77 50.59 50.60 50.85 50.88 50.82 50.89 50.66 50.62 50.78 50.74 EAA
α EY 294.9 295.2 276.1 281.2 300.2 301.1 243.5 245.7 241.7 238.8 300.4 300.7 277.7 279.2
F 50.84 50.69 50.49 50.84 50.74 50.50 50.79 50.69 50.83 50.39 50.58 50.48 50.86 50.97 EPA
δ EY 277.8 282.4 103.4 277.8 290.9 274.2 266.9 137.5 171.7 253.2 282.5 115.5 278.2 228.0
F 51.29 50.77 50.62 50.54 50.55 50.54 50.81 51.06 50.74 50.54 50.56 50.56 50.62 50.77 EPP
EY 299.3 259.1 224.5 226.0 238.1 238.9 220.0 292.8 218.2 238.9 243.8 226.2 233.9 259.0
F 50.54
TAP
γ EY 135.0
F 50.47
TPP
EY 153.6
a There are 8 amide units in the simulation unit cell as shown in Figure 2.
b SD is the sheet displacement. For EPA and EAA, the definition of SD is a little tricky. We invert the adjacent
sheet first and then define the sheet displacement. b as the length of the unit cell in chain direction.
c The free energy at 300K is the sum of the zero point energy (ZPE), the potential energy and entropy at 300K.
d Young’s modulus (GPa) is in the chain direction.
Table 2. The unit cell parameters for various forms of nylon 6 crystal. Simulated at 0 K and experimental strrucrues at 298 K
Crystal form A/Å b/Å c/Å β (angle)
EAP-crossed 9.41 17.68 8.11 65.1o
EAP-uncrossed 9.53 17.67 7.87 68.1 o
EAA-crossed 9.49 17.68 8.07 65.0o
EAA-uncrossed 9.53 17.67 8.06 65.1o
Exp. α6 9.56 17.24 8.01 67.5o
TPA 4.97 17.33 8.68 127.5o
Exp. γ9 4.78 16.88 9.33 121o
EPA-crossed 4.72 17.67 7.91 114.6o
EPA-uncrossed 4.77 17.67 8.75 122.0o
Table 3. The energy for the H-bond schemes shown in Fig. 7 using the MSXX FFa
E (kcal/mol/amide unit) H-bond I H-bond II H-bond III
Val 30.644 30.592 30.656
VdW 4.321 3.388 3.217
Electrostatic -70.005 -69.605 -69.534
Total -35.040 -35.625 -35.661
a The c length of unit cell is restricted to 50 Å.
Table 4. The calculated (020) and (040) intensities/relative ratios for different sheet displacements of EAP, compared to experiment (ref. 6)
SD *14/b 0 -1 -2 -3 -4 -5 -6 Exper
020 60.3/6.1% 49.5/5.1% 25.3/2.6% 3.1/0.3% 2.2/0.2% 23.3/2.4% 47.5/5.0% 1/0.1%
040 20.6/2.1% 8.7/0.9% 0.5/0.1% 17.2/1.8% 17.9/1.9% 1.2/0.1% 6.6/0.6% 6/0.6%
SD *14/b 1 2 3 4 5 6 7
020 49.0/5.0% 21.6/2.2% 2.9/0.3% 3.9/0.4% 23.9/2.4% 50.5/5.1% 60.7/6.1%
040 8.0/0.8% 1.8/0.2% 17.8/1.8% 15.6/1.6% 0.9/0.1% 9.5/1.0% 21.6/2.2%
Table 5. The unit cell parameters of nylon 6 lamella crystal after minimization at 0 K
Fold type of lamella A/Å b/Å c/Å β (angle)
Amide I 9.42 53.58 8.45 64.5o
Amide II 9.43 54.10 8.03 72.9 o
Alkane I 9.38 44.03 8.11 70.0o
Alkane II 9.37 44.20 8.06 73.4 o
Inter-sheet 9.47 53.74 8.24 64.8 o
Table 6. The energy cost different types of fold in individual molecule and 3D lamella crystal (SD=3/14b) (kcal/mol/fold)
Fold type Amide I Amide II Alkane I Alkane II Inter-sheet
Individual molecule 10.625 18.194 8.164 19.202 25.173
C h a p t e r 2
CRYSTAL STRUCTURE AND PROPERTIES OF N6/AMCC
COPOLYMER FROM THEORY AND FIBER XRD
*AB STR ACT
The MSXX force field developed previously from ab initio quantum calculations for studies of nylon are used to study the crystal structure and properties of the copolymer of nylon 6 with AMCC (4-aminomethylcyclohexanecarboxylic acid). For the isolated chain conformation of the copolymer, we consider both axial and equatorial connections of the chain with the cyclohexane ring and find that the best is Chair-ee-St, which has equatorial connections on both ends of chair cyclohexane. We consider 12 possible crystal structures for the copolymer (the best four conformations of the isolated chain with the three forms of packing these chains: α form, γ form, and δ form). With 12.5 % of AMCC in the copolymer, we find that γ form with the Chair-ee-St chain structure is the most stable, even though α form is most stable for nylon 6. The calculated X-ray diffraction patterns of the predicted crystal structure fit both equatorial and meridional scans of XRD very well. There are two reasons that make α form less stable for the copolymer. One is the bad contact between the axial hydrogen atoms of the cyclohexane ring and the CH2 hydrogens. The other is the difficulty of intra-molecular H-bonds in the copolymer.
The predicted chain-axis repeat distance of the copolymer (0K) is 1.4Å smaller than for the α form of Nylon 6, in good agreement with the X-Ray results, which indicates that it is 1.5 Å smaller (at 300K).
The Young’s modulus in the chain direction is calculated to be 93 GPa for the copolymer (at 0K), which compares to 135 and 295 GPa predicted for γ form and α form nylon 6,
respectively. The indroduced cyclohexane ring locates between the two amide pockets of the adjacent hydrogen bond sheets and has two major effects on the properties of the copolymer:
i) It causes twisted conformations, which decreases the Young’s modulus of the copolymer in chain direction.
ii) It makes the chain rigid, which likely is responsible for the decrease in sensitivity of the copolymer to moisture
1. Introduction
Copolymers provide a robust and economical route to enhance the performance range of a polymer. “Isomorphous” replacement of ε-aminocaproic acid residues in nylon 6 by 4-aminomethyl-cyclohexancecarboxylic acid (AMCC) has been reported by several authors. 1-5 The nylon 6 lattice can accommodate less than 30 mole-% AMCC residues before a new structure appears.5 Cis-AMCC isomerizes to the more thermodynamically stable trans isomer during copolymerization with caprolactam (CL) and also during homopolymerization.5
Nylons crystallize in two crystalline forms commonly referred to as α and γ. In the α form the hydrogen bonds are between antiparallel chains while in the γ form they are between parallel chains.6 The α form is stable in nylon 4 while the γ form is stable for nylon 8 and above.7 Nylon 6 is unique in that it is observed to crystallize easily in either crystalline forms and can be transformed from one to another.8
the copolymer using both molecular modeling and X-ray diffraction. We conclude that just 12.5% of AMCC in the copolymer is sufficient to change the energetic preference of nylon 6 from the α form to the γ form. We will use the theory to analyze why this change occurs.
2. Calculation details
We use the MSXX FF7 with the MSC version of PolyGraf (version 3.30, Caltech version) for all calculations. Cerius2 (v4.0) was also used for graphics and manipulations. The electrostatic and van der Waals (vdW) interactions use the accuracy bounded convergence acceleration (ABCA) Ewald technique9 for computing the nonbond energies of periodic systems. We use an accuracy of 0.001 kcal/mol. All structures are minimized to an rms force on all atoms of 0.01 kcal/(mol Å) for atom and rms stresses of 0.1 kcal/(mol Å) using conjugate gradient method.
2.1. Force field
The MSXX force field for simulation of nylon polymers was derived from ab initio QM calculations.7 Special emphasis was given to the accuracy of the hydrogen bond potential for the amide unit and the torsional potential between the peptide and alkane fragments.
This hydrogen bond potential was derived from MP2/6-31G** calculations of the formamide dimer. Subtracting electrostatic interactions (based on fixed-point charges extracted from QC on the monomers) leads to a repulsive exponential form (Eq. 1) of the short-range hydrogen bond potential7 with A=0.028 kcal/mol, C=0.251 Å, and Re=3.017 Å.
⎥⎦ ⎤ ⎢⎣
⎡− − =
C R R A
EEXP e
vdW
) (
exp (1)
The full torsion potential between peptide and alkane fragment was calculated by optimizing the geometry (using HF/6-31G**) at each point on the torsional curve and the torsional potential is represented by a Fourier series (Eq. 2) in MSXX force field.
∑
==
= 6
0 cos 2
1n n
n
torsion V n
E τ (2)
where: τ is the torsional angle (τ=0 for cis), and Vn is the barrier (energy of cis over trans).
Detailed MSXX force field was described in previous paper.7