ABSTRACT
ATHE, PARIDHI. A Framework for Predictive Capability Maturity Assessment of Computer Simulation Codes. (Under the direction of Dr. Nam Dinh).
This work presents a formalized and computerized framework for the assessment of
decision regarding the adequacy of a simulation tool for a nuclear reactor application. The
adequacy of a simulation code for an intended application is determined by verification, validation
and uncertainty quantification (VVUQ) of the code. Therefore, the decision regarding code
adequacy is dependent on the assessment of different attributes that govern verification, validation
and uncertainty quantification of the code. In this work, the focus is on code validation. Therefore,
the framework is developed and illustrated from the perspective of decision regarding the
validation assessment of code. Code validation assessment is performed based on the validation
test results, data applicability and process quality assurance factors. The process quality assurance
factors warrant the trustworthiness of the evidence and help in checking people and process
compliance with respect to the standard requirements.
The proposed framework is developed using an argument modeling technique called Goal
Structuring Notation (GSN). Goal structuring notation facilitates structural knowledge
representation, information abstraction, evidence incorporation and provides a skeletal structure
for quantitative maturity assessment. The decision schema for the development of the decision
model is based on the Predictive Capability Maturity Model (PCMM) and Analytic Hierarchy
Process (AHP), and formalized using Goal structuring notation. Each decision attribute is
formulated as a claim, where the degree of validity of the claim (attribute’s assessment) is
expressed using different maturity levels. The GSN representation of the decision model is
transformed into a confidence network to provide evidence-based quantitative maturity assessment
distance metric, is proposed to measure the distance between target maturity and achieved maturity
on a scale of 0 to 1. Expected distance metric helps in comparing the assessment of different
attributes and identification of major areas of concern in terms of modeling capability, data needs,
and quality of assessment process. Practical application of the framework is demonstrated by two
case studies. The first case study is focused on validation assessment of a thermal-hydraulic code
for a challenge problem called Departure from Nucleate Boiling (DNB). The second case study is
focused on assessment of multiphysics codes for another challenge problem called CRUD Induced
© Copyright 2018 by Paridhi Athe
A Framework for Predictive Capability Maturity Assessment of Simulation Codes
by Paridhi Athe
A dissertation submitted to the Graduate Faculty of North Carolina State University
in partial fulfillment of the requirements for the degree of
Doctor of Philosophy
Nuclear Engineering
Raleigh, North Carolina
2018
APPROVED BY:
_______________________________ _______________________________
Dr. Nam Dinh Dr. Abhinav Gupta Committee Chair
_______________________________ _______________________________
Dr. David Kropaczek Dr. Maria Avramova
ii
DEDICATION
It is the sunrise, filling the sky with light and beautiful colors, It is the little bird, lovingly feeding its young ones,
It is the cute squirrel, jumping and eating all around, It is the dandelion seed, flying across the endless blues,
It is the tiny sapling, emerging out of a crevice,
It is life, blooming and beating in every corner of the world, So mysterious, yet so amazing!
iii
BIOGRAPHY
Paridhi Athe was born in Raisen, a small town in the central part of India, to Manlata Athe
and Prakash Athe. She has two elder siblings. She is very close to her family. Her parents, brother
Pratik Athe, and sister Pallavi Athe have always been a source of inspiration and strength to her.
She completed her undergraduate degree in Electronics and Telecommunication
engineering from Shri Govindram Seksaria Institute of Technology and Science in 2007. She got
a master’s degree in Electronics and Communication Engineering with specialization in
Semi-conductor devices and VLSI Technology from Indian Institute of Technology Roorkee in 2009.
Paridhi got another master’s degree in Nuclear Engineering from Indian Institute of Technology
Kanpur in 2011. Paridhi started her doctoral study in Nuclear Engineering at North Carolina State
University in Fall 2012. She started working with Dr. Nam Dinh as her Ph.D. advisor in Fall 2014.
Her current research is focused on the development of framework for predictive capability maturity
assessment of computational tools.
iv
ACKNOWLEDGMENTS
I would like to express my gratitude to my thesis supervisor, Dr. Nam Dinh, for his erudite guidance throughout my thesis work. His analytical and methodical way of working has inspired me, and under his guidance, I have learned a lot. The quantum of knowledge I gained during his inspiring guidance would be immensely beneficial for my future endeavors. Next, I want to thank Dr. Robert W. Youngblood, Dr. Abhinav Gupta, Dr. David Kropaczek and Dr. Maria Avramova for agreeing to be my committee member and devoting their time to review my thesis.
I would like to acknowledge the US Department of Energy via the Consortium for Advanced Simulation of Light Water Reactors (CASL) and NCSU college of Engineering for supporting this research. I am also thankful to the developers of Assurance and Safety Case Environment (ASCE 4.2) and AgenaRisk software that has been used in this research.
I appreciate Dr. Hany Abdel-Khalik for his guidance and support during the initial phase
of my Ph.D. I am also thankful to Dr. Igor Bolotnov, Dr. John Mattingly, Dr. Joseph Michael Doster, Dr. Dmitriy Anistratov, Dr. Steve Shannon, and Dr. Carl Meyer. Their courses have been a great learning experience for me. I am grateful to Dr. Prabhat Munshi for his encouragement and advice. Next, I want to thank my colleagues, Bassam Khuwaileh, Mohammad Abdo, Young Suk Bank, Jason Hite, Chih-Wei Chang, Yang Liu, Linyu Lin, Botros Hanna, Han Bao, Joomyung Lee, Yangmo Zhu, their comments and feedback on my research were very helpful. I want to thank Shefali Saxena, Arka Datta, Anand Vardhan Mishra, Rudrodip Majumdar, Yuwei Zhu, Jun Fang, Baljinder Kaur, Suman Dhayal, Vandana Dhayal, Nilesh Kumar, Anant Raj and Prerna Prateek, for the wonderful time I spent with them during my stay in Raleigh.
v
TABLE OF CONTENTS
LIST OF TABLES ... viii
LIST OF FIGURES ... viii
LIST OF ACRONYMS ... xviii
CHAPTER 1: INTRODUCTION ... 1
Motivation ... 1
Dissertation overview ... 3
1.2.1. Objectives ... 3
1.2.2. Technical approach ... 4
1.2.3. Dissertation structure ... 5
Glossary ... 7
CHAPTER 2: TECHNICAL COMPONENTS BACKGROUND ... 11
Introduction ... 11
Complexity resolution ... 11
Standards and methodologies for credibility assessment of M & S tools... 15
2.3.1. Code Scaling, Applicability, and Uncertainty (CSAU) evaluation methodology ... 16
2.3.2. Evaluation Model Development and Assessment Process ... 17
2.3.3. Contemporary standards for verification and validation of computer codes ... 19
2.3.4. Predictive capability maturity model and other maturity assessment methodologies 24 Decision analysis and decision process ... 32
CASL codes and activities ... 37
Scaling techniques ... 40
Safety case and argumentation... 45
2.7.1. Safety case, arguments, and evidence ... 46
2.7.2. Goal structuring notation (GSN) ... 51
Candidate tools/techniques for maturity quantification ... 54
2.8.1. Evidential reasoning... 54
2.8.2. Fuzzy logic and fuzzy inference system ... 58
2.8.3. Bayesian networks ... 69
Transforming goal structuring notation (GSN) to computable network ... 75
Summary ... 78
CHAPTER 3: FORMALIZING THE ASSESSMENT PROCESS ... 79
Introduction ... 79
vi
Code verification and validation overview ... 82
Research approach ... 87
Formulation of the assessment framework ... 89
3.5.1. Preprocessing for the framework development ... 89
3.5.2. Structural knowledge representation... 92
3.5.3. Classification and characterization of evidence ... 102
3.5.4. Formulation of the decision model ... 111
3.5.5. Evaluation and interpretation of result ... 125
3.5.6. Refinement ... 126
Summary ... 128
CHAPTER 4: ASSESSMENT FRAMEWORK DEMONSTRATION - CASE STUDY I ... 129
Objective of the case study ... 130
Demonstration of the framework ... 131
4.2.1. Preprocessing for the framework development ... 131
4.2.2. Structural knowledge representation... 132
4.2.3. Classification and characterization of evidence ... 136
4.2.4. Formulation of decision model ... 147
4.2.5. Evaluation and interpretation of result ... 169
4.2.6. Refinement ... 173
Summary remarks ... 175
CHAPTER 5: ASSESSMENT FRAMEWORK DEMONSTRATION-CASE STUDY II ... 176
Objective of the case study ... 176
Demonstration of the framework ... 176
5.2.1. Preprocessing for the framework development ... 177
5.2.2. Structural knowledge representation... 177
5.2.3. Classification and characterization of evidence ... 188
5.2.4. Formulation of decision model ... 190
5.2.5. Evaluation and interpretation of result ... 204
5.2.6. Refinement ... 207
Summary remarks ... 208
CHAPTER 6: ANALYSIS OF THE FRAMEWORK... 209
Sensitivity analysis... 209
Sources of uncertainty in the decision model ... 218
vii
Summary ... 220
Contributions... 221
Recommendation for future work ... 223
REFERENCES ... 224
APPENDICES ... 230
Appendix A: Using Fuzzy logic for maturity quantification ... 231
A.1. Example 1: Codifying expert knowledge... 231
viii
LIST OF TABLES
Table 2.1: Elements of PCMM and maturity levels [3] ... 27
Table 2.2: Different level of maturity in PCMM as explained by Oberkampf et. al. [3](for detail PCMM matrix see Appendix A) ... 27
Table 2.3: Detail PCMM matrix [3] ... 28
Table 2.4: NASA Credibility assessment level [4] ... 30
Table 2.5: Comparison of different standards for assessing credibility of M & S tool ... 31
Table 2.6: Critical elements governing M & S integration into the decision (as presented by Kothe [38]) ... 37
Table 2.7: Important force ratios in fluid dynamics [43] ... 41
Table 2.8: Types of evidence [51, 53] ... 48
Table 2.9: Elements of Toulmin’s Argument model [54]... 50
Table 2.10: Standard fuzzy operations... 60
Table 2.11: Example of fuzzy set ... 63
Table 2.12: Conditional probability table for node A ... 71
Table 2.13: Comparison of BN, FL & FIS and ER ... 74
Table 3.1: Analogy between safety case and code prediction and validation. ... 95
Table 3.2: Rules for checking consistency of GSN network in ASCE [95] ... 98
Table 3.3: Description of capability grade for different validation attribute ... 106
Table 3.4: PQA factors related to Phenomenology Pyramid ... 108
Table 3.5: Process quality assurance factors related to validation evidence assessment with associated grade ... 111
Table 3.6: Descriptors for states in the validation example ... 119
Table 3.7: Conditional probability table for the code adequacy (CA) ... 119
ix
Table 3.9: Estimation of probability distribution (for data applicability) based on
multiple evidence assessment ... 121
Table 3.10: PIRT table (example) ... 123
Table 3.11: Illustration of expected distance metric ... 126
Table 4.1: Specify the issue, simulation tool and decision objective (Step 1) ... 131
Table 4.2: Specify scenario, system condition, FOM (Step 2) ... 132
Table 4.3: PIRT (Phenomena resolution)→ Important 𝐼𝜖[0,3] ; Knowledge 𝐾𝜖[0,3] (Step 3) ... 132
Table 4.4: Characterization of Turbulent mixing in single phase flow (TM in SPF) ... 138
Table 4.5: Classification and characterization of evidence for turbulent mixing in single phase flow [with capability grade (CG→0/1/2/3/4)] ... 138
Table 4.6: Evidence for turbulent mixing in single phase flow (based on CTF validation and verification report [100]) ... 139
Table 4.7: Characterization of turbulent mixing in two phase flow (TM in TPF)... 140
Table 4.8: Classification and characterization of evidence for of turbulent mixing in two phase flow [with capability grade (CG→0/1/2/3/4)] ... 141
Table 4.9: Evidence for of turbulent mixing in two phase flow ( based on CTF validation and verification report [100]) ... 142
Table 4.10: Characterization of natural circulation in single phase flow ... 142
Table 4.11: Classification and characterization of evidence natural circulation in single phase flow [with capability grade (CG→0/1/2/3/4)] ... 143
Table 4.12: Evidence for natural circulation in single phase flow ( based on CTF validation and verification report [100]) ... 143
Table 4.13: Characterization of pressure drop in single phase flow (PD in SPF) ... 143
Table 4.14: Classification and characterization of evidence pressure drop in single phase flow [with capability grade (CG→0/1/2/3/4)] ... 144
Table 4.15: Evidence for pressure drop in single phase flow (based on CTF validation and verification report [100]) ... 144
x
Table 4.17: Classification and characterization of evidence for pressure drop in two phase
flow [with capability grade (CG→0/1/2/3/4)] ... 145
Table 4.18: Evidence for pressure drop in two phase flow (based on CTF validation and verification report [100]) ... 145
Table 4.19: Characterization of nucleate boiling ... 146
Table 4.20: Classification and characterization of evidence for nucleate boiling [with capability grade (CG→0/1/2/3/4)] ... 146
Table 4.21: Evidence for nucleate boiling (based on CTF validation and verification report [100]) ... 146
Table 4.22: Description of gap for validation of CTF for departure from nucleate boiling ... 147
Table 4.23: Estimation of probability distribution of validation test result (VTR) for turbulent mixing in single phase flow, TM (SPF), based on multiple evidence from Table 4.5 ... 149
Table 4.24: Estimation and interpretation of result for all primary validation attribute ... 170
Table 4.25: Estimation and interpretation of result for data relevance assessment (DRA) ... 170
Table 4.26: Estimation and interpretation of result for physics scaling assessment (PSA) ... 171
Table 4.27: Estimation and interpretation of result for data uncertainty assessment (DUA) .... 171
Table 4.28: Estimation and interpretation of result for assessment of validation test results (VTR) ... 172
Table 4.29: Estimation and interpretation of result for process quality assurance (PQA) factors for validation evidence assessment (VEA) process ... 172
Table 4.30: Estimation and interpretation of result for process quality assurance (PQA) factors for phenomenology pyramid (PP) ... 172
Table 5.1: Specify the issue, simulation tool and decision objective (Step 1) ... 177
Table 5.2: Specify scenario, system condition, FOM (Step 2) [20] ... 177
Table 5.3: Evidence table in CASL report [20] ... 189
Table 5.4: Estimation and interpretation of result for all primary validation attribute ... 204
Table 5.5: Estimation and interpretation of result for Neutronics code ... 204
xi
Table 5.7: Estimation and interpretation of result for Fuel modeling code ... 205
Table 5.8: Estimation and interpretation of result for Coolant chemistry code ... 205
Table 5.9: Estimation and interpretation of result for coupled simulation code ... 206
Table 5.10: Estimation and interpretation of result for process quality assurance (PQA)
factors for evidence assessment process (EAP) ... 206
Table 5.11: Estimation and interpretation of result for process quality assurance (PQA)
factors for phenomenology pyramid ... 206
xii
LIST OF FIGURES
Figure 1.1: Illustration of code adequacy assessment ... 3
Figure 2.1: Evaluation Model Development and Assessment Process [2] ... 19
Figure 2.2: AIAA validation pyramid [5] ... 21
Figure 2.3: ASME Verification and Validation flowchart [29] ... 22
Figure 2.4: M & S results credibility assessment scale used by NASA [4]... 23
Figure 2.5: M & S Influence-Decision Consequence Risk Matrix used by NASA [30] ... 24
Figure 2.6: Spreadsheet tool used by PCMM [32] ... 29
Figure 2.7: Radar plot used in PCMM [32] ... 29
Figure 2.8: A closed loop decision process [33] ... 32
Figure 2.9: Standard form of decision schema in AHP [35]... 35
Figure 2.10: CASL Validation Pyramid [26] ... 39
Figure 2.11: System decomposition and hierarchy in H2TS [14] ... 45
Figure 2.12: Components of a safety case [49]... 47
Figure 2.13: The McDermid Square as presented in the U.K. Defense Standard 00-56 [12] ... 49
Figure 2.14: Toulmin’s Argument model [54] ... 50
Figure 2.15: Elementary blocks of GSN ... 51
Figure 2.16: An example of using GSN from GSN community standard [56] ... 53
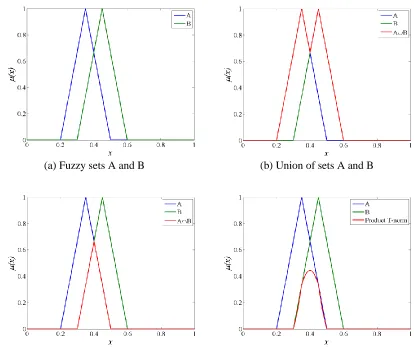
Figure 2.17: Fuzzy set for middle aged man... 60
Figure 2.18: Different operations on fuzzy sets ... 61
Figure 2.19: Fuzzy Inference system [77] ... 63
Figure 2.20: A Fuzzy inference system (based on Mamdani-type inference ... 67
Figure 2.21: Example of DAG with node description ... 69
xiii
Figure 2.23: Probability for the node A under three different condition: (a) No evidence to support B and C, (b) Evidence supports, “C is True”, and (C) Evidence
supports, “both B and C are True” ... 73
Figure 2.24: Transformation of a simple argument to confidence network as illustrated by Guiochet et al. [93] ... 75
Figure 2.25: Transforming GSN network to Confidence network [93]... 76
Figure 2.26: Illustration of ACP as presented by Hawkins et. al. [94] ... 77
Figure 3.1: Illustration of the process of M & S (for a Thermal-hydraulic code) ... 80
Figure 3.2: Illustration of verification, validation, sources of error and scaling ... 83
Figure 3.3: Code validation process and related activities ... 85
Figure 3.4: Code verification process and related activities ... 86
Figure 3.5: Formalizing the decision model for code prediction ... 88
Figure 3.6: Preprocessing requirement for development of the framework for PCMQ ... 90
Figure 3.7: Conceptual Outline of the framework for PCMQ ... 91
Figure 3.8: Illustration of three pyramid approach for code validation ... 93
Figure 3.9: Knowledge and Importance indicator used in GSN ... 96
Figure 3.10: Priority Indicator used in GSN ... 97
Figure 3.11: Example of using GSN for Validation ... 97
Figure 3.12: Modular GSN extension ... 99
Figure 3.13: Illustration of information abstraction in PIRT/ phenomenology pyramid (PP).... 100
Figure 3.14: Document extraction and hyperlink functionality in ASCE 4 ... 101
Figure 3.15: Process quality assurance factors related to PIRT/phenomenology pyramid(PP) ... 107
Figure 3.16: Bayesian network with J nodes to illustrate CPT computation ... 115
Figure 3.17: Bayesian network with multiple nodes in hierarchy ... 116
xiv
Figure 3.19: Illustration example for the Bayesian network with single evidence to support
the attributes ... 119
Figure 3.20: Estimation of marginal probability distribution for evidence node with multiple evidence ... 120
Figure 3.21: Illustration example for the Bayesian network with multiple evidence to support the attributes ... 122
Figure 3.22: Reduced GSN network Bayesian network for phenomenology pyramid (PP) ... 124
Figure 4.1: Decision model for validation assessment of Multiphysics CASL code (VERA) for DNB ... 130
Figure 4.2: Phenomenology pyramid ... 134
Figure 4.3: Reduced GSN network for the phenomenology pyramid (PP) ... 135
Figure 4.4: Probability distribution of VTR for TM (SPF) ... 149
Figure 4.5: Decision model for validation assessment of CTF for DNB (Main module D1) ... 150
Figure 4.6: Module for data uncertainty assessment (DUA) of CTF, Module: D1.1 (DUA_CTF), corresponding to Away goal: 1.1.1.1 in decision module for validation of CTF (Figure 4.5) ... 151
Figure 4.7: Module for physics scaling assessment (PSA) of CTF, Module: D1.2 (PSA_CTF), corresponding to Away goal: 1.1.1.2.1 in decision module for validation of CTF (Figure 4.5) ... 152
Figure 4.8: Module for data relevance assessment (DRA) of CTF, Module: D1.3 (DRA_CTF), corresponding to Away goal: 1.1.1.2.2 in decision module for validation of CTF (Figure 4.5) ... 153
Figure 4.9: Module for data coverage assessment (DCA) of CTF, Module: D1.4 (DCA_CTF), corresponding to Away goal: 1.1.2.1 in decision module for validation of CTF (Figure 4.5) ... 154
Figure 4.10: Module for assessment of validation test result (VTR) of CTF, Module: D1.5 (VTR_CTF), corresponding to Away goal: 1.1.2.2 in decision module for validation of CTF (Figure 4.5) ... 155
xv
Figure 4.12: Module for PQA for validation evidence assessment, Module: D1.7 (PSA_VEA), corresponding to Away goal: 1.2.1 in decision module for
validation of CTF (Figure 4.5) ... 157
Figure 4.13: Data uncertainty assessment (DUA) for CTF using the Bayesian network (Achieved) based on GSN module in Figure 4.6 ... 158
Figure 4.14: Physics scaling assessment (PSA) of CTF using the Bayesian network (Achieved) based on GSN module in Figure 4.7 ... 159
Figure 4.15: Data relevance assessment (DRA) of CTF using the Bayesian network (Achieved) based on GSN module in Figure 4.8 ... 160
Figure 4.16: Data coverage assessment (DCA) of CTF using the Bayesian network (Achieved) based on GSN module in Figure 4.9 ... 161
Figure 4.17: Assessment of validation test result (VTR) using the Bayesian network (Achieved) based on GSN module in Figure 4.10 ... 162
Figure 4.18: Process quality assurance (PQA) for phenomenology pyramid using the Bayesian network (achieved) based on GSN module in Figure 4.11 ... 163
Figure 4.19: Process quality assurance (PQA) for phenomenology pyramid using the Bayesian network (Target) based on GSN module in Figure 4.11 ... 164
Figure 4.20: Process quality assurance (PQA) for validation evidence assessment (VEA) process (Achieved ) based on GSN module in Figure 4.12 ... 165
Figure 4.21: Process quality assurance (PQA) for validation evidence assessment (VEA) process (Target) based on GSN module in Figure 4.12 ... 166
Figure 4.22: Validation assessment for CTF using the Bayesian network (Achieved) based on GSN module in Figure 4.5 ... 167
Figure 4.23: Validation assessment of CTF using the Bayesian network (Target) based on GSN module in Figure 4.5 ... 168
Figure 5.1: GSN tree for CIPS-Phenomenology Pyramid (CIPS-PP) ... 180
Figure 5.2: GSN tree for CIPS- phenomenology pyramid (showing only Top goal and sub-goals) ... 181
Figure 5.3: Decomposition of sub-goal - G 1.1 (in CIPS- phenomenology pyramid)... 182
Figure 5.4: Decomposition of sub-goal G 1.1.1 (in CIPS- phenomenology pyramid) ... 183
Figure 5.5: Decomposition of sub-goal G 1.2 (in CIPS- phenomenology pyramid) ... 184
xvi
Figure 5.7: Decomposition of sub-goal G 1.3.2.2.1 (in CIPS- phenomenology pyramid) ... 186
Figure 5.8: Decomposition of sub-goal G 1.4 (in CIPS- phenomenology pyramid) ... 187
Figure 5.9: Main decision module for maturity assessment of CASL codes for CIPS challenge problem ... 192
Figure 5.10: GSN module for maturity assessment of Neutronics code, corresponding to Away goal 1.1.1.1 in the main decision module shown in Figure 5.9 ... 193
Figure 5.11: Module for PQA of phenomenology pyramid, corresponding to Away goal 1.2.1 in the main decision module shown in Figure 5.9 ... 194
Figure 5.12: Module for PQA of evidence assessment process, corresponding to Away goal 1.2.2 in the main decision module shown in Figure 5.9 ... 195
Figure 5.13: Bayesian network corresponding to the GSN module for Neutronic code in Figure 5.10 (Achieved) ... 196
Figure 5.14: Bayesian network corresponding to the GSN module for Neutronic code in Figure 5.10 (Target) ... 197
Figure 5.15: Bayesian network corresponding to the GSN module for the PQA of phenomenology pyramid (PP) in Figure 5.11 (Achieved) ... 198
Figure 5.16: Bayesian network corresponding to the GSN module for the PQA of phenomenology pyramid (PP) in Figure 5.11 (Target) ... 199
Figure 5.17: Bayesian network corresponding to the GSN module for the PQA of evidence assessment process (EAP) in Figure 5.12 (Achieved) ... 200
Figure 5.18: Bayesian network corresponding to the GSN module for the PQA of evidence assessment process (EAP) in Figure 5.12 (Target) ... 201
Figure 5.19: Bayesian network corresponding to the main module in Figure 5.9 (Achieved) ... 202
Figure 5.20: Bayesian network corresponding to the main module in Figure 5.9 (Target) ... 203
Figure 6.1: Impact of uncertainty in attributes... 209
Figure 6.2: Sensitivity analysis for the Bayesian network in Figure 6.1 ... 210
Figure 6.3: Bayesian network with different weight factors... 211
Figure 6.4: Sensitivity analysis for the Bayesian network in Figure 6.3 ... 211
xvii
Figure 6.6: Sensitivity analysis for the Bayesian network in Figure 6.5 ... 213
Figure 6.7: Sensitivity analysis of the decision module in Figure 4.23 ... 214
Figure 6.8: Tornado graph for grade ‘0’ for maturity of CASL codes (G1) in Figure 5.19 .... 215
Figure 6.9: Tornado graph for grade ‘1’ for maturity of CASL codes (G1) in Figure 5.19 .... 216
Figure 6.10: Tornado graph for grade ‘2’ for maturity of CASL codes (G1) in Figure 5.19 .... 216
Figure 6.11: Tornado graph for grade ‘3’ for maturity of CASL codes (G1)in Figure 5.19 ... 217
xviii
LIST OF ACRONYMS
AHP Analytic Hierarchy Process
AIAA American Institute of Aeronautics and Astronautics
ASCE Assurance and Safety Case Environment
BC Boiling Condition
CAE Claim Argument and Evidence
CAS Credibility Assessment Scale
CASL Consortium for Advanced Simulation of Light Water Reactors
CDF Cumulative Density Function
CF Cross Flow
CFD Computational Fluid Dynamics
CHF Critical Heat Flux
COBRA-TF/CTF Coolant-Boiling in Rod Arrays-Two Fluids code
CP Challenge Problem
CSAU Code Scaling, Applicability, and Uncertainty
CVER Specifier for Code Verification in PCMM
DBA Design Basis Accident
DNB Departure from Nucleate Boiling
DCA Data Coverage Assessment
DGA Deterministic and Graphical Assessment
DP Data pyramid (experiments-based)
DRA Data Relevance Assessment
DUA Data Uncertainty Assessment
DVA Direct Validation Attribute
EAP Evidence Assessment Process
EM Evaluation model
EMDAP Evaluation Model Development and Assessment Process
FOM Figure of Merit
FP Fuel Performance
FR Flow Regime
FRM Flow Redistribution Mechanism
GSN Goal Structuring Notation
HLC High Level Composition
IA Initial-author Assessment
IAEA International Atomic Energy Agency
ICME Integrated Computational Materials Engineering
IET Integral Effect Test
LBLOCA Large Break Loss of Coolant Accident
LLC Low Level Composition
LOCA Loss of Coolant Accident
LWR Light Water Reactor
MET Mixed Effect Test
NA Not Available
NASA National Aeronautics and Space Administration
xix
NC Natural Circulation
NPP Nuclear Power Plant
NRC Nuclear Regulatory Commission
PA Peer-reviewed Assess
PCMM Predictive Capability Maturity Model
PD Pressure Drop
PE Point Estimate
PIRT Phenomena Identification and Ranking Table
PM Model pyramid (code-based)
PMMF Physics and Material Model Fidelity (a PCMM attribute)
PMO Plant Measurement and Observations
PNNL Pacific Northwest National Laboratory
PP Phenomenology Pyramid
PQA Process Quality Assurance
PSA Physics Scaling Assessment
PVM Probabilistic Validation Metric
QOI Quantity of Interest
QPIRT Quantitative Phenomena Identification and Ranking Process
RGF Representation and Geometric Fidelity (a PCMM attribute)
SA Specialist-author Assessment
SBLOCA Small Break Loss of Coolant Accident
SD Scale distortion
SDG Selective Dimensionless Groups
SET Separate Effect Test
SM Scaling Methodology
SME Subject Matter Expert
SPF Single Phase Flow
SQA Software Quality Assurance
SRQ System Response Quantity
SVER Specifier for Solution Verification in PCMM
TBA To Be Assessed
TH Thermal-Hydraulics
TM Turbulent Mixing
TPF Two Phase Flow
UQ Uncertainty Quantification
US United States of America
V&V Verification and Validation
VAL Specifier for Model Validation in PCMM
VEA Validation Evidence Assessment
VP Validation Pyramid
VTR Validation Test Results
1
CHAPTER 1: INTRODUCTION
Motivation
Over the past 30 years, the role of M & S tools in the decisions related to design, operation
and safety assessment of nuclear power plants have increased at an astounding rate. Computational
tools are widely used in nuclear engineering to quantify and characterize the safety margins,
perform hazard and fault analysis, and improve the performance of nuclear reactors. Therefore,
comprehensive methodologies and systematic processes have been developed, adopted, and
applied to guide the development of M & S tools and assess their adequacy for applications in
nuclear reactor design, operation or safety analysis.
The design of an M & S tool involves three major phases: complexity resolution, model
formulation, and numerical simulation. Each phase of development of the computational tool can
be associated with different sources of uncertainty (aleatoric and epistemic). These uncertainties
directly impact the code’s prediction of the system response quantity of interest. Verification,
validation, and uncertainty quantification (VVUQ) are three key processes that help in assessing
the reliability of the code prediction for an intended application. Different field of science and
engineering developed their own procedures and guidelines for V &V of M & S tools. Remarkable
are the Code Scaling, Applicability, and Uncertainty (CSAU) methodology [1], and the Evaluation
Model Development and Assessment Process (EMDAP) [2] developed by the U.S. Nuclear
Regulatory Commission (NRC). In parallel, nuclear security, defense, and aerospace communities
also made efforts in the development of assessment methodology (e.g., Quantification of Margins
and Uncertainties, QMU; Predictive Capability Maturity Model, PCMM [3]; NASA Standard for
Models and Simulations [4], AIAA CFD V&V Guide [5], etc.) Depending on the intended
2
(VVUQ) process have some differences in these methodologies. However, the philosophy of all
the standards and methodologies is inherently the same.
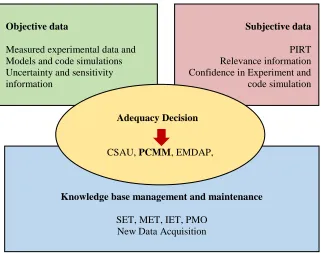
Based on the nature of information, the reliability of a computational tool for a given
decision problem is governed by two set of information or data: Subjective information and
objective information. Subjective information includes phenomena identification and ranking
process, experiment’s relevance information and expert’s confidence in the quality of experiment
and code simulation. Objective information is based on experiments (available for validation),
models and code simulation, and their uncertainty and sensitivity information (see Figure 1.1 for
basic illustration).
Subjectivism is eminent in the development and reliability assessment of M & S tools
because of the approximate nature of model and data. The situation further complicates due to
complex multiscale and multi-physics interactions in nuclear reactor systems. Therefore, the
central question of concern in all methodologies is the “adequacy decision” or “fitness of purpose”
of the M & S tools. Even though comprehensive methodologies and assessment procedures have
been developed to guide the assessment of computational tools, in the end, the “adequacy decision”
is still left to engineering judgment. This heuristic approach to adequacy assessment often turns
code licensing into an elongated process of extensive review and scrutiny. These challenges and
difficulties motivate us to develop a systematic, formalized and computerized framework that can
assist the current assessment methodology (PCMM) in the decision regarding the adequacy of a
3
Figure 1.1: Illustration of code adequacy assessment
Dissertation overview
1.2.1.Objectives
Code V& V (for nuclear reactor applications) can be described as a confidence-building
process. It is an iterative process that requires continuous exploration, learning, and assessment. A
successful VVUQ process should address all sources of uncertainty and provide sufficient
evidence for reliable and robust decision making. The target of the proposed work is to formalize
the maturity assessment process and support the implementation of PCMM by providing a
framework for structural knowledge representation, evidence incorporation, and maturity
quantification. The principal objectives of the proposed research are as follows:
• Facilitate structural knowledge representation, information abstraction, and integration
for maturity assessment of a code. Objective data
Measured experimental data and Models and code simulations Uncertainty and sensitivity information
Subjective data PIRT Relevance information Confidence in Experiment and code simulation
Knowledge base management and maintenance
SET, MET, IET, PMO New Data Acquisition Adequacy Decision
4
• Provide support for structural organization, classification, and characterization of
evidence for code’s maturity assessment (primary focus→ code validation assessment).
• Create a formal decision model for code maturity assessment (primary focus→ code
validation assessment).
• Facilitate confidence assessment, estimation, and sensitivity analysis using the decision
model.
• Complete the framework for predictive capability maturity assessment (PCMA).
• Demonstrate the use of the proposed framework for the maturity assessment of a
computational tool (CTF) for an intended application (CASL challenge
problems-DNB).
1.2.2.Technical approach
This section describes the technical approach adopted to develop the framework for
predictive capability maturity assessment. The key points encompassing the technical approach
are described below:
• The current standard and methodologies for credibility assessment in Nuclear engineering,
i.e. CSAU [1], EMDAP [2] and PCMM [3], are used to guide the formulation of the
proposed framework.
• Structural knowledge representation in the framework is obtained using an argument
modeling technique called Goal structuring notation (GSN) [6]. The PIRT-based
phenomenology pyramid is used to guide the classification and characterization of
evidence for code validation assessment. The Pyramid is constructed using the GSN.
• The decision schema in the proposed framework is based on the PCMM [3] and the
5
using the GSN. The number of levels in the hierarchy depends upon the required depth and
rigor of the analysis. Each attribute and sub-attribute in the decision model is formulated
as a claim (i.e. Goals nodes in the GSN tree) where the degree of validity of the claim is
defined by different maturity levels. Evidence are integrated across the lower level attribute
in the decision model (using the solution nodes in the GSN tree).
• The GSN based decision model is transformed into a confidence network (Bayesian
network) for quantitative maturity assessment. Bayesian network enable abstraction of
maturity information from lower level attribute to higher level attributes. It helps in
assessing the maturity based on the quality of evidence integrated in the decision model.
Subjective data based on the expert opinion is incorporated in to the decision model using
condition probability table (CPT) and subjective probabilities based on the criteria of
evaluation of the evidence.
• A metric based on the expected utility of the maturity levels is proposed to evaluate the
distance between the target level and achieved level of maturity on a scale of 0 to 1 for
each attribute and sub-attribute in the decision model.
1.2.3.Dissertation structure
The current chapter describes the motivation, objectives and technical approach of the
proposed research. It also provides a glossary of important terminologies used in this thesis. The
organization of the rest of the thesis is as follows.
Chapter 2 of the dissertation documents a comprehensive review of different topics that
provide necessary background and foundation for the development of the assessment framework.
This chapter consists of eight sections. The first section focuses on complexity resolution and the
6
standards for credibility assessment in the M & S tools. The third section discusses the decision
process and decision analysis. The fourth section provides a brief overview of CASL codes and
activities. The fifth section gives an overview of the scaling techniques and describes the
importance of scaling in model development and data applicability analysis. The sixth section is
focused on safety case, argumentation and use of Goal Structuring Notation (GSN) in safety case
representation. The seventh section provides a review and brief illustration of different techniques,
like Fuzzy logic [8], Bayesian networks [9], and Evidential reasoning [10] that can be employed
for quantitative maturity assessment. The last section in this chapter illustrate the current
techniques used for transforming GSN into a computable network.
The first section of Chapter 3 provides an overview of the process of code development,
verification, and validation. The second section illustrates the research approach for formalizing
the maturity assessment process in the proposed framework. The third section of this chapter is
devoted to the formulation of the proposed framework. It provides explanation and simple
illustration of each element of the framework. The framework consists of different elements
including structured knowledge representation, evidence classification and characterization, and
quantitative maturity assessment. As the primary focus of the framework is code validation, all the
elements of the framework are illustrated from the perspective of code validation assessment.
Chapter 4 and chapter 5 provide case studies to illustrate the application of the proposed
framework. The case study in chapter 4 is based on validation assessment of CTF for a CASL
challenge problem called Departure from Nucleate Boiling (DNB). The case study in chapter 5 is
based on the assessment of multiphysics CASL codes for another CASL challenge problem called
7
Chapter 6 provides the analysis of the proposed framework based on the different sources
of uncertainty and sensitivity analysis of nodes in the decision model.
Chapter 7 provides conclusion and recommendation for future work.
Glossary
This section presents a list of important definition or terminologies that are frequently used
in this dissertation:
• Aleatory uncertainty: Uncertainty attributed to the inherent randomness in the system
parameters. It is irreducible in nature (or stochastic) and characterized by statistical distribution
or probability density function.
• Benchmarking: It is also part of software quality check. Benchmarking is performed by
code-to-code comparison. It involves comparison of simulation of an identical problem on different
simulation codes.
• Bottom-up approach: The process of combining the smaller block of the system, starting from
the base element to form components and subsystem until the complete representation of the
system is obtained.
• Code Verification: The process of agglomerating the evidence to evaluate the assertion (or
claim) that the numerical algorithms are implemented correctly inside the code [11].Code
verification is focused on,
o Debugging the source code
o Eliminating errors in the numerical algorithm.
• Epistemic uncertainty: Uncertainty attributed to the lack of knowledge about the system, e.g.,
8
model form (i.e., model form uncertainty). It is characterized by subjective probabilities, or
interval estimation (min, max).
• Figure of merit: The figure of merit are those quantitative standards of acceptance that are used
to define acceptable answer for the safety analysis or performance evaluation of the specified
nuclear reactor safety or engineering application using the M & S tool [2].
• Goal Structuring Notation (GSN): The Goal Structuring notation is an argument modeling
technique. It is used for graphical representation of assurance arguments in the safety case. It
was developed by Kelly [6].
• Integral Effect Test (IET): Integral Effect Tests are experiments that involve measurement of
integral parameters that encompass the effect of multiple phenomena affecting the system
behaviour.
• Model form uncertainty: Uncertainty associated with the choice of a suitable (closest to reality)
model from a set of candidate models for emulating a physical quantity.
• Model parameter uncertainty: Model parameter uncertainty is the model uncertainty that arises
due to uncertainty in the values of the model parameters, It could be aleatory or epistemic. For
example, parameters that can be calibrated to experimental data (e.g., closure parameters)
would be considered epistemic, while manufacturing uncertainties would be considered
aleatory.
• Phenomena/complexity resolution: The process of resolving the complexity of the system by
segregating the relevant phenomena or processes that happen in the system during a specified
9
• Regression testing: It is a type of software quality check (part of Verification) which verifies
that the code did not’ underwent any unintended change due to any modification in the source
code.
• Safety case: The U.K. Defense Standard 00-56 describe the safety case as, “a structured
argument, supported by a body of evidence that provides a compelling, comprehensive and valid case that a system is safe for a given application in a given environment” [12].
• Scaling Analysis: The process of assessing the similarity between the reduced scale test facility
and the full-scale nuclear reactor application.
• Scale distortion (SD): Scale distortion can be described as the inefficiency in reproducing the
full-scale reactor level phenomena and process in the reduced scale test facility. Different
methodologies have been adopted to quantify the scaling distortion. The classical
similarity-theoretic method evaluates the scale distortion by comparison of dimensionless scaling groups
[13] at the referenced plant level and the scaled experiment level. In the case of dynamic
processes or transients, scaling distortion is obtained by the ratios of time [14] or effect metrics
[15] of the dominant process in the reactor application and the scaled experiment.
• Separate Effect Test (SET): Separate Effect Tests are simple experiments involving
measurement of local phenomenon influencing the behaviour of the system.
• Solution verification: The process of agglomerating the evidence to evaluate the assertion (or
claim) that the solution to the mathematical functions represented in the simulation is correct
(or correct enough) when compared with the true solution of those same functions [11].
Generally, comparison to the analytical solution is considered part of code verification.
10
• Top-down approach: Decomposition of a complex system into sub-systems, components and
so on, until the base elements at the bottom level are determined.
• Uncertainty quantification: The process of agglomerating the evidence that supports the
assumption that the statistical variability in the system response quantities (SRQs) of interest
due to variation in the input quantities has been adequately captured [11].
• Unit Testing: Units test are part of software quality check (part of Verification). They involve
simple test problems to check if small parts or units of the code are working correctly.
• Validation: The process of agglomerating the evidence to evaluate the assertion (or claim) that
11
CHAPTER 2: TECHNICAL COMPONENTS BACKGROUND
Introduction
This chapter presents review and perspective on different topics that provide necessary
background and foundation for the development of the proposed work. The section is divided into
eight parts:
• Complexity resolution
• Standards and methodologies for credibility assessment of M & S tools
• Decision analysis and decision process
• CASL M & S activities
• Scaling techniques
• Safety case, and argumentation
• Candidate tools/techniques for maturity quantification
• Transforming GSN to computable network
Complexity resolution
Complexity is eminent in nature everywhere. Analysis and understanding of a complex
system require segregation of system into less intricate parts or sub-systems with distinctive form
or characteristic. Herbert A. Simon in his classic paper on “the architecture of complexity” describes how different complex systems exhibit hierarchical structure and similar properties (in
the context of architecture or structural organization) regardless of their specific content [16]. He
explains that two types of interactions are eminent in a hierarchical system: (1) Interactions within
12
linkage). It is the nature of these interactions that guide the decomposition of a complex system.
A complex system can be considered nearly decomposable when interactions among subsystem
are feeble in strength compared to interactions within subsystem [16].
Phenomenon Identification and Ranking Process is a crucial technique to resolve
complexity in the modeling and simulation of complex nuclear reactor applications. It was
introduced as part of the Code Scaling, Applicability, and Uncertainty (CSAU) methodology in
1988. Over the past thirty years, it has been successfully applied to resolve several issues, like
LBLOCA [1], SBLOCA [17], nuclear power plant fire modeling[18], analysis of CASL challenge
problems [19, 20] and design of next-generation nuclear power plants [21]. The PIRT process is
based on the subjective data (expert knowledge) and created by joint consensus of a panel of
experts having broad understanding and knowledge of the underlying physical processes
governing the problem of interest. It involves identification and ranking of different phenomena
relevant to the figure of merit [2].
Simon describes two types of descriptors that can be used for solving a problem involving
a complex system. These descriptors are called state descriptor and process descriptor. A state
descriptor provides criteria for identifying an object or state of the system while the process descriptors are related to different processes or actions that lead to that particular state of the system. He further explains, “We pose a problem by giving state description of the solution. The
task is to discover a sequence of processes that will produce the goal state from an initial state” [16]. In the context of the PIRT, the figure of merit (FOM) may be considered as a state descriptor
while different phenomena/processes that impact the FOM may be considered as process
descriptors. Understanding the sequence and relation of different phenomena becomes crucial for
13
being analyzed. The PIRT for accident situations like loss of coolant accidents (LOCA), resolves
complexity by dividing the transient scenario into time phases (blowdown, refill and reflood) based
on the dominant mechanism or some other factors (operators action or valve opening and closing).
The phenomena identified by the PIRT process are arranged hierarchically based on transient
phase, system components, and underlying phenomena. The PIRT for simulation of high fidelity
CASL challenge problems involves system decomposition with respect to governing physics
(Neutronics, Fuel performance, Coolant chemistry and thermal hydraulics) and scale (micro-scale,
meso-scale and macro-scale) of the underlying phenomena. Hence, scale separation and physics
decoupling are the two elementary principles that guide complexity resolution for CASL
Challenge problems. The outcome of PIRT process is governed by the experts’ knowledge and
understanding about the problem of interest. Therefore, PIRT is subject to large epistemic
uncertainty.
In recent years, objective approaches based on scaling analysis like Hierarchical
Two-Tiered Scaling (H2TS) and Fractional Scaling Analysis (FSA) have been used to construct
Quantitative Phenomena Identification and Ranking Table (QPIRT). Sensitivity analysis of
response quantity of interest with respect to the relevant input parameters or boundary and initial
condition is also used for creating a QPIRT. Although these approaches sound more robust and
efficient, a QPIRT is completely based on the mathematical model of the problem of interest.
Therefore, it cannot be directly applied to cases where the mathematical model is inexistent or
under-developed with respect to the intended application. For such cases, traditional PIRT is
employed for the conception of governing mechanism and underlying physical processes
14
this way, PIRT helps in prioritizing the research and development needs for any nuclear reactor
application. Major steps related to the PIRT process are shown below [22]:
• Define the problem and PIRT objectives.
• Specify the scenario (transient or steady state). In the case of a transient process, the
scenario is partitioned into time phases based on the dominant process/mechanism.
• Identify and define the figure of merit (FOM).
• Identify and review all the relevant literature (experimental and analytical data).
• Identify phenomena relevant to the FOM.
• Rank all the Phenomena based on knowledge and importance (with respect to the
FOM).
• Document all the findings.
The “Phenomena” in the PIRT process is treated as a general entity and can be anything
that impacts the FOM. It equivocally includes mathematical or engineering approximations,
system conditions, physical processes, reactor parameters as phenomena in the PIRT process [23].
Such simplification affects proper structuring of information. Therefore, a systematic approach is
required to formalize the PIRT process where we can clearly state the objective, assumptions,
strategy for complexity resolution and specify the theoretical and experimental evidence that forms
the basis of the expert input to the PIRT.
“Human mind is not capable of considering all the factors and their effects
simultaneously”[24]. Therefore, the organization of knowledge and information in a proper
structure becomes essential to render our ability to make a rational decision in a scenario of
uncertainty and lack of information. Hierarchical structure provides organization of information
15
solution to complex problems involving multiple criteria decision-making situations. Saaty
introduced “TheAnalytic Hierarchy Process” (AHP) [7] to provide techniques for identifying the
relevant information and their interrelationship in a complex problem. He emphasizes that
“conception of reality is crucial” and hierarchical decomposition is valuable in the analysis of
problems where “subjective, abstract or nonquantifiable criteria” are eminent in the decision [24]. PCMM is another example that illustrates the use of hierarchical approach for resolving decision
concerning the reliability of a modeling and simulation tool for an intended application [25] [11].
Hierarchical decomposition is also eminent in the code validation process in the form of validation
pyramid. Due to lack of data for validation, the experimental data is organized hierarchically in
order of increasing relevance and complexity with respect to the application of interest. The
concept of validation pyramid was introduced by AIAA V & V guide for CFD simulation
concerning aerospace applications [5]. CASL extended the application of validation pyramid to
multiphysics and multiscale challenge problem by adopting component identification and ranking
process[26].
Standards and methodologies for credibility assessment of M & S tools
This section presents a review of different methodologies/standards that have been
developed to provide systematic procedures and standard guidelines for comprehensive adequacy
assessment of a computational code for an intended use. Although procedures and guidelines in
each methodology have some differences depending on the features of M & S tool and their
intended use, in the core all the methodologies address similar issues related to verification,
validation and uncertainty quantification (VVUQ) of the computational codes. We will start our
16
[1] that was developed by the U. S. Nuclear Regulatory Commission in the late 1980’s for reliable
estimation of reactor safety margins.
2.3.1.Code Scaling, Applicability, and Uncertainty (CSAU) evaluation methodology
In 1998 US NRC introduced the revised emergency core cooling system rule (ECCS rule,
10CFR50) which consist of limiting values of different response quantities of interest (peak clad
temperature, oxidation, hydrogen generation, coolable geometry, long-term cooling) that could be
used as safety criteria. These rules were introduced to enable the use of computational tools for
safety analysis using best estimate plus uncertainty approach. To assess the reliability of
computational results, CSAU methodology was developed. It consists of a set of rules
(procedure/guideline) to assess and improve a code’s predictive capability and assure low
probability of violating the safety criteria.
The CSAU methodology was described by three major elements [27]:
• Requirements and code capability,
• Assessment and ranging of parameters,
• Sensitivity and uncertainty analysis.
The first element involves specification of the scenario to be modeled along with the
nuclear power plant type, code specification, and phenomena resolution using the PIRT. The
second element of CSAU is focused on validation. It involves identification of relevant separate
effect tests (SETs) and integral effect tests (IETs) for validation of code. Based on the SETs and
IETs, an assessment matrix is created for validation. CSAU emphasizes the assessment of code’s
scale-up capability. Code scale-up capability is assessed based on simulation of different reduced
scale test facilities. As CSAU focusses on system codes, plant nodalization is considered as a
17
sensitivity analysis and uncertainty quantification. This step combines the total bias and
uncertainty due to all sources to obtain a quantitative estimate of the plant safety margin for the
specified transient in the specified nuclear power plant. CSAU uses the response surface method
to estimate the overall uncertainties in the prediction of the FOM. Response surface for the FOM
is created by varying all the relevant input parameters within their range of uncertainty. Based on
the variability of the FOM a PDF is obtained which gives a measure of total uncertainty in the
FOM due to all the parameters. As there are obvious limitations in the code (model uncertainty)
and data used for validation, an additional margin is added to compensate for the lack of knowledge
and information (epistemic uncertainty).
2.3.2.Evaluation Model Development and Assessment Process
In 2005, U.S. Nuclear Regulatory Commission introduced the Evaluation Model
Development and Assessment Process [2] to guide development and assessment of evaluation
models (M & S tool) for analysis of transient and accident scenarios that comes within the design
basis of a nuclear power plant. The EMDAP process consists of four major elements as shown in
Figure 2.1. Although CSAU was primarily developed for safety margin characterization (total
uncertainty in prediction), the concepts employed to accomplish this task encompass the entire
Evaluation Model Development and Assessment Process (EMDAP). One distinctive feature of the
EMDAP is the high focus on hierarchical system analysis and scalability analysis for data and code
(Figure 2.1).
EMDAP also emphasizes that “the complexity of the problem should determine the level
of detail needed to develop and assess an EM.” [2]. Processes and phenomena that acquire higher
rank in the PIRT require higher model fidelity or higher level of detail. EMDAP recommends
18
fields, and process that are required to be modeled. EMDAP terminates if the decision regarding
the adequacy of the code for the intended application is answered in affirmative. If the decision is
negative, the process of assessment and improvement is continuously repeated until the adequacy
decision becomes positive. The adequacy decision is taken based on the fulfilment of all the
requirements put forward by the EMDAP. Although EMDAP does not specify clear criteria for
making the adequacy decision, it does recommend formulation of questions that form the basis
for the decision. However, the question regarding the adequacy is still governed by engineering
judgment or expert’s opinion regarding the fulfillment of all the steps mentioned in the EMDAP.
CSAU and EMDAP both highlight the importance of VVUQ in the code licensing process.
Both EMDAP and CSAU are focused on credibility assessment of computer codes used
for nuclear reactor safety-related application. A standard for the verification and validation of
non-safety-related codes for the nuclear reactor application was developed by American Nuclear
19
Figure 2.1: Evaluation Model Development and Assessment Process [2]
2.3.3.Contemporary standards for verification and validation of computer codes
Parallel to Nuclear Engineering, U.S. Department of Defense, American Institute of
Aeronautics and Astronautics (AIAA), National Aeronautics and Space Administration (NASA)
and American Society of Mechanical Engineers (ASME) also developed standards for V & V of Hierarchical system
decomposition Element 1
Establish Requirement for Evaluation Model Capability 1. Specify analysis purpose, transient class, and power plant class 2. Specify figure of merit
3. Identify systems, components, phases, geometries, fields, and processes that should be modeled
4. Identify and rank phenomena and processes
Element 2 Develop Assessment Base 5. Specify objective for assessment base 6. Perform scaling analysis and identify
similarity criteria
7. Identify existing data and/or perform IETs and SETs to complete data/base 8. Evaluate effects of IET distortions and
SET scaleup capability
9.Determine experimental uncertainties
Element 3 Develop Evaluation model 10. Establish EM development plan 11. Establish EM structure 12. Develop or incorporate closure
models
Adequacy Decision Does code meet adequacy
standard? Closure Relations (Bottom-up)
13. Determine model pedigree and applicability to simulate physical processes
14. Prepare input and perform calculations to assess model fidelity and/or accuracy
15. Assess scalability of models
Integrated EM (Top-down)
16. Determine capability of field equations and numeric solutions to represent processes and phenomena 17. Determine applicability of EM to
simulate system components 18. Prepare input and perform
calculations to assess system interactions and global capability 19. Assess scalability of integrated
calculations and data for distortions Element 4
Assess Evaluation Model Adequacy
20. Determine EM bases and uncertainties
Return to appropriate elements, make and
assess corrections
Perform plant event analyses Hierarchical structure
eminent in Scaling
20
M & S tools. The AIAA V & V guide [5] was focused on CFD simulation concerning aerospace
applications. It introduced the concept of Validation Pyramid (VP) (see Figure 2.2) which involves
assessment of computational tool using three tiers: Subsystem cases, Benchmark cases, and Unit
problems. Complete system lies at the top of the validation pyramid. Complexity and relevance
increase as we move up in the validation pyramid while the data for validation becomes scarce.
The rationale behind the validation pyramid is to test the M & S tool under different degree of
geometric complexity. In the depiction of verification and validation, AIAA guide treats
verification and validation separately. ASME guide for V & V in computational solid mechanics
[29] provides a more comprehensive view of VVUQ process, depicting verification, validation,
and UQ through a single flowchart (see Figure 2.3). At the end of the flowchart, it is determined
if an acceptable agreement exists between measurement and code prediction. If not, appropriate
changes in models and data are implemented, and the process continues till an acceptable
agreement is achieved. Specified accuracy requirement for the SRQs is used as the adequacy
criteria.
Assessment of M & S tool in all the methodologies/ standards is focused on VVUQ of the
M & S tool. However, NASA’s standard for M & S results maturity assessment [4] considers an
additional element termed as secondary evidence (see Figure 2.4) in its Credibility Assessment
Scale (CAS). It includes use history, M& S management and people qualification as key factors
that constitute the secondary evidence in the Credibility Assessment Scale (CAS). The inclusion
21
Figure 2.2: AIAA validation pyramid [5]
Complete System
Subsystem Cases
Benchmark Cases
22
Figure 2.3: ASME Verification and Validation flowchart [29]
Reality of Interest
(Component, Subassembly, Assembly, or System)
Conceptual Model Acceptable Agreement? Mathematical Model Simulation Outcome Experimental Outcome Simulation Result Experimental Design Computational Model Physical Model Experimental Data
Next Reality of Interest in the Hierarchy Abstraction Mathematical Modeling Physical Modeling Yes Validation Experimentation Calculation Implementation Implementation Uncertainty Quantification Uncertainty Quantification Quantitative Comparison Revise Appropriate Model or Experiment No Code Verification Calculation Verification Preliminary Calculations
Modeling Simulation & Experimental Activities
23
Figure 2.4: M & S results credibility assessment scale used by NASA [4]
The decision of acceptability becomes very important depending on the intended use of the
M & S tools. Therefore, all the standards emphasize assessment of M & S tools based on their
“intended use” or “fitness for purpose.” NASA introduced the M & S Influence-Decision
Consequence Risk Matrix (see Figure 2.5) which depicts the M &S results’ influence based on the
decision consequence. It has three regions marked as red, yellow and green. The region in red
indicates the application for which the M & S tool will have the highest impact on the consequence
of the decision. Therefore, for these applications, the assessment criteria for the M & S tool must
be very stringent. The risk matrix is useful in relating M & S influence with decision consequence.
However, it has certain drawbacks [30]:
• It cannot deal with aggregate risk.
• The interaction between risks is not considered.
• Risk matrix does not have the ability to represent uncertainty.
• The tradeoff between likelihood and consequence is fixed.
Use History
M & S Management
People Qualification
Supporting Evidence M & S
Operations M & S
Developments
Input Pedigree
Results uncertainty
Results Robustness Verification Validation
24
Figure 2.5: M & S Influence-Decision Consequence Risk Matrix used by NASA [30]
2.3.4.Predictive capability maturity model and other maturity assessment methodologies
Originated in nuclear defense applications, the Predictive Capability Maturity Model
(PCMM) was developed to assess the maturity of M & S tools based on the decision consequence.
In this regard, PCMM can be considered as a decision model for maturity assessment. PCMM was
developed by SANDIA national laboratories with the focus on computational simulation
concerning nuclear weapon applications. Although PCMM was developed for weapon
applications, the elements of PCMM have a broad scope and can be applied to assess the M & S
capability for any engineering application. CASL adopted PCMM for assessment of Multiphysics
computational tools for different challenge problems related to nuclear reactor operation and safety
[20, 31].
The original PCMM matrix consist of six elements (see Table 2.1 ):
• Representation and geometric fidelity,
• Physics and material model fidelity,
• Code Verification,
25
• Model Validation,
• Uncertainty quantification and sensitivity analysis.
These elements act as decision attributes and forms the basis for the decision regarding the
maturity of a computer simulation code for the intended use. Assessment is performed on the basis
of four maturity levels (see Table 2.2). Categorization of each element into these maturity levels
is based on the qualitative assessment of constitutive factors that describe that element. In this way,
the target level for each element is decided based on the nature of the application of interest. For a
high consequence application, more rigorous and stringent assessment criteria are adopted while
26
Table 2.3 shows detail PCMM matrix with criteria for assessment of different PCMM
element into maturity levels. These criteria provide a qualitative assessment of maturity of the
code. PCMM uses the spreadsheet tool and Kiviat (or radar) plots to depict the maturity (see
Figure 2.6 and Figure 2.7).
The concept of credibility assessment using maturity level is not new. NASA uses the
Technology readiness level (TRL) and credibility assessment level (CAL) (see Table 2.4) while
Integrated Computational Materials Engineering (ICME) V & V guide uses the Tool maturity level
(
![Figure 2.2: AIAA validation pyramid [5]](https://thumb-us.123doks.com/thumbv2/123dok_us/1177867.1148110/43.612.80.386.84.347/figure-aiaa-validation-pyramid.webp)
![Figure 2.7: Radar plot used in PCMM [32]](https://thumb-us.123doks.com/thumbv2/123dok_us/1177867.1148110/51.612.87.533.106.349/figure-radar-plot-used-in-pcmm.webp)
![Figure 2.9: Standard form of decision schema in AHP [35]](https://thumb-us.123doks.com/thumbv2/123dok_us/1177867.1148110/57.612.103.532.263.577/figure-standard-form-decision-schema-ahp.webp)
![Figure 2.10: CASL Validation Pyramid [26]](https://thumb-us.123doks.com/thumbv2/123dok_us/1177867.1148110/61.612.87.520.85.354/figure-casl-validation-pyramid.webp)
![Figure 2.11: System decomposition and hierarchy in H2TS [14]](https://thumb-us.123doks.com/thumbv2/123dok_us/1177867.1148110/67.612.202.421.86.335/figure-decomposition-hierarchy-h-ts.webp)
![Figure 2.12: Components of a safety case [49]](https://thumb-us.123doks.com/thumbv2/123dok_us/1177867.1148110/69.612.183.454.68.295/figure-components-safety-case.webp)
![Figure 2.13: The McDermid Square as presented in the U.K. Defense Standard 00-56 [12]](https://thumb-us.123doks.com/thumbv2/123dok_us/1177867.1148110/71.612.149.464.181.396/figure-mcdermid-square-presented-u-k-defense-standard.webp)
![Figure 2.16: An example of using GSN from GSN community standard [56]](https://thumb-us.123doks.com/thumbv2/123dok_us/1177867.1148110/75.612.85.524.311.594/figure-example-using-gsn-gsn-community-standard.webp)