AN IMPROVED METHOD ON THE CONSTRUCTION OF COMBINED
DESIGN SPECTRUM
Xu Longjun
Associate Professor, Dept. of Civil Engineering, Harbin Institute of Technology at Weihai, Weihai China ([email protected])
ABSTRACT
Design spectrum is the basic criteria for seismic design of engineering structures. Appropriate values of the spectrum are essential for both safety and economical efficiency. To solve the problems caused by the conventional approach, combined design spectrum, relevant parameters and the response spectra are analyzed by using a large range of ground motion data recorded during recent strong earthquakes. The relationships between ground motion amplitudes are reevaluated by a weighed mean method instead of the arithmetic mean, which makes it more reasonable to backcalculate PGV and PGD from PGA; a normalized parameter which is changeable with period (T) is applied in the calibration of the combined design spectrum, thus the asymptotically incorrect behavior caused by three separately fixed parameters (PGA, PGV, PGD) in the calibration of response spectrum is rectified. Then, the accuracy of the proposed procedure is tested by the analysis of the dispersion and validation of ground motion response spectra.
INTRODUCTION
Earthquake load for structure design, is generally based on seismic design spectra(Chopra, 2001). One of the most typical design spectra was proposed by Newmark and Hall (1969), who considered that the spectrum was combined with three sensitive regions: acceleration, velocity and displacement. The Newmark-Hall spectrum has the prominent advantage of showing all three of the response spectral quantities rather than any one of them alone (Chopra, 2001). Although that the Newmark-Hall spectrum is anchored to three ground amplitudes (PGA, PGV, PGD) at different spectral sensitive regions, many implementations of this method used empirical relationships to estimate PGV and PGD from PGA, so in effect the relations between the amplitudes can certainly affect the spectral shape. In addition, the control periods (Ta, Tb, Te, Tf) of spectral shape are fixed, which is incompatible with the fact that the frequency
content varies significantly from one ground motion to another (Mohraz, 1976; Malhotra, 2006). In particular, the spectrum corner periods (Tc, Td) between in acceleration, velocity and displacement
sensitive regions are not unified with the cutoff periods in determining the response amplifications (αA, αV,
αD) (Malhotra, 2006), resulting in inevitable errors in estimating the spectral values.
Many researchers have contributed to the development of the Newmark-Hall spectrum (e.g. Seed,1976; Mohraz, 1976; Malhotra, 2006). Malhotra (2006) proposed an improved method of constructing smooth response spectrum from peak amplitudes of ground acceleration, velocity and displacement, resulting in unfixed control periods and more reliable spectral shape. The Chinese code GB50267-97 (1997) adopts seismic analysis using standard response spectra suggested by Wang and Guo (1993). The Wang-Guo spectrum was derived directly from the analysis results of normalized pseudo-velocity response spectrum. Recently, Xu et. al (2010) suggested bi-normalized spectrum (BNS) approach on the estimate of design spectrum, which considered the characteristics of both normalized and bi-normalized pseudo-velocity spectra.
consecutive combined response spectrum, trying to avoid problems that inherent in the conventional constructing approaches, and to improve the reliability of the scaled design spectral shape.
GROUND MOTIONS
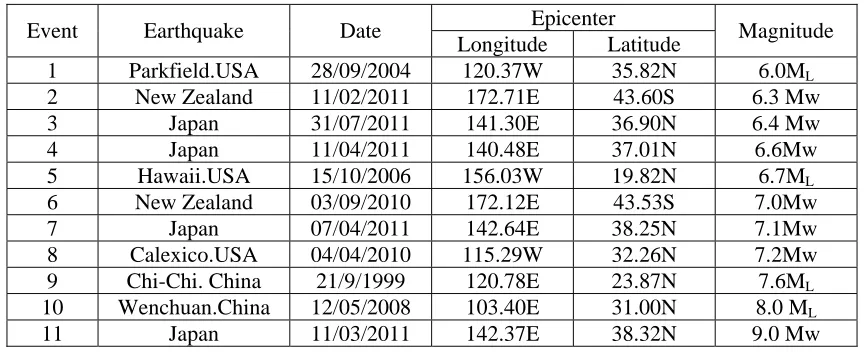
In the study we used the free-field recording data from eleven recent earthquakes with magnitude ranging from M6.0 to 9.0. A list of the events has been given in Table 1. In order to eliminate statistic bias raised from event, ten stations are selected from each earthquake, distance of the recording stations are evenly distributed within 300km from the epicentre, to avoid more influence of the near-fault effect, station motions within 40km of the earthquake are rejected when event magnitude is large than M7.0. Both horizontal components of each selected station are seen as two independent ground motions. There are totally 220 motions involved in the study. In which, 60 motions are from soil sites, 8 motions are recorded on rock sites, the site condition of the rest motions are unknown. Considering that, merely for a methodological study these deficiency in data information are allowable.
These ground motions are high-quality digital accelerometers, which were selected from mainly the strong motion database of the U.S. Geological Survey (USGS) and Coast and Geodetic Survey (CGS), records of the Chi-Chi earthquake came from the strong motion database of the Pacific Earthquake Engineering Research Centre (PEER), and the Wenchuan earthquake recordings were selected from the Chinese Strong Motion Observation Network Center (NSMONS). Most of the ground motions in the database were corrected and processed by a limit filter bandwidth of at least 0.05 to 25Hz.
Table 1: Information of the selected earthquakes
Epicenter
Event Earthquake Date
Longitude Latitude Magnitude
1 Parkfield.USA 28/09/2004 120.37W 35.82N 6.0ML
2 New Zealand 11/02/2011 172.71E 43.60S 6.3 Mw
3 Japan 31/07/2011 141.30E 36.90N 6.4 Mw
4 Japan 11/04/2011 140.48E 37.01N 6.6Mw
5 Hawaii.USA 15/10/2006 156.03W 19.82N 6.7ML
6 New Zealand 03/09/2010 172.12E 43.53S 7.0Mw
7 Japan 07/04/2011 142.64E 38.25N 7.1Mw
8 Calexico.USA 04/04/2010 115.29W 32.26N 7.2Mw
9 Chi-Chi. China 21/9/1999 120.78E 23.87N 7.6ML
10 Wenchuan.China 12/05/2008 103.40E 31.00N 8.0 ML
11 Japan 11/03/2011 142.37E 38.32N 9.0 Mw
NORMALIZED RESPONSE SPECTRUM
Ground motions can vary significantly due to effects of many uncertainty factors, to reflect the general principles ground motion response spectral values are usually scaled by peak ground amplitudes. The normalized response spectrum (NRS), which shows the dynamic amplification quantity to ground motion, is especially useful for defining a design spectrum.
As Newmark and Hall (1969) suggested, a combined design spectrum contains acceleration, velocity and displacement sensitive regions. These regions can be plotted with straight lines on the four-way logarithmic paper by applying response amplifications (αA, αV, αD) to peak ground values (PGA,
PGV, PGD). To show the characteristics of ground motion spectra, the normalized acceleration, velocity and displacement spectra (NRSA, NRSV, NRSD) of the selected 220 motions are computed by considering
that, the NRSA has the lowest discreteness in the low period range (<0.4s), while in the medium (0.4s~3s)
and long period (>3s) ranges, NRSV and NRSD have the lowest discreteness, respectively, implies that the
correlated amplification factors can be reliably estimated from the normalized acceleration, velocity and displacement spectra.
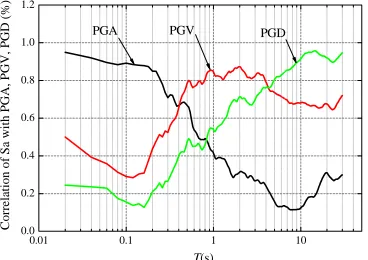
Further analysis is performed to demonstrate the relationship of peak ground amplitudes with response spectra. Figure 2 shows a plot of correlation between spectrum acceleration (Sa) and ground amplitudes. It is observed Sa for periods up to 0.25s correlate best with PGA, those for periods between 0.52s and 3.98s correlate well with PGV, and for periods large than 5.0s correlate well with PGD. This implies that the response spectra can be reliably predicted from PGA, PGV and PGD values.
0.01 0.1 1 10
0.0 0.5 1.0 1.5 2.0
NRSD
NRSV
Coefficien
t of
Variatio
n
T(s)
50
NRSA
Figure 1. Coefficient of variation for ground motion normalized spectra (5% damping)
0.01 0.1 1 10
0.0 0.2 0.4 0.6 0.8 1.0 1.2
Co
rr
ela
tio
n
of
Sa
w
ith
P
G
A
, PG
V
, P
G
D
(%
)
T(s)
PGA PGV PGD
Figure 2. Correlation of spectrum values at various periods with PGA, PGV and PGD
CONSECUTIVE COMBINED SPECTRUM
Figure 3 shows the times histories of ground motion recorded at a substation in the Imperial Valley Irrigation District, El Centro, California, during the Imperial Valley earthquake of 18 May 1940.
The peak ground acceleration, velocity and displacement for the motion are: PGA=3.066 m/s2,
PGV=0.298 m/s and PGD=0.133 m. The consecutive scalar parameter ( fC) is defined as:
⎪ ⎪ ⎩ ⎪ ⎪ ⎨ ⎧
⋅ ⋅
=
T PGD PGV
T PGA
T
fC
π
π
2 2 )
(
VD VD AV
AV
T
T
T
T
T
T
T
≥
<
<
≤
(1)
PGA PGV
TAV =2
π
(2)PGV PGD
TVD =2
π
(3)TAV marks the boundary between the high and medium, and TVD the medium and low frequency regions of
the response spectrum. A plot of the consecutive scalar parameter of the El Centro ground motion has been given in Figure 4(a). If the pseudo-velocity response spectrum values are normalized with respect fC(T), causes the pseudo-spectrum velocity (PSv) to become unity when periods approach to both zero and
long periods, and the PSv to the amplification (PSv/PGV) in the medium period region, then the
consecutive normalized response spectrum (NRSC) is obtained. A comparison of the normalized
consecutive spectrum with three traditional normalized spectra has been given in Figure 4(b). Observing that the consecutive spectrum match well with NRSA, NRSV, and NRSD in the high, medium and low
frequency regions, respectively. The superiority of the consecutive normalized spectrum is that it reflects major amplification quantities in three sensitive regions simultaneously.
0 10 20 30
-0.2 -0.1 0.0 0.1 0.2 40 -0.4 -0.2 0.0 0.2 0.4 -4 -2 0 2 4 PGD=0.133m D isp la ce men t (m) Time (s) PGV=0.298m/s V e lo ci ty ( c m/ s) A c ce le ra ti o n (m /s 2) PGA=3.066m/s2
Figure 3. Acceleration, velocity and displacement time histories of ground motion recorded at El Centro, California, during the Imperial Valley earthquake of 18 May 1940
0.01 0.1 1 10
0.01 0.1 1 TVD TAV PGV P G D .(2 π )/T fC (m /s)
T (s)
PG A. T
/(2
π)
(a)
0.01 0.1 1 10
0.1 1 10 T VD NRS A NRS V NRS D NRS C A m p lif ic a tio n
T (s) T
AV
(b)
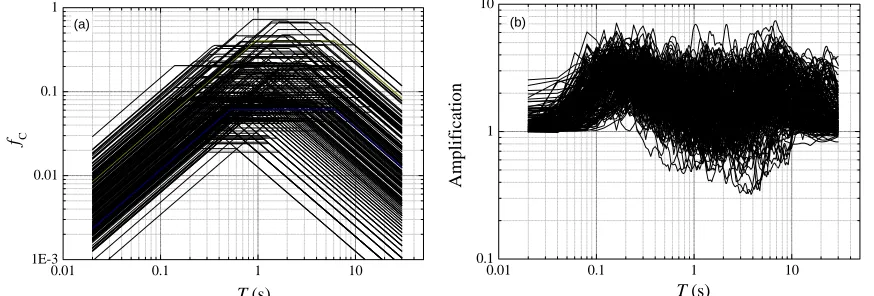
Figure 5(a) shows the normalized parameters (fC) of 220 ground motions. For each motion, fC is
used to normalize the values of the corresponding pseudo-velocity spectra, 220 normalized consecutive spectra are obtained and shown in Figure 5(b).
Figure 6 gives the mean and mean+1std curves of the normalized consecutive spectra together with the computed tradition normalized spectra of the ground motions. It is observed that, the averaged consecutive spectrum exhibits two peaks in the high and low frequency regions. The spectral values are in good agreement with those of the NRSA and NRSD when periods less than 0.16s and/or larger than 6.89s,
respectively. The consecutive spectrum is higher than any other normalized spectra at periods between two peaks. The mean+1std curve for the normalized consecutive spectra has similar behavior with those of the averaged one.
0.01 0.1 1 10
1E-3 0.01 0.1 1
f C
T (s) (a)
0.01 0.1 1 10
0.1 1 10
(b)
Ampl
ificat
ion
T (s)
Figure 5. Normalized parameters and consecutive spectra for all ground motions
0.01 0.1 1 10
0 1 2 3 4
6.89 (a)
A
m
pl
if
icat
io
n
Mean
NRS
A
NRSV NRS
D
NRS
C
T (s)
0.16 0.010 0.1 1 10
1 2 3 4
Mean+Std
NRS
A
NRS
V
NRSD NRS
C
(b)
Am
pl
if
icat
io
n
T (s)
Figure 6. Comparisons of the mean and mean+std spectra for all ground motions
PREDICTION OF GROUND MOTION AMPLITUDES
amplitudes for the selected motions are computed through a weighed mean approach. Statistical weight for different regions has been listed in Table 2.
0.0 0.2 0.4 0.6 0.8 1.0
0 2 4 6 8 10
PG
V (m/s)
PGA (m/s2
)
0.0 0.2 0.4 0.6 0.8 1.0
0.0 0.2 0.4 0.6 0.8 1.0
(b)
PGD (
m
)
PGV (m/s)
PGD=0.563PGV R2=0.749 PGV=0.067PGA
R2
=0.620 (a)
Figure 7. Relationships between in ground motion amplitudes
An example of the relationships of peak ground amplitudes in terms of weighed mean and arithmetic mean have been given in Table 3. The proposed design amplitudes by Newmark and Hall (1982) are also listed in the table. For the same PGA, PGV and PGD estimated by weighted mean operation are about 11 and 22 percent less than those of the arithmetic mean, and are much less than those proposed by Newmark and Hall (1982). The significant difference of predicted PGD will mainly influence the long period spectral values in construction of the design spectrum.
Table 2: Statistical weight for different regions
Region 0~0.05 0.05~0.1 0.1~0.15 0.15~0.2 0.2~0.25 0.25~0.3 0.3~0.65
Counts 69 79 33 16 9 7 7
PGV/PGA
Weight 0.3136 0.3591 0.1500 0.0727 0.0409 0.0318 0.0045
Region 0~5 5~10 10~15 15~20 20~25 25~55
Counts 127 59 18 5 4 7
PGA·PGD/PGV2
Weight 0.5773 0.2682 0.0818 0.0227 0.0182 0.0053
Table 3: Comparison of design ground motion amplitudes
Design amplitudes Arithmetic mean Weighed mean Newmark-Hall (1982)
PGA(m/s2) 9.810 9.810 9.810
PGV(m/s) 0.961 0.853 1.230
PGD(m) 0.614 0.480 0.914
DESIGN SPECTRUM REGARDING COMBINED SPECTRUM
The estimate of ground motion response spectra is to associate the normalized combined spectrum with design ground amplitudes. In the paper, the amplitude ratios calculated by weighted mean method in Table 3 are used to build the response spectrum. For a set of given amplitudes (PGA=1g,
PGV=0.853m/s, and PGD=0.480m), Forms (2) and (3) are used to determine periods TAV, TVD, then the
scalar parameter (fC) is obtained by function (1). We use the mean and mean+1std curves of the
0.01 0.1 1 10 0.01
0.1 1 10
P G
D
PGV
1m
f e d c
b
(a) 50%
Target spectrum Smooth spectrum
PGV (
m
/s
)
T(s)
a
1g
PG
A
0.01 0.1 1 10
0.01 0.1 1 10
(b) 84.1% Target spectrum Smooth spectrum
PG D
PGV
1m
f e d c
b
PG
V
(
m
/s
)
T(s)
a
1g
PG
A
Figure 8. Target spectra and smooth spectra with different nonexceedance probability (50%, 84.1%)
Figure 8 also shows the smooth response spectra (design spectra) combined of fitted straight line segments through the mean and mean+1std target spectrum curves. The spectra are formed of six control periods (a~f) and several lines, straight line fitting used the least-square operation. The procedure to build the design spectra is summarized as:
(1) Ta and Tf are fixed as 0.04 and 20s, respectively. The spectrum values are the real values of the target spectra at these two points.
(2) Tb and Te are the points with the maximum values at the short (acceleration sensitive) and long (displacement sensitive) period ranges, respectively. Smooth spectrum values at b and e were determined by the fitted lines of b-c and d-e.
(3) Tb and Te are computed by forms (5) and (6) by setting Tc=TAV=0.55s, Td=TVD=3.54s. Value
of point c is the mean value of fitted result at the point of b-c and c-d. Similarly, Value of point d is determined by the fitted values of c-d and d-e.
(4) Last, connecting lines a-b-c-d-e-f completes the spectrum.
Table 4 lists the values at the control periods of the design spectra (50% and 84.1% percentile). Noting that, line segments of three sensitive regions of the design spectrum are not parallel to the coordinate axis. Because we believe that the amplification factor is variable with period. This is one of the main differences with previous studies (Newmark and Hall, 1969; Molhotra, 2006).
Table 4: Design spectra values at the control periods
Ta Tb Tc Td Te Tf
Percentile
0.04 0.16 0.55 3.54 6.48 20 50% 0.08 0.76 1.67 1.50 1.01 0.24 84.1% 0.10 1.01 2.31 2.21 1.49 0.33
VALIDATION OF PROPOSED DESIGN SPECTRA
To test the reliability of the proposed procedure, Figure 9 gives the coefficient of variation (COV) for different normalized response spectra of all the selected ground motions. Note that the high and low frequency regions of the COV curve for the combined spectra (NRSC) are aligned well with those of
NRSA and NRSD, respectively. Values of the COV curve of NRSC are less than those of NRSV. The
0.01 0.1 1 10 0.0
0.5 1.0 1.5 2.0 2.5
NRS
A
NRSV
NRSD NRSC
Coef
ficient of
Variatio
n
T(s)
Figure 9. COVs comparison of different normalized response spectra
The spectral ratios of actual response spectra to the smooth spectrum of the selected ground motions were calculated. Figure 10(a) shows the ratios between the 5% damping actual and smooth spectra at various natural periods. Figure 10(b) gives the averaged spectral ratio; the shaded area corresponds to ±1 standard deviation about the mean curve. The fact that the median ratio between the actual and smooth spectra is close to unity for all natural periods confirms the accuracy of the procedure.
0.1 1 10
0.1 1 10
Spectra Ratio
T(s)
(a)
0.1 1 10
0.1 1 10
(b) Mean
S
p
ec
tral Ratio
T (s)
Figure 10 Ratios of actual spectra to design spectra
CONCLUSIONS
The normalized combined spectrum (NRSC) was defined in terms of ground motion
pseudo-velocity response spectrum and consecutive scalar function (fC). It was used to construct design spectrum
based on the analysis of a broader dataset of ground motions. The investigation has led to the following conclusions:
(1) The scalar parameter (fC) is defined in a function that consecutively varies with period in the
unit of m/s. The adoption of the parameter in the normalization of pseudo-velocity spectrum makes it possible to show all three of the major response amplification quantities rather than any one of the conventional spectra alone.
(2) The averaged consecutive spectrum exhibits some unique characteristics: 1) the asymptotical property of response spectra at short and long periods, 2) two distinct peaks in the high and low frequency regions, 3) the spectrum is presumably consistent with or slight larger than the up envelope of the traditional NRS in the entire spectral region.
motion amplitudes ratios in different regions makes it more reasonable in the prediction of PGV and PGD from PGA.
(4) The design spectrum is derived by applying the normalized combined spectrum (NRSC) to
consecutive scalar parameter (fC) that fabricated by design ground amplitudes. A procedure to construct
design spectrum is clarified. Line segments of the design spectrum are determined and fitted in terms of spectral characteristic points, but not parallel to the coordinate axis by considering the fact that the amplification factor is variable with period.
(5) The reliability of the proposed design spectrum is verified by through analysis of the dispersion of the combined spectra and variation of actual to smooth spectral ratio of ground motions. The fact that the combined spectra exhibit the lowest variation than any other spectra and the median ratio between the actual and smooth spectra is close to unity for all natural periods confirms the accuracy of the proposed procedure.
ACKNOWLEDGEMENTS
The research summarized in this paper was supported by the Special Fund for Earthquake Scientific Research in the Public Interest (201208013), National Natural Science Foundation of China (51238012, 51178152), and Project (HIT.NSRIF.2011115) Supported by Natural Scientific Research Innovation Foundation in Harbin Institute of Technology, these are gratefully acknowledged.
REFERENCES
China Earthquake Administration. (1997). Code for Seismic Design of Nuclear Power Plants, GB50267-97. Beijing, Standard Press.
Chopra, A. K. (2001). Dynamics of structures: Theory and Application to Earthquake Engineering, 2nd Edition. Prentice-Hall, NJ, 2001.
Guo, Y. X., Wang, Z. S. (1993). Standard design spectra for nuclear power plants in China. World
Earthquake Engineering, (2):31-36. (in Chinese)
Malhotra, P. K. (2006). Smooth spectra of horizontal and vertical ground motions. Bull. Seism Soc. Am 96, no.2, 507-518.
Mohraz, B. (1976). A study of earthquake response spectra for different geological conditions. Bull. Seism
Soc. Am 66, no.3, 915-935.
Newmark, N. M., Hall, W. J. (1982). Earthquake Spectra and Design. Earthquake Engineering Research Institute, Berkeley, Califonia.
Newmark, N. M., Hall, W. J. (1969). Seismic design criteria for nuclear reactor facilities, inProc. World Conf. on Earthquake Eng. 4th Santiaago, Chile, B-4, 37-50.
Seed, H. B., Ugas, C., Lysmer, J. (1976). Site-dependent spectra for earthquake-resistant design. Bull.
Seism Soc. Am 66, no.1, 221-243.