THE DEVELOPMENT OF SPATIO-TEMPORAL DATA MODEL FOR DYNAMIC VISUALIZATION OF VIRTUAL GEOGRAPHICAL INFORMATION SYSTEM
(PEMBANGUNAN SPATIO TEMPORAL DATA MODEL UNTUK VISUALISASI DINAMIK BAGI SISTEM MAKLUMAT GEOGRAFI VIRTUAL)
MOHD. SHAFRY BIN MOHD. RAHIM ASS. PROF. DAUT DAMAN
RESEARCH VOTE NO: 74260
Jabatan Grafik dan Multimedia
Fakulti Sains Komputer Dan Sistem Maklumat Universiti Teknologi Malaysia
ACKNOWLEDGEMENTS
ABSTRACT
(Keywords: Volumetric and 3D, Spatiotemporal Data Model, Database, TIN, VGIS) Virtual Geographical Information Systems (VGIS) is known to be one of the technologies used to improve the presentation of geographic visualization. Developing an efficient spatiotemporal data model is very important in contributing to the functionality improvement of the VGIS. Thus in this research, we focused on the data management aspect and has developed a suitable spatiotemporal data model for storing and retrieving volumetric geographic movement information. Volumetric is one type of spatial object in the VGIS, which is used to visualize 3D information. In order to develop real processes in VGIS, we have integrated the time element as an important factor to 3D objects. Time has been integrated with the data model, and temporal versions of volumetric surface data can be stored by using the model. This research also uses linear interpolating model techniques to visualize the movement changes. This application was implemented by developing a prototype visualization system using a Triangulation Irregular Network (TIN) with integrated time in the TIN structure. Result shows that the proposed data model is able to perform well with a visualization algorithm using linear interpolation and an improved TIN structure. This research contributed a suitable Spatiotemporal Data Model for managing continuous volume and 3D geographic movement data in VGIS and also a prototype of Spatiotemporal Database System which is can be implemented in GIS software. This can be particularly useful in applications such as geographic historical management data application, morphology of the terrain data, mobile movement, and Global Positioning System (GPS) application.
Key Researchers: Mr. Mohd. Shafry Mohd. Rahim (Head)
Ass. Prof Daut Daman
Miss Nur Zuraifah Syazrah Othman Miss Nur Syuhadah Rusni [email protected], [email protected], [email protected],[email protected],
ABSTRAK
TABLE OF CONTENTS
CHAPTER TITLE PAGE
ACKNOWLEDGMENT ii
ABSTRACT iii
ABSTRAK iv
TABLE OF CONTENTS v
LIST OF TABLES ix
LIST OF FIGURES xi
LIST OF APPENDICES xiv
1 INTRODUCTION 1
1.1 Introduction 1
1.2 Problem Background 3
1.3 Problem Statement 11
1.4 Motivations 11
1.5 Goal 12
1.6 Objectives 12
1.7 Scope 13
1.8 Report Structure 14
2 LITERATURE REVIEW 16
2.1 Introduction 16
2.2 Geographic Movement 16
2.2.1 Geographic Movement in Geographical
2.2.2 GIS Functionality for Geographic
Movement 19
2.2.3 Discussion 22
2.3 Spatiotemporal Data Management 23
2.3.1 Spatiotemporal Data 23
2.3.2 Properties in Geographic Movement 25
2.4 Spatiotemporal Data Model 26
2.4.1 General Purpose Spatiotemporal GIS
(GEN-STGIS) Data Model 29
2.4.2 A Spatiotemporal Data Model For Zoning 32 2.4.3 Cell Tuple Based Spatiotemporal Data
Model 34
2.4.4 Object Oriented Spatial Temporal Data
Model 36
2.4.5 Cube Data Model 38
2.4.6 Object Based Data Model 41 2.4.7 A Multigranular Spatiotemporal Data
Model 45
2.4.8 Activity Based Spatiotemporal Data Model 48 2.4.9 Feature-Based Temporal Data Model 51
2.5 Discussion 54
3 RESEARCH METHODOLOGY 61
3.1 Introduction 61
3.2 Research Framework 62
3.3 Process of Volumetric Surface Movement
In Formalization 64
3.4 Spatiotemporal Data Model Development 66 3.5 Data Management System and Visualization
Tools Development 66
3.7 Summary 68
4 VOLUMETRIC SURFACE MOVEMENT
SPATIOTEMPORAL DATA MODEL 70
4.1. Introduction 70
4.2. Formalization of Volumetric Surface Movement 71 4.2.1. Volumetric Surface and Movement 71
4.2.2. Time Characteristic 72
4.2.3. Time as Entity for Point 73
4.2.4. Movement Behavior 74
4.2.5. Data Reconstruction 76
4.3. Data Model 77
4.4. Proof of Hypothesis 79
4.5 Summary 82
5 DATA MANAGEMENT AND VISUALIZATION 84
5.1 Database Development 84
5.1.1 Logical Model 85
5.1.2 Physical Model 90
5.1.3 Database Model 91
5.2 System Architecture 92
5.3 Data Management 94
5.3.1 Data Loading Algorithm 94
5.3.2 Data Retrieval Process 97
5.3.3 Data Format 97
5.4 Data Visualization Algorithm 98
5.5 Conceptual Data Testing 100
6 DATA MODEL TESTING AND EVALUATION 105
6.1 Introduction 105
6.2 Testing with Arial Photo Data 106
6.2.1 Data Processing 107
6.3 Result of Testing Sample 109
6.4 Capability of Managing Volumetric Surface
Movement Data and Visualization 119 6.4.1 Managing Surface Movement Data 119
6.4.2 Data Visualization 127
6.5 Comparison with Current GIS Software 131
6.6 Summary 134
7 CONCLUSION AND FUTURE WORK 135
7.1 Introduction 135
7.2 Result and Major Finding 137
` 7.3 Future Work 139
LIST OF TABLES
TABLE NO TITLE PAGE
2.1 Properties of the Spatiotemporal Data that needs to
be considered in Information Modelling 25 2.2 Research Issues and Models (Narciso, 1999) 54 2.3 Research Issues in Spatiotemporal Data Model 56 4.1 Description of Transformation Point in Volumetric
Surface Movement. 75
4.2 Volumetric Surface Movement Data Model 78
5.1 Entities, Attributes and Relationship before
Normalization Process 88
5.2 Description of the Entities in the Logical Model 89 5.3 Description of the Relationship in the ERD 89 5.4 Physical View of the VSMST Data Model for
Developing Database 90
5.5 Conceptual Data for the Conceptual Testing 100 5.6 Point after Loading Data into the database. 101
5.7 Movement Information in the Surface 102
6.1 Sample Data for Set 1 110
6.2 Sample Data for Set 2 111
6.3 Sample Data for Set 3 112
6.4 Result of Loading Data into Database System 113 6.5 Query of Retrieve the data for load into data format 115 6.6 Contain of data in the File Format for Load into
6.7 Result of Retrieve Data from Database System 116
6.8 Result of Visualization Sample Data 117
LIST OF FIGURES
NO TITLE PAGE
1.1 Triadic models of space, time and attribute 2
1.2 Simple Geographic Movements in Arcview 5
1.3 Process Flow involve in order visualizing flood data 5 1.4 Flood Simulation Running in Movie Application 6 1.5 Example of Spatiotemporal Analysis in STEMGis 7
2.1 Descriptions of Spatiotemporal Data 24
2.2 Snapshot View Model and Space Time Approach Model 28 2.3 Structure Model: Class diagram for geographic phenomena,
geographic categories and geographic feature 31
2.4 The Entity-relationship diagram 32
2.5 The true nature of zones 33
2.6 Cell Tuple Based Concept 35
2.7 Superclass structure of the model 36
2.8 Theme classification hierarchy 36
2.9 Volume and border change of the lake 37
2.10 Cube Data Model 39
2.11 Abstraction of Spatiotemporal Data Storage in Database 43
2.12 Movement Management in Database 44
2.13 Multigranular Concept in the Model 46
2.14 Continuous Change 49
2.15 Discrete Change 49
2.16 Stepwise Change 50
3.1 Research Framework 62
3.2 Process of Developing Database 64
4.1 Volumetric Surface Movement 71
4.2 Movement Process on Volumetric Surface 72
4.3 Transformation of point at time (t) 74
4.4 Linear Interpolation Process for Simulating Movement 75 4.5 Samples of the Data in the Volumetric Surface Movement for
Conceptual Testing 80
4.6 Object Definition 80
4.7 Process of Reducing Data Redundancy before Loading
in the Storage 81
4.8 Illustration of the data storage in the Data storage 82
5.1 Logical Model of the VMST Data Model 85
5.2 Entity Relationship Diagram (ERD) for Volumetric Surface
Movement Spatiotemporal (VSMST) Data Model 88
5.3 Architecture of the System 93
5.4 Spatiotemporal Data Loader Processor 95
5.5 Data Format for Volumetric Surface Movement Visualization 98 5.6 Use of the parametric equation in the surface movement 99
5.7 Data Arrangements in the Data Format 103
5.8 Simulation of the Surface form Start Time (ts) to End Time (te) 104
6.1(a) Arial Photos year for 1983 106
6.1(b) Arial Photos for year 2004 106
6.2 Process of Getting Data for Testing 107
6.3(a) Sampling Data from the 1983 Ariel Photo 108 6.3(b) Sampling Data from the 2004 Ariel Photo 109
6.4(a) Point in Database for sample 1 113
6.4(b) Point in Database for sample 2 114
6.4(c) Point in Database for sample 3 114
6.5(c) Comparison the changes of sample 3 with the image 119 6.6 Managing of surface movement data in the VSMST
Data Model. 121
CHAPTER 1
INTRODUCTION
1.1. Introduction
Geography is a science of universe which describes phenomena, activity and time of an event occurring in the world. (Narciso, 1999). It can be classified into three major, namely: physical geography, human geography, and regional geography (Yattaw, 1997). Physical geography deals with the natural phenomena for example Geomorphology, Climatology, Biogeography, Hydrology, Soil Geography and Environmental Management. Human geography takes care of the human activities, for example developing city, managing resources, preserving and promoting significant cultural and historical values, and stabilizing the economy. Regional Geography compounds the issues related to the management of area for example Jabatan Ukur dan Pemetaan Malaysia (JUPEM) activity.
may be noted that, this factor brings to the surface period and duration of certain activities. Besides, it also unfolds a variety of important historical information. Figure 1.1 shows a Triadic Model describing the relationship among these three fundamental questions.
Figure 1.1: Triadic models of space, time and attribute
Geographic movement refers to change of geographic information. These changes take place in various forms. Some changes affect spatial data, some affect attribute data and some changes affect all of the data. It may be noted that change is a continuous process. Therefore, it cannot be ruled out that some times, new features and information may be observed due to this ‘change’ phenomenon. These changes are always described in the light of single most important factor, i.e. ‘time’. Due to the enormous importance of geographic movement, it has been classified into twelve categories (Nassima et al., 2002).
Most of the GIS uses managed data without thoroughly looking into movement or time in the application and software. However, Arcview software (Hogeweg, 2000; Gil and David, 2004; Jonathan et al., 2003) carries an additional tool for handling ‘time’ factor. Additionally, Spatial Temporal Geographical Information System (STEMGis) is software possesses the capability for managing geographic movement data. However,
What? Attribute
360C
When? Time 19/1/2004
this software still has some serious shortcomings since it fails in dealing with the complete set of classification of the geographic movement data.
Besides, we also look into other commercial GIS software such as GeoMedia, Mike 11 and ArcView. All these software has difference architecture and different data model to manage GIS data. In order to support geographic movement application, supplementary software and other development tools are still needed. Despite all these developments, a comprehensive examination of these application software comfortably confirms that generally, the current application does not fully support geographic movement analysis. Moreover, there is growing tendency of working with high dimensional data and at present there is no system which can manage 3D and volume data under an integrated environment.
This research focuses on the data management aspect which a suitable data needs model for storing and retrieving geographic movement information for some principal objectives like: analysis, manipulation, presentation and visualization. The importance of spatiotemporal data model to GIS cannot be underestimated. In spite of its tremendous importance, it does not cater specifically on the geographic movement.
1.2. Problem Background
This research deals with the development of spatiotemporal data model for geographic movement application. There are twelve important classes of geographic movement (Yattaw, 1997). These classes are divided into three basic categories of changes type like cyclical, intermittent, and continuous movement. The four types of space data has been classified into three categories of changes type, like: point, line, area and volume data. There are lot of important issues regarding spatiotemporal data modeling (Sellis, 1999; Yattaw, 1997; Narciso, 1999; Langran, 1992; Glenn and Hanan, 2000; Hatayama, 2002; Li et al., 2002b; John et al., 2004). These issues must be tackled in order to meet the requirement of dynamic phenomena in the world. Through an extensive survey, it has been concluded that there are six properties of spatiotemporal data which needs to be considered while modeling spatiotemporal information in GIS. These properties include: space, time, space-time, scale, non-spatial data and historical.
Majority of the existing software support spatiotemporal data for point, line and area. This means diversion of a lot of focus on 2D data. Relational database model were used in these software and tools. The visualization is done in an animated map (D’Onofrio and Pourabbas, 2003; Hogeweg, 2000; Moris et al., 2000). Despite all this development, these systems lack decision making ability mainly because of the unsystematic integration of the data (Geoffrey et al., 2004; John et al., 2004). This confirms that, semantic relationship and ontology among the data can not be obtained clearly and comfortably.
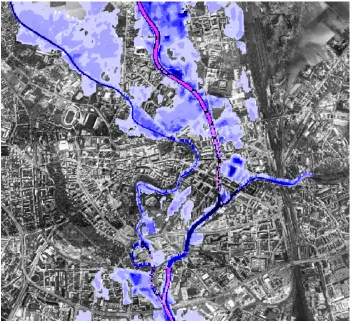
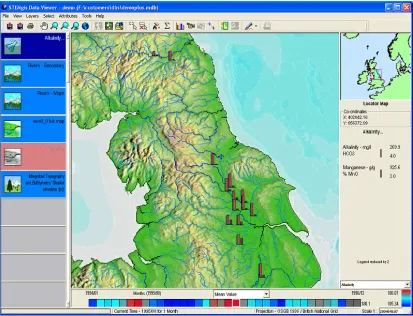
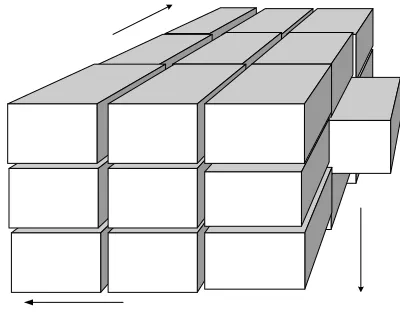
In ArcView data is stored in the different file format. In term of spatiotemporal it need two shape file or more and follows by attribute also in the same number. Figure 1.2 shows that example of the spatiotemporal data in the ArcView. However, spatiotemporal data is not only on the two set of data but the datasets can vary depending on the changes or the movement. Simple movement or changes can be shown in one shape file and the location of the movement can be stored as attribute in the attribute file. GeoMedia software also uses the same concept of the ArcView.
Figure 1.2 Simple Geographic Movements in The ArcView.
Mike 11 has a powerful analysis in the temporal or time series data. Also, the spatial changes can be store in the file system but it needs other software for representation and visualizing of the data. Figure 1.3 show the process has been done to create the spatiotemporal visualization from the Mike 11 data.
Figure 1.3: Process Flow involve in order visualizing flood data
Mike 11 - store time series data
ArcView – generate layer with difference time
Figure 1.4: Flood Simulation Running in Movie Application
Figure 1.5: Example of Spatiotemporal Analysis in STEMGis.
The above discussion takes us to the conclusion that the most current software does not comprehensively cater geographic movement application. This is because no framework of the geographic movement has been used in the process of developing the software. Besides, no general spatiotemporal data model has been used in the software. Only spatial data model has been used which is based on the layer model and snapshot model. In order to support geographic movement, current data model needs to be improved to accommodate spatiotemporal data model.
A detailed survey of the filed reveals the presence of nine spatiotemporal data models, which includes:
(i) General Purpose Spatiotemporal GIS (GEN-STGIS) Data Model (ii) A Spatiotemporal Data Model For Zoning
(iv) Object Oriented Spatial Temporal Data Model (v) Cube Data Model
(vi) Object Based Data Model
(vii) A Multigranular Spatiotemporal Data Model (viii)Activity Based Spatiotemporal Data Model (ix) Feature-Based Temporal Data Model
The description over each of these data models is presented in Chapter 2. Every member of this data model family has its own advantages and disadvantages. Hence in the real world the space data is multidimensional. Therefore, a lot of emphasis has been given for the consideration of 3D data in the data management component (Narciso, 1999; Commossi et al., 2003; Bonan and Guoray, 2002; Adnan, 2005; Bonan and Guoray, 2002; McBride et al., 2003). The classification of the geographic movement confirms the importance of 3D data and volume data as well.
It may be noted that the existing models do not support specific type of movement, and they are bending more towards discrete model such as snapshot model (Michinori, 2002; Narciso, 1999; Commossi et al., 2003; Bonan and Guoray, 2002; Adnan, 2005; Bonan and Guoray, 2002; McBride et al., 2003). The root cause of this issue is the lack of complete understanding of the real phenomena. And this view point is further confirmed in a number of research publications (Hogoweg, 2001; Michinori, 2002; Nadi and Delavar, 2003; Pfoser and Tryfona, 1998; Narciso, 1999; Robert, 2001; Bonan and Guoray, 2002; Donggen and Tao, 2001; Geoffrey et al., 2004; Jan, 2002; Christine et al., 1999; Li et al., 2002b; Kate, 2003; John et al., 2004). Secondly, most of the data model do not properly covers the type of movement. It focuses certain cases in the type of movement. However, it is a unanimously accepted view that in the case of all type of the movement the model can not support their needs. Therefore, to make a workable data model, the three types of the geographic movement i.e. continuous, cyclical and intermittent must be considered. Besides, theoretical issues regarding managing changes in data and semantic and their mutual relationship can be solved when the model considers various types of geographic movement behavior in the data model.
In addition to the above discussion, other issues revolve around the technical aspect after implementing the data model, which includes the redundancy of data, and also managing temporal and spatiotemporal data which increases from time to time. The models listed above also discuss the issue of data redundancy. This issue arises when we want to store changes and the changed data. In attribute data, this is not a major issue but in the spatiotemporal data this is very critical topic for discussion because in this case data is normally taken by snapshots. This problem can be fixed by storing only the changes without any loss of the information and data. The question is how the structure of the model should be built which guarantees the maximum possible control over the redundancy.
Historical storage is need of the hour. In the list of the data models, there are no allocations for managing historical information. With the passage of time the data keeps on multiplying. It is needed to sort out some possibility for storing and maintaining all the data along with the guarantee of the maximum possible efficiency of the system. In order to design an efficient retrieval process, indexing spatiotemporal data holds the primary importance. Since the model is not tested rigorously, therefore, it lacks the efficiency factor. Second important crippling factor is conduction of test on prototype but not on real model. Of course the prototyping approach is deficient with the management of large amount of data which involves numerous changes. So, it can be safely argued that for introducing the reliability and efficiency of the model, it has to be tested with real world problem.
In short it can be said that the design of the model should be robust. It must be able to handle the complexity of the data and it should have the capacity to technically manage the geographic movement data. Only these two basic features will facilitate us for quick retrieval of the historical data and it will enable us to exercise a controlled usage of memory and this feature, consequently, enhances the processing speed. Therefore, the model should be designed after a lot of deliberation and after reading between the lines all the technical shortcomings of the existing models.
1.3. Problem Statement
Current GIS software and application does not have a general model to support geographic movement. The issue can be solved by using spatiotemporal data model in the GIS software. Previously, there do exists spatiotemporal data models but these models lacks the quality for managing surface movement data on the volumetric object. Hence there is a strong need for designing a robust data model which can show a reliable and predictable behavior while dealing the complex data, memory management issues and efficiency of the model.
1. How to formalize surface reconstruction characteristic with the temporal element for developing spatiotemporal data model?
2. How to design conceptual and physical spatiotemporal data model which can support management of surface movement data on the volumetric object?
3. How to develop database system which is having capability to manage and visualize surface movement data on the volumetric object?
1.4. Motivations
Change is inevitable. Almost all object in the world change with the passage of time. It happens either by natural phenomena or due to human activity. It is because of this, time occupies a very important aspect in our life.
issue that needs an immediate attention. Currently, most of the applications do not cater all type of the geographic movement in the system.
This research attempts to provide suitable spatiotemporal data model which can support and manage surface movement data on the volumetric object. It is believed that suitable model will provide suitable application for managing geographic movement information which is reliable for the managing surface movement data. The importance of this research is as a guideline for managing and visualizing geographic movement application for helping in decision making process. The proposed application include: geographic historical management data application, morphology of the terrain data, mobile movement, and Global Positioning System (GPS) application.
1.5. Goal
Provide spatiotemporal data model for managing and visualizing surface movement data on the volume object to support Virtual GIS.
1.6. Objectives
Following are the objectives of this research.
1. To formalize the surface movement reconstruction with the temporal element to handle surface movement data on the volumetric object.
3. To develop a prototype database system and visualization tools for testing and evaluation of proposed data model.
1.7. Scope
Scope of the research includes:
1. In order to develop the data model, we need to understand the real world process and understand the way the data can be representing in the digital form. In the Virtual GIS, all of the object represent in the three dimensional or in the volumetric form. Surface reconstruction is a fundamental aspect in this research. We have study the surface reconstruction based on the how point created the surface on the object. For the purpose of managing movement in the surface, we have integrated the surface reconstruction with the temporal to come out with formalization. This formalization just only takes account of the geometric data and integrated with the temporal. We assume that all the data sources will be digitize from the data source to become a geometric data.
2. For developing the data model, we use the formalization has been introduce by first objective of the research. We assume that formalization is an important aspect to formalize the real world to the digital form. In this case, we just only focus on surface only without takes account of the object in the surface. For that purpose, we focus on the digital terrain model which is can be consider as volumetric object but we only consider the movement on the surface of the object only. The data model has been design by using the relational data model and not been tested with other database model.
the relational database model. The loading algorithm is to develop the loading system with reducing the redundancy of the object. The algorithm just only focuses on loading digital terrain data from the TIN data has been created by the ArcGIS. The retrieval algorithm is based on the database structure and prepares data for load into data format for purpose of visualization. Visualization algorithm is based on the deformable object by using parametric equation which is having capability to simulate the deformable object. The algorithm is developing for the purpose of read the data format and visualize the data based only the data in the data format.
1.8. Report Structure
The thesis is organized in seven chapters. This chapter generally discussed the workflow of developing the Volumetric Surface Movement Spatiotemporal Data Model and their implementation with testing and evaluation process. The aim, objectives and the scope of the research have been clarified. The basic concept of the studies and research will be reviewed in the next chapter.
In Chapter 2, detail descriptions of the study background are discussed. This chapter explains on the background of the idea of spatiotemporal data model and nine data model has been review to understanding the research problem with the solution. This chapter also explains on the comparison with the model and summaries the issues has been occur from their research.
Chapter 4 describes the formalization of the surface movement on the volumetric object and the concept of the VSMST Data Model. This chapter also discuss how the model can me use to minimize the redundancy of the data storage and the abstraction of the data model will be implemented. The last of the chapter we discuss the conceptual testing to prove that our formalization and the model can be use to manage volumetric surface movement.
Discusses in Chapter 5 are the methods of implementations of the research study. Phases in the implementation are explained in this chapter. This chapter describe the VSMST Data Model will be design in the conceptual model, logical model and physical model. After that the model will be use to develop the database system. This chapter also describe the loading algorithm, retrieval algorithm, data format and the visualization algorithm.
The results of the experiments are examines and discusses in Chapter 6. In the early part of this discussion is about data processing from the Ariel photos has been digitizing to use into the testing phase. The next discussion is about the result of data loading, data retrieval and visualization. This chapter also discuss capability of the data management by using VSMST Data Model and its visualization. We also discuss comparison of the result with the ArcGIS software to clarify the contribution of the research.
CHAPTER 2
LITERATURE REVIEW
2.1 Introduction
GIS occupies backbone position for analyzing various phenomenons of the earth. Due to its fundamental importance the system is gaining a lot of attention. Among various other important factors, the factor of ‘time’ plays a significant role in the constitution of an effective system. Consequently, this factor cannot be separated from the geographic data. Besides, the system holds a very strong relationship between space and time. The principal objective of this research is to create spatiotemporal data model, suitable for managing geographic movement data specifically on the volume and 3D data. For achieving this objective, previously available spatiotemporal data model were thoroughly discussed.
2.2 Geographic Movement
geographical features bring changes to their characteristics and as a result, affect the environment. Movement requires changes in both temporal and the spatial dimensions. The changes involving the spatial data cause changes in shape, geometry, location and topological information. The changes in the non-spatial data provide new information regarding the features. In order to gain a clear understanding on either the phenomena or event or changes regarding geographic movement, there are six important questions that need an immediate attention. The questions are ‘who’, ‘what’, ‘where’, ‘when’, ‘why’, and ‘how’ (Yattaw, 1997). ‘Who?’ and ‘what’ are questions of a human and nonhuman phenomenon’s identity, respectively. ‘What?’ typically deals with semantics matters. ‘Who’ are special cases of ‘what’ and ‘how’ questions; they could either be disguised ‘what’ questions or hidden ‘how’ questions.
Question of the phenomena occurrence are questions concerning time, past and future event (i.e. Where and When). In all geographic analysis of phenomena involving movement, one fundamental line of inquiry is to ask where the spatial change is occurring. Sometimes knowing the exact location is a necessary part in the examination and interpretation of the phenomenon. For example, in many human migration studies, an important aspect in understanding the movement knows where people moved from and to what location they have moved. The important element in examining a movement does not necessarily know absolute geographic locations, but rather understands the relative spatial structures of the movement such as distance affected or characteristics of the landscape.
are focused on the relationships between events rather than on the events themselves. Asking ‘how?’ about a movement can extend to include questions about the structure of spatially dynamic geographic phenomena. The basic spatial dimensions of movements are displayed in sharp relief to one another and interpreted in this fashion; different kinds of moves can be seen as basically identical in their spatial structure. Such framework is important for the description and understanding of how things move across three-dimensional space. However, explaining why things move in the human world is to refer to the ideas of spatial interaction.
Spatial change or movement across space requires change or passage of time. Despite the inherent nature of time and space in geographical movement, examination of time has not been given the same significance as the significance given to space. This may be largely due to the method for measuring time. While spatial change can be defined in both absolute and relative terms of distance and direction, non-spatial change measurements are usually based on relative terms only. Time-geography accepts the notion that space and time are universally and inseparably tied together and that examinations of human organization of the earth’s surface, human ecology and landscape evolution cannot separate the two dimensions.
2.2.1 Geographic Movement in Geographical Information System (GIS)
A geographic information system (GIS) is a computer-based tool for mapping and analyzing things that exist and events that happen on Earth. GIS technology integrates common database operations such as query and statistical analysis with the unique visualization and geographic analysis benefits offered by maps. These abilities distinguish GIS from other information systems and make it valuable to a wide range of public and private enterprises for explaining events, predicting outcomes, and planning strategies. Map making and geographic analysis are not new, but a GIS performs these tasks better and faster than do the old manual methods. And, before GIS technology, only a few people had the skills necessary to use geographic information to help with decision making and problem solving. Geomedia, MIKE-11, Arcview and STEMgis are tangible GIS examples. These software are discussed in the following section.
2.2.2 GIS Functionality for Geographic Movement
Geomedia have a function to execute grid Extract By Attribute request on active grid theme, it uses a mask grid to replace No Data cell values of the active grid (input grid) with the values of the nearest neighbouring cell. It cleans (smoothes) transition areas between grid zones using expand and shrink methods, shrinks linear features in active grid to one pixel which changes the resolution of the active grid by interpolating values using a chosen re-sampling method (nearest-neighbour, bilinear, or cubic). GeoMedia, enables the users to create a random grid, analysis variable in the VTAB of the grid. It facilitates the users to create a table containing various geometric calculations for each zone in the active grid and produces chart profiles of line features (streams, roads, trails, etc.) using a line theme and an elevation grid theme. Besides, Geomedia can also create elevation profiles of selected lines and selected point features, creates Warp start points, Warp desired points, deletes one or many links from the current link table and rotates the active grid in a clockwise motion around the lower left-hand corner.
MIKE–11 presents dynamic navigation tree that can give a complete overview of model while hiding irrelevant items. The logical dynamic dialogs allow concentrating on the required data, since sub-dialogs contain only relevant parameters. Top-down/Left-right model design leads through the model development in a natural manner. It also runs multiple models from the same data set and update data and all models automatically. Moreover, it executes rapid sensitivity analyses on model domain, grid spacing, layer specifications, etc. it has an easily link local-scale models to regional-scale models, or multiple regional models.
STEMgis is an editing and visualization software. It can view or edit the header of a grid, concatenate the frames from two grid layer, specify areas indicating no data areas, re-project a raster layer, extract frames, combine tiles, clip or erase data from a raster grid. It can evaluate the difference between time slices, and can also calculate statistics from multi-temporal raster data. This is able to perform raster layer mathematics, calculate volume and area from raster data. It can create contours from raster grid, calculate the slope and aspect from a raster layer, calculate the distance to feature in a raster grid, smooth the filter applied to raster layer, generalize lines, aggregate point data using clump radius, aggregate point attribute data into polygons, perform tracking analysis with curfew and restriction zones, create raster data from a vector layer and extract attribute values from raster data to vector data.
2.2.3 Discussion
Managing geographic movement data is not a new idea in GIS software. Traditionally data management system in the software can store and manage temporal information. Discussion in previous section show time series, temporal and spatiotemporal information can be managed in the current software. Most of the GIS software has capability and function to manage time series and temporal information. However, in the spatiotemporal information the software can not support all type of data. According to the classification of geographic movement (Yattaw, 1997) most of the software do not support the comprehensive requirements of GIS. Generally, the software can manage until two dimensional spatiotemporal data. On the contrary, the STEMGis software has a lot of capability (Yattaw, 1997), but this software too failed in dealing more than a two dimensional data.
Generally, GIS software architecture needs a dual database system (Shafry, 2004) where one is for spatial data in file format and the other is for attribute data using commercial database system. This structure gives rise to the issues of synchronization during analysis and integration of the data. This leads us to the point that changes of the data occuring in the spatial do not effect information in the attribute data. The dual database architecture is not beneficial in the case of spatiotemporal information in which data subject keeps on changing. Therefore, it is recommended to use single architecture in which all of the information is under one database system.
2.3 Spatiotemporal Data Management
Data management is very important component in any application including GIS. Functionality of the data management component is to make sure that data involve in GIS is in proper order. In spatiotemporal data management, user requirement refers to the capability for managing spatial and non-spatial data changes over the time.
According to Tryfona (1999) the five requirements for spatiotemporal include: (i) Represent objects with position in space and existence time.
(ii) Capture changes of position in space over the time, (1) continuous (2) discrete (iii) Definition of attribute of space and organization in layer
(iv) Capture attribute of the object changes over the time (v) Represent the relationships among the object in time
(vi) Represent the relationship among the attribute among the time (vii) Consider spatiotemporal analysis
According to Yattaw (1997) various classes of geographic movement are related to spatiotemporal data which include four type of the spatial data i.e. point, line, area, and volume data. Indeed this data fulfils the above listed requirements. It is prerequisite to understand spatiotemporal data because it will provide a good data model for developing data management system in geographic movement. Presently, there are nine different spatiotemporal data models. These models were extensively studied for developing a most suitable model for geographic movement application.
2.3.1 Spatiotemporal Data
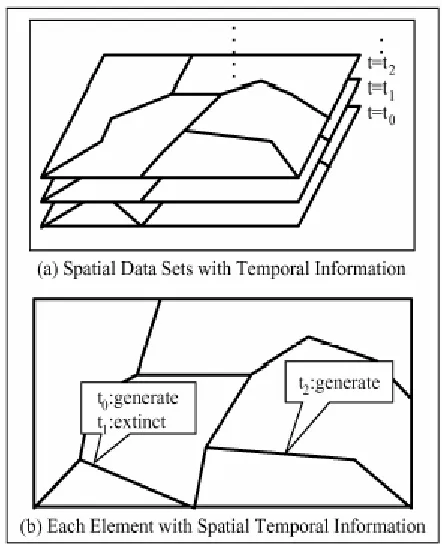
Figure 2.1 Descriptions of Spatiotemporal Data
From figure 2.1, it can be seen that object A in the time t1 changes to object AB in the time t2, object AB changes again to become object B in time tn. Objects keeps on changing depending upon the situation and the scenario. Spatiotemporal data is series of spatial data was change. Changes will happen until n time (end of the changes process).
Spatiotemporal data is part of the geographic movement. Geographic information contains space information, attribute information, and time information. Space describes location, and shape. Attribute describes type of feature, name and other related information. ‘Time’ describes behaviour of changing, and to know whether change is continuous, cyclical or intermittent. However, time is always changing. So, it is related to all components in the geographic movement. It means space and attribute is related to time.
Since Geographic movement is related to changes. Therefore, it can be described by the collection of changes that happen in the geographic information. In mathematical definition, we can describe as below:
Changes
A AB B
t2
t1 t n
df(gi) = dtf(space) + dtf(attribute) + dt ____ _______ __________ ___ dt dt dt dt
f(gm) = f(gi) + df (gi) + df (gi) + …… + df (gi)
____ ____ ____ ____ dt 1 dt 2 dt 3 dt n
2.3.2 Properties in Geographic Movement
The above discussion takes us to the conclusion that spatiotemporal data with the geographic movement behaviour has its own properties. These properties should be there in the data model. Table 2.1 shows, the summaries of the spatiotemporal properties. These properties hold fundamental position in the development of spatiotemporal data model.
Table 2.1: Properties of the Spatiotemporal Data that needs to be considered in Information Modelling
Properties Contains
Space Shape – Point, Line, Area, Volume Location
Place
Time Real World Time
Transaction Time Database Time
Cyclical Intermittence
Scale Duration
Period
Non-spatial Data Time Series Data
Information will explain data
Historical Time data was change
2.4 Spatiotemporal Data Model
In GIS, data model is the abstract of the database and representative of the real world phenomena according to a formalized, conceptual scheme, which is usually, implemented using the geographical primitive points, lines, and polygons or discredited continuous fields (Nadi et al., 2003). Data model should define as a data types, relationship, operations, and rules to maintain database integrity (Nadi et al., 2003). Spatiotemporal databases deal with geometry changes over the time (Wang et al., 2000). It must consider how to store the changes of spatial data. Traditional relational database technology is not suitable for managing spatiotemporal data, which are multidimensional with complex structure and behaviour (Wang et al., 2000). ‘Time’ occupies a very important position in spatiotemporal data model. Its significant aspects include (Hogeweg, 2001):
(i) The moment for which a value has been determined (world time) (ii)The moment the value is stored (database time)
(iii)The moment the value was retrieved from database.
(Sellis, 1999; Narciso, 1999; Thomas et al., 2001). It supports the relationship within the object (Sellis, 1999; Narciso, 1999; Thomas et al., 2001). Object Oriented Database Model is also used in GIS (Wang et al., 2000; Sellis, 1999). But Object Oriented Database Model do not fully support relationship of the object (Wang et al., 2000; Stojanovic et al., 2001) but it works with the complex object like 3D. Currently, focus has been shifted to design database model using Object Relational Database Model. Oracle 9i and Informix Database support this type of database model (Shafry et al., 2004; Daut et al., 2001).
Approaches to design data model play an important role for successful Spatiotemporal GIS. The integration of the database model and approaches will give a guide line to an abstraction of the data model. Besides, it is easy to implement and develop database system. There are two approaches that have been found in our literature study. There are Snapshot View Model and Space Time Approach Model (Michinori, 2002).
These two models have taken time element in the model. GIS software discussed in previous section is based on the type of the model. Based on two models, some researcher has develop own data model using Space Time Approach which is including explicit and implicit description. The issues were arising implementing this data model is redundancy of the data and suitable indexing technique for supporting large amount of data.
In GIS, there are four models canned been considered to create data model. These are Field Based Approach, Object Based Approach, Direction Based Approach, Feature Based Approach (Shafry et al., 2004; Daut et al., 2001). Some model has been extended to add time element in the approach. Double Cube Data Model is one of the examples that had been implemented using Cube Data Model and Enhancement of Feature Based Approach by adding time element. However, we want to highlight these four approaches that can be added time element to create data model for spatiotemporal data. These are the challenges for the researcher to explore and find out the suitable model for the managing geographic movement data.
Discussion of the data model will be extended below by looking into several data model has been developed to support spatiotemporal data. There are nine (9) data models that have been discovered throughout 1999 to 2004. The models are:
(i) General Purpose Spatiotemporal GIS (GEN-STGIS) Data Model (ii) A Spatiotemporal Data Model For Zoning
(iii) Cell Tuple Based Spatiotemporal Data Model (iv) Object Oriented Spatial Temporal Data Model (v) Cube Data Model
(vi) Object Based Data Model
These models were developed based on the different approach to support different application. They have their own advantages and disadvantages. However, a lot of issues were arising in these data model which can be classified into technical issues and fundamental or theory issues. This will discuss detail in the section 2.4.4. Before that we can go detail about the entire model to clearly know purpose of the model and how it was design.
2.4.1 General Purpose Spatiotemporal GIS (GEN-STGIS) Data Model
GEN-STGIS is modelled using 2-dimensional, or plane, Cartesian ( x , y ) coordinate system and is based upon Euclidean geometry, which is concerned with the study of points, lines and other geometric figures that can be formed with them (i.e., polygons, polylines and arcs) a plane with the described characteristics is called an Euclidean plane. To specify the representation of geographic feature in time, the GEN-STGIS data model uses the two temporal dimensions, valid time and transaction time, which are orthogonal, independent and semantically different so they can be manipulated separately. The GEN-STGIS data model is based on the linear model of time, where time is measured as a discrete variable. This decision has been made based on current temporal data base research that adopts the discrete model for representing valid and transaction time.
geographic and temporal characteristics of geographic feature to overcome some of the problems presented in the current spatiotemporal GIS data models.
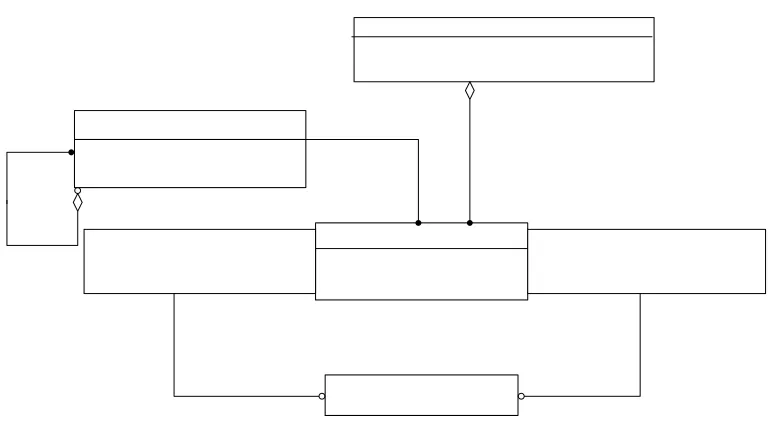
The design of an object-oriented data model generally involves two basic steps. First, structural modelling, which describes the structure of similar objects in term of classes, their similarities and differences, the association or connection among these classes and the structural constrains. The seconds step corresponds to the behavioural modelling, which describes the behaviour of the different classes in term of operations and relationship.
Figure 2.3 Structure Model: Class diagram for geographic phenomena, geographic categories and geographic feature
of the different ways for querying the data model. In order to evaluate the structural aspects of the data model, the forth part will be performed to illustrate the process of geo-temporal data modelling. The last part will be performed to data model where it could be implemented as object-oriented database.
This new Gen-STGIS data model satisfies the two principal requirements of spatiotemporal GIS application. First, it provides a significant advance in the field of TGIS by providing a reasonable 2D spatial and 2D temporal representation of geographic features and seconds, it allows the retrieval of the corresponding spatiotemporal GIS data. It would be unrealistic to suggest that the proposed GEN-STGIS data model provides a final solution to spatiotemporal GIS development. Much research needs to be done to deal with the complexities of TGIS before any complete version will be available and accept by the GIS community. Some problems, like the requirement of sophisticated hardware and software due to the storage requirement and the manipulation of immense amount of data, need to be solved.
2.4.2 A Spatiotemporal Data Model For Zoning
Zoning is a legal method for a city to control development. Zoning defines specific areas in a city where land use and building specification are controlled by law according to what is deemed appropriate for that area. For example, an area zoned for residential use would have land use and building restriction that would prohibit uses within that area.
Healthy, safety, sanitation and economic equity, city beauty, humane and available housing; these are all obvious concerns and goals of citizen and their civic leaders. It is possible for civic leader to achieve these goals without any direct control over land use and building in their city. But there are other issues supporting the need for zoning. Health issues are related to varying land uses. Long-term exposure to some industrial process can be hazardous. No one wants to live next to a toxic waste dump or any other property whose emissions are harmful or detract from the quality of life.
The diagram simply shows how one real world entity is related to another real-world entity. The centre hub of this model is the Ordinance event. Ordinances are laws created by city governments. They are not restricted to only planning issues; they can apply to any aspects of city government and business.
Figure 2.5: The true nature of zones
In this research, this data model has been implemented using ERSI Arcmap software and Microsoft Access as a database. This model has been test with the Riverbottoms neighbourhood in Provo was selected as the test area. It was chosen because it is an area that has undergo a large number and variety of zoning changes in the last 20 – 30 years. Class of queries has been tested were three classes of basic queries and four modes of spatial analysis to run on spatiotemporal database. The three classes are:
(i) The query deals with changes in the feature (movement, change in shape); (ii) The query deals with changes in the distribution of features;
(iii) The query deals with the temporal relationships among multiple geographic features.
The four modes of inquiry for spatial analysis are Exploration, Explanation, Prediction and Planning. Basic zoning queries has been running are:
In 1978 a city annexes an area & gives it a zone designation
In 1985 a new zone is created which overlaps the original zone
(i) This is a basic query designed to fulfil the need within planning departments for parcel-based zoning histories. These queries can improve both the efficiency and accuracy of planning decisions. The intend is to determine current and past zoning as well as allowed land uses for the property in question.
(ii) To produce the correct cartographic result, the strategy is to achieve the real-world overlapping of zones. By drawing more recent zones on top of earlier ones, the map falls into place visually.
The characteristics of an actual zone were identified and found to be very similar to a basic GIS feature: a non-topological polygon. The problem was greatly simplified by using a feature that can exist essentially independent of any other feature. Zones never move, zones never change shape and zones do not die. The master plan regions can also be stored in the same manner as zoning. Having this data in the database can create more queries that focus on analytical and predictive questions rather than the day-to-day queries.
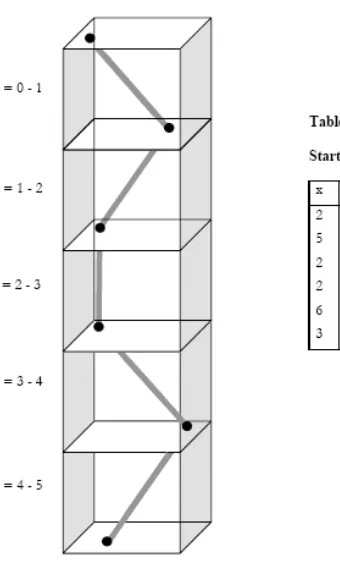
2.4.3 Cell Tuple Based Spatiotemporal Data Model
Figure 2.6: Cell Tuple Based Concept
In the temporal cell complex, intra cell complex relations, i.e. relations between the cells in the cell complex can be describe using boundary and co-boundary relations. The boundary of an n-cell are its (n-1) faces at time t. the co-boundary relations capture two types of topological relationships i.e. adjacency and containment. Relations between spatial objects can be found based on boundary / co-boundary relations between cells. The boundary and co-boundary relations are encapsulated in a simple temporal cell tuple structure.
Each 0-tcell of 1-tcell is assign two tuples. At base state (T!) there were 12 temporal cell tuples. At time T1, the tuplesc1 has the following configuration c1= (1,1,0,T1,*), where the first cell “1” is the 0-tcellid , the second cell “1” is the 1-tcellid, the third cell “0” is the 2-tcellid. Due to the spatial change at T2, the configuration of the tuples are changed and new tuples (c13, c14, …, c30) are created; some old tuples cease to exist (c1,c2,c3,c4,c5,c7) and other remain the same (c6,c8,c9,c10,c11,c12).
response time. Because of the adoption result is in voluminous data, the system response may be increase.
One of the great advantages of this model is that spatiotemporal topology is stored all the time in an implicit manner and spatial-objects are treated uniformly. The model is dimension independent. Therefore, the approach can be extended to higher spatial dimensional objects and singularities of cells can be incorporated. The cell tuple structure may generate a large number of tuples, but it is expected that it would not affect the system performance because of its simple structure.
2.4.4 Object Oriented Spatial Temporal Data Model
Figure 2.7: Superclass structure of the model
Figure 2.8: Theme classification hierarchy
Theme
Transportation Water System ……Settlement Natural Resource
Highway Roa RailroadRiver Lake Pool Country City Coal
There are three kinds of behaviours in this model has been consider. There are spatial change of the object, spatial relationship with other objects, and temporal relationship with other objects. Spatial change includes: 1) stay-in; 2) Transform-between; 3) Appear/disappear: 4) Increase/decrease 5) Splitting: 6) Moving.
Concept of the object oriented modelling is involved generalization, specialization and aggregation. Generalization extracts similar properties of different classes into a super-class, while specialization extends a class to some sub-class. In Figure 2.7 transportation is a super-class, which can be specialized into highway, road, railroad, etc. Association can also be called grouping which enables some objects of same type to form an object of higher-level type. Aggregation is a construct that enables different objects to be amalgamated into a higher-level object. The super class mentioned above defines basic void attribute and behaviours of a spatial temporal object. This super class can be specialized into sub-class. Each sub class can also have its own sub-class. With this class hierarchy and the aggregation and association of different classes, multi semantic space and time can be expressed.
b1 b2 b3 b2 b1 Volume Time v1 v2 v3
Jan Feb Mac Apr May Jun Jul Aug Sep Oct Nov Dec Jan
Figure 2.9: Volume and border change of the lake
One problem with previous data model is that spatial and temporal aspects of databases are modelled separately. Spatial database focused on supporting geometries while temporal databases focus on the past state. But in many circumstances, spatial and temporal attributes should be connected together. Application-driven is another problem. Many database systems concentrate on the definition of a particular spatial temporal model that is related to certain application. Each model focuses on a specific set of spatial temporal features. When encountering other features and applications, that model doesn’t work. The third challenge for spatial temporal modelling is on the discrete representation of continues phenomena. Many temporal systems can only capture discrete snapshot of real world but many temporal phenomena in nature are continuous, such as clouds, rains etc. The fourth problem is representation of data should be natural to human. The structures of space and time are identified as essential for the realization of cognitive systems. Human knowledge of the dynamic geographical world comprises of three different subsystem that handle “what”, “where” and “when aspect of object properties. Theme-based model, location-based model and time-based model separately describe one subsystem.
Based on human cognition, the model linked together theme, space and time through common object references. This model is built up from the basic attributes and behaviours of spatial temporal objects. Based on object oriented strategy, it’s extensible to any applications by generalization, specialization, association, and aggregation. Thus, this model can completely support the multiple semantics of space and time. This model has the same efficiency no matter querying time or querying space. Each time table, each space table and each theme table has an object ID as the index.
2.4.5 Cube Data Model
provides a simple conceptual model that helps users and developers to visualize how their data are stored. It allows the user to record the history of any object, or feature as it moves through space and time. Descriptions of features and the events observed at them are recorded in terms of properties or attributes. Thus, to store river water quality data, an individual monitoring site might be classified as a feature and the variables which describe or are observed at the site, such as its position, the site name, a unique reference number, river flow, pH values and so on, would be its attributes. Other examples of features could include a river network, land use map, and satellite images. WIS supports a wide range of spatial and non-spatial data types allowing the user to record most types of variables. Both features and attributes are decided and defined by the users and their system and user definitions are stored in data dictionaries
Figure 2.10: Cube Data Model
intervals; 5) the data model does not distinguished between spatial and temporal data; 6) the cube is infinite in all directions.
The WIS cube was implements in Microsoft Access. The underlying tables contain three different types of data: data tables; list tables and reference data. The data table shares a common basic design and varies only in that different data types need different columns to hold the value. Each row in a data table contains a value from a cell in the cube. A list contains a set of feature identifiers, attribute identifiers or date/time range that pick out a set of feature of interest. Reference data provide supporting information such as units of measurement, periods, field and structure definitions, feature type definitions and attribute information.
Traditional geographical information systems employ a two dimension or at best 2.5 dimensional frameworks, suitable for many applications. However, mapping the environment introduces certain problems not easily managed within existing systems. The natural environment is constantly changing and this requires a more dynamic way of handling such data. Environmental media, such as the ocean and the atmosphere, complicate matters further as processes that occur within them vary through three-dimensional space and through time.
2.4.6 Object Based Data Model
The relative view treats space-time as relationships between objects, phenomenology that is intuitively suited to epidemiological queries, Which seek information regarding associations between health events. Whereas current GIS data models store information regarding what and where events occur, the Space-Time Information Systems data model is designed to store what, where and when.
The approach to constructing space-time information systems: the data structures; including the object-based data model; movement and attributed change models; space-time indexing; and queries possible within a STIS. The space-time object model is being used to represent an individual, as might be required to model exposure and disease status at the individual level. This approach applies equally to other possible objects, whenever a space-time object representation is appropriate.
In addition, morphing can occur when the shape of a complex object, such as a polygon, changes through time. Morphing can be gradual, in which case the change in the object’s boundary occurs over a defined time interval; or it can be abrupt. Morphing is a ready mechanism for handling changes in cadastral systems such as realignment of administrative and political boundaries. Attributes are observations on variables describing the modelled entity and its environment and the change models describing how those attributes change through time. These change models support the rapid visualization of space-time change in, for example, disease rates as well as the health status of individuals as demonstrated in the “STIS-Influenza” application presented in the Results section. The attributes are defined at the application level by extending these object definitions through inheritance. This provides a powerful mechanism for designing custom objects that retain full functionality defined by the SpaceTimeObject data model. Object Chains Object chains represent individuals moving through time and space as chains of sub-objects.
These object chains can describe people, raccoons, mosquitoes, trees, or structures. Object chains can have time-dependent attributes such as weight, height, disease status, size, etc. These attributes, however, are fixed in the duration of a subobject. Mark, Egenhofer et al (2000) describe geospatial lifelines for representing an individual’s movements and exposure throughout a defined time period, and is an example of an object chain representation made specific to modelling exposure at the individual level. While observations on chains occur at a finite number of time points or time intervals, these observations do not have to happen at the same time for all individuals under scrutiny.
chains can be modelled in two ways—as snapshots in time or as continuous objects. For snapshot-type methods, object chains are represented as a linked list of time point data, with no projections of movement between time points
Figure 2.11: Abstraction of Spatiotemporal Data Storage in Database
Figure 2.12: Movement Management in Database
categorical and continuous data. These include techniques from the field of geo-statistics, which provides a probabilistic framework for space-time interpolation by building on the joint spatial and temporal dependence between observations. This methods overview has touched on several of the important questions and potential solutions that provide the framework of Space-Time Information Systems.
2.4.7 A Multigranular Spatiotemporal Data Model
A Multigranular Spatiotemporal Data Model has been proposed for representing both spatiotemporal data supporting multiple granularity management for spatial and temporal dimensions. This data model are modelled in modelling situations in which the position of moving entities must be related to geographic areas represented by maps. Both moving entities and map data can be specified at different levels of detail, the notion of spatial granularity partitions the space by taking into account the specific application domain considered. Therefore, this notion is application domain dependent.
To compare spatial data expressed at different granularities, this data model refer to map generalization operators specifically those used in model oriented generalization. Particularly, the operators supported by this model will guarantee topological consistency. The framework for this model presents an extension of the ODMG model, by taking into account the work done in a previous temporal extension. This multigranular framework can be considered as a basis for developing an object oriented spatiotemporal model with an expressive query language, as extension of OQL and the temporal path expression language, for performing the analysis of spatiotemporal data expressed at multiple spatial and temporal granularities.
system with specific types for representing spatial data by means of vector features, and with parametric constructors for specifying spatial, temporal and spatiotemporal information at multiple granularities.
The model has been designed for handling moving entities and temporal maps uniformly. The model allows for the definition of data at different spatial and temporal granularities, at different levels of detail with respect to spatial and temporal dimensions. In particular, data representing moving entities or maps that have spatiotemporal characteristics can be specified with respect to both different spatial and temporal granularities.
The object attributes for this model can be spatial, temporal, spatiotemporal or conventional attributes, that is, attributes without any spatiotemporal characteristics. Temporal and spatial multirepresentations of object attributes are orthogonal characteristics of the model. They are obtained by taking into account temporal and spatial granularities sets separately, and scaling a temporal/spatial value to a different granularity.
A framework for the specification of a spatiotemporal extension of ODMG data model with support for multiple spatial and temporal granularities has been presented. By designing a database model including both spatial and attribute data, this data model adopts an integrated approach that uniformly handles all data and differentiates itself from traditional GIS systems.
Although the specification discussed is not complete, this data model does present some interesting aspects. First of all, this data model give uniform specifications for both multigranular spatial and temporal types that can be easily combined to define multigranular spatiotemporal types. It also specifies the model query language by extending OQL with spatiotemporal path expressions. This data model also considers an integration of the query language with map overlay operations.
The data definition language have been extended to allow for the explicit storage of topological relationships of spatial data represented in temporal maps, that is a critical issue for speeding up queries. Moreover, this data model can combine the static conversion specification in the database schema with a more flexible on-demand specification system, by extending the query language with ad-hoc conversion specifications.
2.4.8 Activity Based Spatiotemporal Data Model
This data model has been developing with the aim to representing, analyzing and predicting changes of spatial information over time. A lot of models have been proposed. All the models are intended for addressing and modelling the dynamic behaviours of natural phenomena, which is normally related to changes in spatial extent. These model are however, not tailored to the need of activity-based research. This is because the dynamic of activity and travel behaviour are related to changes in locations of human subjects. Spatiotemporal data models for activity-based transport demand modelling have been created to overcome these problems. In this mode, the behaviour of activities is represented as a sequence of two states-staying at and travelling between activity locations. The proposed model can support analysis and queries of activities from multiple perspectives. The activity based approach has resulted in a wider range of issues that need to be addressed. It includes:
(i) Demand for activity participation (ii) Activity scheduling in time and space
(iii) Spatiotemporal, interpersonal and other constrains (iv) Interactions in travel decision over time
(v) Interactions among individuals (vi) Household structure and roles
Since most activity data are location specific, a GIS is particularly useful for activity-based modelling. It is likely that GIS will be used increasingly as a spatial decision support tool for activity modelling. In general, GIS has great potential to support activity-based modelling in data collection, data management, data manipulation, data output and visualization. Specifically, activity-based travel demand modelling will benefit from GIS in the following respects:
(i) Support for data collection
(iii) Define an individual’s spatial and temporal opportunity set for conducting activities
(iv) Represent the space-time prism
Based on the changing characteristics of the spatial attributes of objects, such as location, boundary or shape, three types of spatiotemporal behaviours can be differentiated.
Figure 2.14: Continuous Change
A continuous change: objects of this type are always considered to be in a changing state.
Figure 2.15: Discrete Change
Figure 2.16: Stepwise Change
A stepwise change: objects of this type are sometimes static and sometimes
changes. The database used for this data model is only included the major information. The information included activity type, travel mode, activity partner and time in the transport system.
This data model supports queries from time-based, person based, activity-based and location based perspectives. This data model is powerful in organizing, managing and manipulating data for activity based modelling. The prototype of this model will be extended to support activity schedules and policy change evaluation, by providing functions to find out activity schedule and to identify impacts on activity patterns of changes in opening hours and level of service of the transport system.