www.ijaera.org 2015, IJAERA - All Rights Reserved 182
Customer’s Perspicacity
Tejinder Pal Singh Brar1*, Dr. Dhiraj Sharma2, Dr. Sawtantar Singh Khurmi3
1Computer Science Department, Apeejay College of Fine Arts, Jalandhar, Punjab, INDIA
Research Scholar, Applied Sciences-Computer applications Punjab Technical University, Kapurthala, Punjab, INDIA
*Corresponding Author E-mail: [email protected]
2School of Management Studies, Punjabi University, Patiala, Punjab, INDIA 3Bhai Maha Singh College of Engineering, Kotkapura Road, Muktsar, Punjab, INDIA
Abstract: Indian financial sector has witnessed remarkable growth in terms of electronic mode of banking. Banks offer customers (both retail and corporate) online services through a variety of channels. In the past, service quality factors with respect to retail customers and E-banking have been moderately studied and especially decision making factors that motivates retail customers to use this mode of electronic channels. This study evaluates E-banking service quality from retail customer’s perspective. The constructs in this study were developed for reliability and validity by using measurement scales from prior studies. In order to confirm factor analysis results, SEM has been employed. The results of study show that service quality have influence on customer’s perceptions. This study has its share of limitations that also serves as directions for future research.
Keywords: E-Banking, Service Quality, Security, Perceptions
I. INTRODUCTION
Banking business has been changed across the globe and the effect of the same can be seen in the Indian banking sector as well. Banks adopted electronic channels to deliver services to customers because these channels are low cost also it offers anywhere and anytime banking. Indian banks now have shifted their focus towards a customer oriented banking products and services.
On the other hand as per the changing market scenario and with growing demands of the retail customers, banks need to re-look at their business models and the number of products they offers. According to Barnes and Corbitt (2003), banks are trying to offer their customers not just anytime banking but anywhere-anytime banking through appropriate application of developments in the information technology area. Over the past few decades Indian banking sector invested a considerable efforts in IT with the intention to improve product innovation, operational efficiency and competitive ability in the financial industry [Padmanabhan (2012)].
www.ijaera.org 2015, IJAERA - All Rights Reserved 183 been found to be an important input to customer satisfaction.
Thakur (2010) investigate the effect of service quality and customer satisfaction on customer loyalty among the group of customers in Indian banking industries. Data has been collected from 298 customers of the Indian banking industries; results reveal that customer satisfaction is significantly and positively related with customer loyalty; customer satisfaction is also found important mediator between service quality and customer loyalty. Electronic service quality plays critical role in success or failure of an organization. According to Yang (2001) and Zeithaml (2002) establishment of trust and relation with customers greatly affected by E-service experience. Zeithaml et al., (2002) cited online service quality is essential to achieve success in business. On the same lines Oliveira et al. (2002) mentioned that electronic services might be significant to retain existing customers while attracting potential customers in the digital age.
The importance of measuring and monitoring e-service quality has been recognized with enhanced adoption of e-service in banking field. Mishra (2010), tried to show the relationship between customer satisfaction on bank services and the attributes of the perceived service quality and therefore presented two structural equation models (SEMs), one for public and another for private sector banks in India. Specifically, structural equation model is formulated to explore the impact of the relationship between customer satisfaction and service quality attributes. Mols (2000) concludes that in E-banking unlimited access to variety of financial transaction and quality levels of bank products are becoming a key driving force in attracting new customers and enhancing customer satisfaction. One of the key determinants for successful e-business is e-service [Carlson & O’Cass (2010)].
Santos (2003) described E-service quality as largely customer evaluations and judgments regarding the quality of e-service delivery in the virtual marketplace. According to Sylvie & Ina (2010) with the growth of the e-commerce, E-service has become a popular. Morre (1987) described that service quality can lead an organization and enable to gain a lasting competitive advantage. Existing literatures on e-service quality mainly concentrate on dimensions and measuring methods of e-service quality, and there is no recognized definition of e-service. Parasuraman et al., (1985) defined service quality as the comparison between service expectation and service performance. Authors reported that service quality is determined by the differences between customers’ expectations of the service and their perceptions of the service experience.
www.ijaera.org 2015, IJAERA - All Rights Reserved 184 Table 1: Measurement of E-Service Quality
Sr.. No.
Authors Values Dimensions
1 Johnston(1995) 18 Access, aesthetics, attentiveness, availability, care,
cleanliness/tidiness, comfort, commitment, communication, competence, courtesy, flexibility, friendliness, functionality, integrity, reliability, responsiveness and security.
2 Dabholkar (1996) 6 Website design, reliability, delivery, ease of use, enjoyment and control
3 Kaynama and Black (2000)
7 Content, access, navigation, design, response, background, and personalization.
4 Cox and Dale (2001) 6 Website appearance, communication, accessibility, credibility, understanding and availability.
5 Ho and Lin (2010) 5 Web design, customer service, assurance, preferential treatment and information provision.
6 Wolfinbarger and Gilly (2002)
4 Web site design, reliability, privacy/security, and customer service
7 Zeithaml (2002) 11 Access, ease of navigation, efficiency, flexibility, reliability, personalization, security/privacy, responsiveness,
assurance/trust, site aesthetics, and price knowledge. 8 Yang et al. (2003) 6 Reliability, access, ease of use, attentiveness, security, and
credibility 9 Yang and Fang
(2004)
4 Reliability, responsiveness, assurance and access
10 Parasuraman,
Zeithaml, &Malhotra (2005)
5 Information availability and content, ease of use or usability, privacy/security, graphic style, reliability
11 Kim et al (2006) 9 Efficiency, fulfillment, system availability, privacy, responsiveness, compensation, contact, information and graphic style in online retailing.
12 Li & Suomi (2009) 8 Website design, reliability, responsiveness, security, fulfillment, personalization, information and empathy Source: Developed by the Researchers
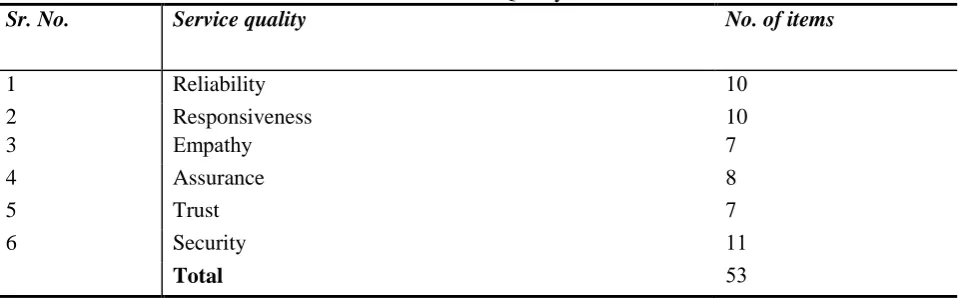
Table 2: Service Quality Dimension
Sr. No. Service quality No. of items
1 Reliability 10
2 Responsiveness 10
3 yhtapmE 7
4 Assurance 8
5 Trust 7
6 Security 11
Total 53
www.ijaera.org 2015, IJAERA - All Rights Reserved 185 The purpose of this study is to examine service quality dimensions from retail customer’s perspectives. In order to obtain complete view of banking industry, two more dimensions items were added to the SERVQUAL scale. The additional items (trust and security) were derived by going through interviews with branch managers, IT administrator, IT staff, officers and retail customers of selected banks. Therefore total 53 items were included under six dimensions (i.e. Reliability, Responsiveness, Assurance, Empathy, Trust and Security) to measure the service quality. The respondents were asked to evaluate their level of satisfaction on 53 items. All the items were measured on the five-point Likert scale from 5 (strongly agree) to 1 (strongly disagree).
II. RESEARCH OBJECTIVE AND METHODOLOGY
The primary objective of this research study is to scrutinize the retail customers’ perceptions about the service quality of E-banking. In this section we present the research methodology. After describing sample and variables, statistical analysis is presented.
Sample Description:
The study attempts to examine the retail customer’s view point towards E-banking security in the urban north India. The data for this study is collected from retail customers who have saving account in ICICI bank branches at Jalandhar, Patiala and Mohali and that are using bank services specifically electronic banking services form the last one year at least. In order to accumulate data, pre-tested questionnaire has been prepared and have been filled either by face to face interaction or sent through post/email during the period of May 2014 to December 2014. A total of 350 pieces of questionnaire papers are given out to the retail customers of ICICI branches on randomly basis. However those questionnaires that not filled properly have been completely taken out. Hence, the universe of population is the 225 retail customers. This study is descriptive as well as exploratory in nature.
Research Variables:
The present study is related to E-banking services availed by retail customers. The study is descriptive as well as exploratory in nature. In the study, E-banking will be judged on the basis of following components:
I. Reliability: It means ability to perform the promised service dependably and accurately. II. Empathy: Caring individualized attention the service provider gives to its customers. III. Responsiveness: It is willingness to help customers and provide prompt service.
IV. Assurance: It includes knowledge and courtesy of employees and their ability to inspire trust and confidence.
V. Security: It aimed at protecting users from risk of fraud, hacking or phishing. VI. Trust: It means customers rely on electronic services.
III. FACTOR ANALYSIS
www.ijaera.org 2015, IJAERA - All Rights Reserved 186 service quality variables. A scale was developed to identify the service quality regarding E-banking services provided by bank. Total 19 factors were selected to find the service quality E-banking services from retail customers view point. The respondents were required to rate variables/statements on a five point Likert scales, which ranged from strongly disagree to strongly agree.
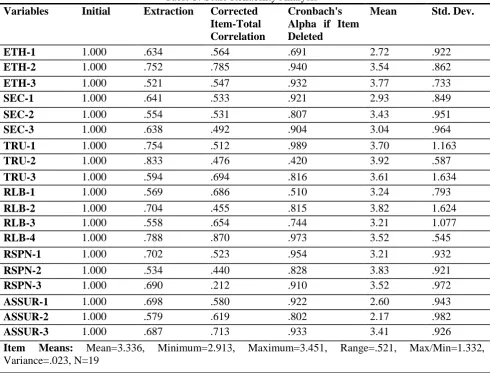
Scale Development and Refinement: These items were to be rated on a five point Likert scale by the respondents. Item wise reliability analysis was executed on selected variables for developing a reliable scale. For the determination of reliability assessment of uni-dimensionality, reliability and validity have been answered. Hence, based upon these concepts the scale generated for present objective was refined and purified. Also the inter-item correlations and Cronbach’s alpha statistics were employed to conduct the scale reliability analysis and to know extend to which items were correlated with the remaining items in a set of items under consideration. The results are shown in Table 3.
Table 3: Scale Reliability Analysis Variables Initial Extraction Corrected
Item-Total Correlation
Cronbach's Alpha if Item Deleted
Mean Std. Dev.
ETH-1 1.000 .634 .564 .691 2.72 .922
ETH-2 1.000 .752 .785 .940 3.54 .862
ETH-3 1.000 .521 .547 .932 3.77 .733
SEC-1 1.000 .641 .533 .921 2.93 .849
SEC-2 1.000 .554 .531 .807 3.43 .951
SEC-3 1.000 .638 .492 .904 3.04 .964
TRU-1 1.000 .754 .512 .989 3.70 1.163
TRU-2 1.000 .833 .476 .420 3.92 .587
TRU-3 1.000 .594 .694 .816 3.61 1.634
RLB-1 1.000 .569 .686 .510 3.24 .793
RLB-2 1.000 .704 .455 .815 3.82 1.624
RLB-3 1.000 .558 .654 .744 3.21 1.077
RLB-4 1.000 .788 .870 .973 3.52 .545
RSPN-1 1.000 .702 .523 .954 3.21 .932
RSPN-2 1.000 .534 .440 .828 3.83 .921
RSPN-3 1.000 .690 .212 .910 3.52 .972
ASSUR-1 1.000 .698 .580 .922 2.60 .943
ASSUR-2 1.000 .579 .619 .802 2.17 .982
ASSUR-3 1.000 .687 .713 .933 3.41 .926
Item Means: Mean=3.336, Minimum=2.913, Maximum=3.451, Range=.521, Max/Min=1.332, Variance=.023, N=19
Source: Developed by the Researcher; Note: EMP=Empathy; SEC=Security; TRU=Trust; RLB=Reliability; RSP= Responsiveness; ASSUR =Assurance
www.ijaera.org 2015, IJAERA - All Rights Reserved 187 Also the corrected-item-total correlation > 0.5 and inter-item correlation is more than 0.3. Principal component analysis (PCA) was conducted as a means of data reduction, to ascertain if the face validity of the items held [Pallant (2001)]. Prior to performing PCA the suitability of data for factor analysis was assessed. The correlation matrix revealed many coefficients of .3 and above. PCA revealed the presence of components with Eigen values exceeding 1. It is likewise important to mention that corrected-item-total correlation > 0.5 and inter-item correlation >0.3 is good enough for reliability of the scale [Hair et al., (2009)]. The value of communalities using principal component analysis ranged from 0.521 to 0.833. Here, it is apt to mention that commonality >0.5 is sufficient for the explanation of constructs [Hair et al. (2009)]. All these values show factors analysis has extracted good quantity of variance in the items.
According to the scale used if all the 19 items get a rating of 5 each, the total score would be 95. A correlation matrix was constructed using the variables in the questionnaire to show the strength of relationship among the variables considered in the questionnaire. According to Kline (1998), correlation matrix is defined as “a set of correlation coefficients between a number of variables''. Correlations of all variables with each other were examined using Pearson Correlation coefficients. There is a sufficient correlation to go ahead with factor analysis. Factor analysis is performed with varimax rotated, Principal Component Analysis. Correlations among different items were found to be fairly satisfactory as well as significant.
IV. EXTRACTION OF FACTORS
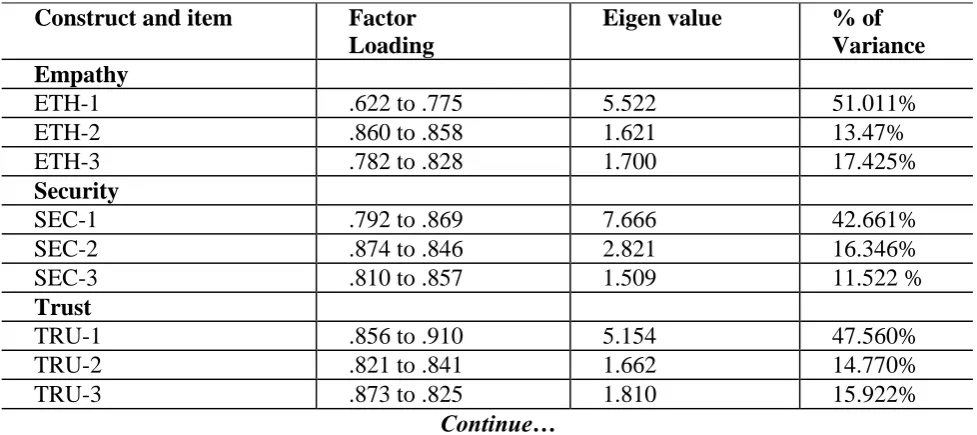
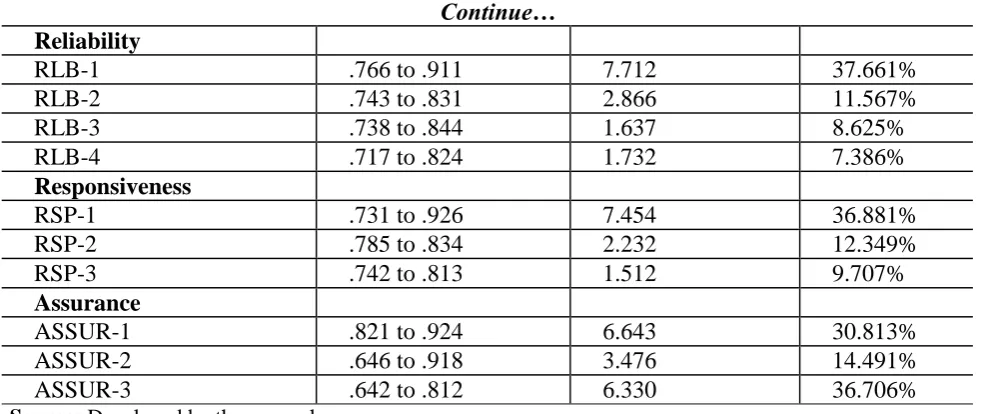
Table 4 shows factor analysis of 53 variables; this analysis extracted 19 factors from these variables. Each component was defined by at least three scale items. Kaiser-Meyer-Olkin (KMO) Measure of Sampling Adequacy (MSA) values was sufficient enough for validating factor analysis results. Here, it is pertinent to mention that KMO>0.6 and P<0.5 are good enough for research in social sciences [Hair et al., (2009)]. The Bartlett's Test of Sphericity also has significant values (p<0.5). All these requirements are sufficient for validating factor analysis. All the factors having loads more than 0.5 are considered good. Items with factor loadings <0.5 were removed.
Table 4: Extracted Factors
% of Variance Eigen value
Factor Loading Construct and item
Empathy
51.011% 5.522
.622 to .775 ETH-1
13.47% 1.621
.860 to .858 ETH-2
17.425% 1.700
.782 to .828 ETH-3
Security
42.661% 7.666
.792 to .869 SEC-1
16.346% 2.821
.874 to .846 SEC-2
11.522 % 1.509
.810 to .857 SEC-3
Trust
47.560% 5.154
.856 to .910 TRU-1
14.770% 1.662
.821 to .841 TRU-2
15.922% 1.810
.873 to .825 TRU-3
www.ijaera.org 2015, IJAERA - All Rights Reserved 188
Continue…
Reliability
37.661% 7.712
.766 to .911 RLB-1
11.567% 2.866
.743 to .831 RLB-2
8.625% 1.637
.738 to .844 RLB-3
7.386% 1.732
.717 to .824 RLB-4
Responsiveness
36.881% 7.454
.731 to .926 RSP-1
12.349% 2.232
.785 to .834 RSP-2
9.707% 1.512
.742 to .813 RSP-3
Assurance
30.813% 6.643
.821 to .924 ASSUR-1
14.491% 3.476
.646 to .918 ASSUR-2
36.706% 6.330
.642 to .812 ASSUR-3
Source: Developed by the researchers
Table 5 shows different ranges of KMO, Bartlett’s test of spericity, Load values and Eigen values of SERVQUAL variables.
Table 5: KMO, Bartlett’s Test of Spericity, Load values and Eigen Values
Empathy Security Trust Reliability Responsiveness Assurance Cronbach’s
alpha
.702 .766 .892 .950 .923 .921
KMO .932 .856 .808 .853 .865 .834
Bartlett’s test of spericity
X2=
4410.110 DF=40
X2=
821.233 DF=58
X2=
902.272 DF=58
X2=
5131.941 DF=137
X2=
6741.33 DF=191
X2=
6774.441 DF=52 Eigen values 1.510 to
5.866 1.643 to 7.745 1.655 to 5.343 1.454 to 6.122
1.454 to 8.541 3.932 to 6.122 Source: Developed by the researchers
V. EXTRACTION OF FACTORS SEM FOR LEVEL OF SATISFACTION IN E-BANKING SERVICES
SEM (structural equation modeling) is an efficient way to find the causal relationships between constructs and their underlying measurement suitability. It includes measurement model and path analysis. Confirmatory factor analysis is employed to test the reliability and validity of the questionnaires after collecting the questionnaires. The loading factor values of each manifest variable are higher than 0.6; suggested threshold value is 0.6 [Bagozzi& Yi (1988)], indicating that internal consistency and convergent validity are good; composite reliability (Construct reliability) and the Cronbach's α value of each construct are higher than 0.8, also the average variance extracted of each construct is greater than 0.5, indicating good reliability.
Path Analysis
www.ijaera.org 2015, IJAERA - All Rights Reserved 189 conducted using a SEM. The values for various fit indices, chi-square, level of significance and effect of factors/items on SERVQUAL variables are shown in table 7. The path loading on Empathy ranged from .91 to 1.0. The path loading of 1.0 for ETH-1 and 0.98 for ETH-2 show that these items play a more important role as compared to other items. The path loading on Security has the range from .85 to 1.00. The maximum loading is for SEC-1 showing the dominance in this factor. Trust has path loading from .95 to 1.00. The results show that the loading of TRU-3 (1.00) played a more dominating role for this factor. All the loading is different and sufficient to explain this factor. The path loading on Reliability has the range from .80 to 1.00. The maximum loading is for RLB-1 showing its dominance in this factor. Responsiveness has path loading from .82 to 1.00. The results show that the RSP-1(1.00) played a more dominating role for this factor. Assurance has path loading from .95 to 1.00. Maximum loading is for ASSUR-2(1.00) shows its dominance.
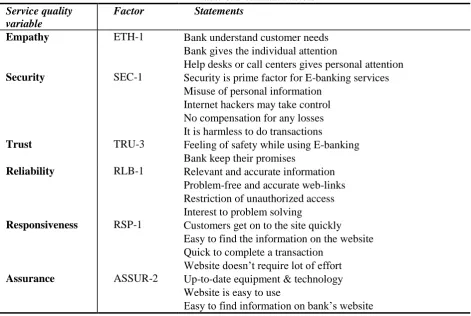
Table 6 shows variables with dominant path loading. After analyzing the data it is clear that customers termed security as prime factor and they are increasingly worried their online accounts. Moreover customers do not feel safe while transacting through online channels. Banks kept their promises by introducing new safety measures but these measures are far from effective in countering latest online threats. This section helped us in understanding the online banking service quality in E-banking and the items which are playing more and less important role towards the satisfaction of respondents for the online services provided by bank.
Table 6: Dominant Factors Service quality
variable
Factor Statements
Empathy ETH-1 Bank understand customer needs Bank gives the individual attention
Help desks or call centers gives personal attention Security SEC-1 Security is prime factor for E-banking services
Misuse of personal information Internet hackers may take control No compensation for any losses It is harmless to do transactions
Trust TRU-3 Feeling of safety while using E-banking Bank keep their promises
Reliability RLB-1 Relevant and accurate information Problem-free and accurate web-links Restriction of unauthorized access Interest to problem solving
Responsiveness RSP-1 Customers get on to the site quickly Easy to find the information on the website Quick to complete a transaction
Website doesn’t require lot of effort Assurance ASSUR-2 Up-to-date equipment & technology
Website is easy to use
www.ijaera.org 2015, IJAERA - All Rights Reserved 190
Effect Estimates for Factors and Variables:
The path analysis conducted using a Structural Equation Modeling technique revealed most of the divergence in the customer satisfaction level. Here, it is also interesting to note that items with very high total effect play a more important role in satisfaction level as compared to other items. The other items also showed significant path loading on satisfaction level.
Table 7: Fit Indices and Guidelines for Model Analysis
Factors/Variables Decisions Effect Estimates
Total Direct Indirect
Security 1 1 0
Trust 0.868 0.819 0
Assurance 0.944 0.934 0
Empathy 0.853 0.856 0
Responsiveness 0.856 0.934 0
Reliability 0.877 0.853 0
ETH-1 1 0 1
ETH-2 0.965 0 0.983
ETH-3 0.873 0 0.933
SEC-1 0.880 0 0.820
SEC-2 0.833 0 0.856
SEC-3 0.961 0 0.975
TRU-1 0.973 0 0.954
TRU-2 0.883 0 0.809
TRU-3 0.914 0 0.854
RLB-1 0.901 0 0.521
RLB-2 0.993 0 0.741
RLB-3 0.978 0 0.888
RLB-4 0.853 0 0.243
RSPN-1 0.745 0 0.935
RSPN-2 0.892 0 0.844
RSPN-3 0.803 0 0.828
ASSUR-1 0.900 0 0.918
ASSUR-2 0.874 0 0.868
ASSUR-3 0.967 0 0.864
Chi square= 361.334, DF= 172, RMR= .075, GFI= .814, AGFI= .845,PGFI= .812, NFI=.573, RFI=.844, IFI= .754, TLI=.854, Significance Level= 0.000
Source: Developed by the Researchers
www.ijaera.org 2015, IJAERA - All Rights Reserved 191 quality in E-banking and the items that are playing more and less important role towards the satisfaction of retail customers.
VI. CONCLUSION, LIMITATIONS AND FUTURE RESEARCH
Despite its growth, E-banking is still avoided by retail customers due to number of factors, primarily because of less secure environment provided by banks. Past research studies also showed concerns over these issues that constituted an obstruction in the usage of E-banking. The path analysis conducted using SEM discovered most of the variance in the E-banking service quality issues. It is essential for the banks to understand specific needs of retail customers. It is also noteworthy for banks to provide accurate information in a problem free web environment; customers’ should be assured of privacy of their data.
This study comprises number of limitations like the study mainly focused on one particular type of domain i.e. retail customers. Generalization of the findings to other service contexts or service areas should be taken with taken into account and would entail additional investigations. Consideration of other regions/states might have interesting findings. Moreover, research studies with much larger sample size would be required to ensure more comprehensive findings of the study.
VII. REFERENCES
[1] Akinci, S., Aksoy, S. and Atilgan, E. (2004). “Adoption of internet banking among sophisticated customer segments in an advanced developing country”. The International Journal of Bank Marketing, Vol. 22(3), p.212-232.
[2] Bagozzi R.P., Yi Y. (1988). On the Evaluation of Structural Equation Models. Journal of the Academy of Marketing Science, Spring, 1988, Volume 16, Issue 1, pp 74-94.
[3] Barnes, S.J., and Corbitt, B. (2003). Mobile banking: Concept and potential, International Journal of Mobile Communications, vol. 1, no. 3, pp. 273-288.
[4] Carlson, Jamie & O'Cass, Aron. (2010). Exploring the relationships between e-service quality, satisfaction, attitudes and behaviours in content-driven e-service web sites. Journal of Services Marketing, 24(2), pp.112 – 127.
[5] Caruana, A. and Malta, M. (2002). Serviceloyalty-The effects of service quality and the mediating role of customer satisfaction. European Journal of Marketing, Vol.36 No.7/8, 2002, pp.811- 828.
[6] Cox, J. and Dale, B.G. (2001). Service quality and ecommerce: An exploratory analysis. Managing Service Quality, 11(2), 121-131.
[7] Cronbach, L.J. (1990). Essentials of Psychological Testing. Harper & Row, New York.
[8] Cronin, J. J. and Taylor, S.A. (1992). Measuring service quality: A reexamination and extension. Journal of Marketing, 56 July, 55-68.
[9] Dabholkar, P.A. (1996), Consumer evaluations of new technology-based self-service options: an investigation of alternative models of service quality. International Journal of Research in Marketing, 13, 29-51.
[10] Furst, K., Lang, W.W. and Nolle, D.E. (2002). “Internet Banking”, Journal of Financial Services Research, Vol.22, pp.95-117.
[11] Hair, J. F., Black, W. C., Babin, B. J., & Anderson, R.E. (2009). Multivariate data analysis. Upper Saddle River, NJ: Prentice Hall.
[12] Ho, C. B., and Lin, W. (2010). Measuring the service quality of internet banking: scale development and validation. European Business Review, 22(1), 5-24 (DOI: 10.1108/09555341011008981.
www.ijaera.org 2015, IJAERA - All Rights Reserved 192 the case of Qatar. International Journal of Islamic and Middle Eastern Finance and Management Vol. 2 No. 4, pp. 338-350, 2009.
[14] Jayawardhena, C. and Foley, P. (2000). Changes in the banking sector- the case of Internet banking in the UK. Internet Research: Electronic Networking Appications and Policy, Vol. 10, No. 1, PP. 13-30.
[15] Johnston R. (1995) "The determinants of service quality: satisfiers and dissatisfiers", International Journal of Service Industry Management, Vol. 6 Issue: 5, pp.53 – 71, Journal of Service Management, http://www.emeraldinsight.com/doi/abs/10.1108/09564239510101536.
[16] Kaynama, S. A., & Black, C. I. (2000). A Proposal to Assess the Service Quality of Online Travel Agencies: An Exploratory Study. Journal of Professional Services Marketing, 21(1), 63.
[17] Khan, M.S., Mahapatra, S.S. and Shreekumar (2009). Service quality evaluation in internet banking: an empirical study in India”. International Journal of Indian Culture and Business Management, Vol.2, No. 1, pp. 30-46.
[18] Kim, M., Kim, J.H. and Lennon, S.J. (2006). Online service attributes available on apparel retail web sites: An ESQUAL approach. Managing Service Quality, 16(1), 51-77.
[19] Kline, R.B. (1998). Principles and practice of structural equation modeling. New York, NY: The Guilford Press.
[20] Li, H. and Suomi, R. (2009). A proposed scale for measuring e-service quality. International Journal of u- and e-service, Science and Technology, 2(1), 1-10.
[21] Malhotra, B. A. (2005), “Electronic retailing”, In M. Krafft & M. K. Mantrala (eds.), Retailing in the
21st Century Current and Future Trends (pp. 309–323). Berlin, Germany: Springer.
[22] Mishra, U.S.(2010). Service quality attributes affecting customer satisfaction in banking sector of India.
European Journal of Economics, Finance and Administrative Sciences Issue 24 (2010).
[23] Mols, N. P. (2000). The Internet and banks strategic distribution channel decisions. Internatinal Journal of Bank Marketing, Vol.17, No.6, pp.295-300.
[24] Morre, C.D. (1987). “Outclass the Competition with Service Distinction”, Mortgage Banking, Vol.47, No.11.
[25] Oliveira, P., Roth, A.V. and Gilland, W. (2002). Achieving competitive capabilities in e-services.
Technological Forecasting and Social Change, 69(7), 721-39.
[26] Padmanabhan G. (2012). Techno-banking–prospects and challenges, RBI bulletin.Retrieved from http://www.rbi.org.in/scripts/BS_ViewBulletin.aspx?Id=13746, March 2013.
[27] Pallant, J. (2001). SPSS Survival Manual: A step-by-step guide to data analysis using SPSS, Open University Press, Buckingham.
[28] Parasuraman, A., Zeithaml, V.A. and Berry, L.L. (1985), “A conceptual model of service quality and implications for future research”, Journal of Marketing, Vol. 49, Fall, pp. 41-50.
[29] Parasuraman, A. and Zinkhan, G. (2002). Marketing to and serving customers through the internet: an overview and research agenda. Journal of the Academy of Marketing Science, 30(4), 286-95.
[30] Parasuraman, A., Zeithaml, V.A. and Malhotra, A. (2005). E-S-QUAL: a multiple-item scale for assessing electronic service quality. Journal of Service Research, 7(3), 213-33.
[31] Santos, J. (2003). E-service quality: a model of virtual service quality dimensions. Managing Service Quality, 13(3), 233 – 246.
[32] Spreng, R.A., & Mackoy, R.D. (1996). An empirical examination of a model of perceived service quality and satisfaction. Journal of Retailing, 72(2), 201-14.
[33] Sylvie, R. and Ina, F. (2010). A new measure of e-service quality in France, International Journal of Retail & Distribution Management, 38(7), 497-517.
[34] Thakur, S. (2010). Service quality, customer satisfaction and customer loyalty: A Study with Special Reference to Indian Banking Industries. Indian Journal of Marketing, Vol.40, No.5, 2010.
[35] Wolfinbarger, M.F. and Gilly, M.C. (2002). COMQ: Dimensionalizing, measuring and predicting quality of the e-tailing experience. Working paper, Marketing Science Institute, Cambridge MA, 151.
www.ijaera.org 2015, IJAERA - All Rights Reserved 193 Proceedings of the EMAC Conference, 811 May 2001, Bergen.
[37] Yang, Z. and Fang, X. (2004). Online service quality dimensions and their relationships with satisfaction: A content analysis of customer reviews of securities brokerage services. International Journal of Service Industry Management, 15(3), 3023-26.17.
[38] Yang, Z., Peterson, R.T. and Cai, S. (2003). Services quality dimensions of Internet retailing: An exploratory analysis. Journal of Services Marketing, 17(7), 685-701.
[39] Zeithaml, V.A. (2002). Service excellence in electronic channels. Managing Service Quality, 12(3), 135138.