Nonlinear Analysis of RC Beam for Different
Shear Reinforcement Patterns by Finite
Element Analysis
I. Saifullah
1*, M.A. Hossain
2, S.M.K.Uddin
3, M.R.A. Khan
4and M.A. Amin
5 1,2,3Department of Civil Engineering, Khulna University of Engineering & Technolog y (KUET), Khulna-9203, Bangladesh, email: [email protected]*
4,5
Undergraduate student, Department of Civil Engineering, Khulna University of Engineering & Technology (KUET), Khulna-9203, Bangladesh.
Abstract-- S everal methods have been utilized to study the response of concrete structural components. Experimental based testing has been widely used as a means to analyze individual elements and the effects of concrete strength under loading. The use of finite element analysis to study these components has also been used. This paper focuses on the behavior of reinforced concrete beam for different pattern of shear reinforcement to evaluate the effective shear reinforcement pattern and also compare the variation in behavior of reinforced concrete beam for with and without shear reinforcement with a simulation. To carry out the analysis, six 3D beams without and with different patterns of shear reinforcement is built using comprehensive computer software ANS YS 10 © 2005 S AS IP, Inc package. The static non linear analysis is done to find out ultimate capacity, formation of first crack and its distance from support, initiation of diagonal crack and its distance from support. Load deflection response was also closely observed and compared with the result from theoretical calculation. From close observation of analyses results it was found that all types of web reinforcements were almost same effective for static loading condition.
Index Term-- ANS YS , shear reinforcement, finite element analysis, diagonal crack.
I. INTRODUCTION
Concrete structural components exist in buildings and bridges in different forms. Understanding the response of these components during loading is crucial to the development of an overall efficient and safe structure. Different methods have been utilized to study the response of structural components. Experimental based testing has been widely used as a means to analyze individual elements and the effects of concrete strength under loading. While this is a method that produces real life response, it isextremely time consuming, and the use of materials can be quite costly. The use of finite element analysis to study these components has also been used. Unfortunately, early attempts to accomplish this were also very time consuming and in feasible using existing software and hardware.
When a simple beam is loaded, bending moments and shear forces develop along the beam. To carry the loads safely, the beam must be designed for both type of forces. Flexural design is considered first to establish the dimensions of the beam section and the main reinforcement needed. The beam is then designed for shear. If shear reinforcement is not
provided, shear failure may occur. Shear failure is characterized by small deflections and lack of ductility, giving little or no warning before failure [1]. On the other hand, flexural failure is characterized by a gradual increase in deflection and cracking, thus giving warning before total failure. This is due to ACI Code limitation on flexure reinforcement. The Design for shear must ensure that shear failure does not occur before flexural failure [1]. The use of FEA has been the preferred method to study the behavior of concrete (for economic reasons). With the advent of sophisticated numerical tools for analysis like the finite element method (FEM), it has become possible to model the complex behavior of reinforced concrete beams [2].
In recent years, however, the use of finite element analysis has increased due to progressing knowledge and capabilities of computer software and hardware. It has now become the choice method to analyze concrete structural components. The use of computer software to, model these elements are much faster, and extremely cost-effective. To fully understand the capabilities of finite element computer software, one must look back to experimental data and simple analysis. Data obtained from a finite element analysis package is not useful unless the necessary steps are taken to unders tand what is happening within the model that is created using the software. Also, executing the necessary checks along the way is key to make sure that what is being output by the computer software is valid. By understanding the use of finite element packages,
more efficient and better
analyses can be made to fully understand the response of individual structural components and their contribution to a structure as a whole. This paper focuses on the behavior of reinforced concrete beam for different pattern of shear reinforcement to evaluate the effective shear reinforcement pattern and also compare the variation in behavior of reinforced concrete beam for with and without shear reinforcement with a simulation.
II. SCOPE
includes providing the principles and guidelines to aid in the optimization in a easier manner. The paper may also provide low laborious procedure for modeling of versatile RCC like structure.
III. EXPERIM ENTAL STUDY
A. CRACKS IN CONCRETE MODEL
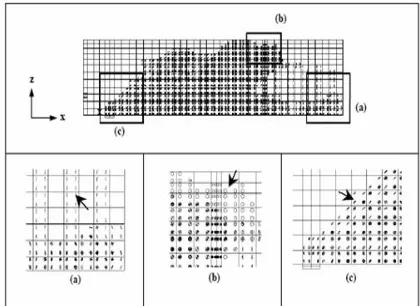
Concrete crack plots were created at different load levels to examine the different types of cracking that occurred within the concrete as shown in Fig. 1. The different types of concrete failure that can occur are flexural cracks, compression failure (crushing), and diagonal tension cracks. Flexural cracks (Fig. 1a) form vertically up the beam. Compression failures (Fig. 1b) are shown as circles. Diagonal tension cracks (Fig. 1c) form diagonally up the beam towards the loading that is applied. Crack develops in concrete element when the concrete element stress exceeds modulus of rupture of concrete (tensile strength of concrete). Crash develops in concrete element when the concrete element stress exceeds compressive crashing strength of concrete. This study indicates that the use of a finite element program to model experimental data is viable and the results that are obtained can indeed model reinforced concrete beam behavior reasonably well.
Fig. 1. T ypical Cracking Signs in Finite Element Models: a) Flexural Cracks, b) Compressive Cracks, c) Diagonal Tensile Cracks (Kachlakev, et al. 2001)
B. FAILURE CRITERIA FOR CONCRETE The model is capable of predicting failure for concrete materials. Both cracking and crushing failure modes are accounted for. The two input strength parameters i.e., ultimate uniaxial tensile and compressive strengths are needed to define a failure surface for the concrete. Consequently, a criterion for failure of the concrete due to a multiaxial stress state can be calculated (William and Warnke 1975). A three-dimensional failure surface for concrete is shown in Fig. 2.
Fig. 2. 3-D failure surface for concrete (William and Warnke 1975)
C. Finite Element Modeling of Steel Reinforcement Tavarez (2001) discusses three techniques that exist to model steel reinforcement in finite element models for reinforced concrete is shown in fig. 3: the discrete model,
the embedded model, and the smeared model.
Fig. 3. Models for Reinforcement in Reinforced Concrete (Tavarez 2001): (a) discrete; (b) embedded; and (c) smeared
D. ANSYS FINITE ELEMENT MODEL
TABLE I
ELEMENT TYP ES FOR WORKING MODEL
Material Type ANSYS Element
Concrete Solid65
Steel Plates and
Supports Solid45
E. REAL CONSTANTS
The real constants for this model are shown in Table II. Note that individual elements contain different real constants. No real constant set exists for the Solid65 element.
TABLE II
REAL CONSTANT FOR MODEL
F.MATERIAL PROPERTIES
Parameters needed to define the material models can be found in Table III.
TABLE III
MATERIAL MODELS FOR THE CALIBRATION MODEL
M a te ri a l M o d e l N u m b e r E le m e n t T y p e
Material Properties
1 S o li d 6 5
Linear Isotropic
EX 3604974.865
PRXY 0.25
Multilinear Isotropic Strain (in/in)
Stress (psi) Point 1 0.00049931 1800 Point 2 0.00065 2158.06 Point 3 0.00080 2552.24
Point 4 0.001 2996.43
Point 5 0.0012 3347.11
Point 6 0.0014 3609.99
Point 7 0.0016 3794.94
Point 8 0.0018 3913.71
Point 9 0.002 3978.22
Point 10 0.0022 3999.57 Point 11 0.002219 4000
Point 12 0.003 4000
Concrete
ShrCf-Op 0.3
ShrCf-Cl 1
UnTensSt 474.34
UnCompSt -1
BiCompSt 0
HydroPs 0
BiCompSt 0
UnTensSt 0
TenCrFac 0
2 S o li d 4 5
Linear Isotropic
EX 29,000,000 psi
PRXY 0.3
3
L
in
k
8
Linear Isotropic
EX 29,000,000
psi
PRXY 0.3
Bilinear Isotropic Yield Stress 60,000 psi
Tangent
Modulus 2,900 psi
The Solid65 element requires linear isotropic and multi-linear isotropic material properties to properly model concrete. The multi-linear isotropic material uses the von
R e a l C o n st an t se t E le m e n t T y p e Constants 1 S o li d 6 5 R e a l C o n st a n ts fo r R e b a r 1 R e a l C o n st a n ts fo r R e b a r 2 R e a l C o n st a n ts fo r R e b a r 3 M a te ri a l N u m b e r
0 0 0
V o lu m e R a ti o
0 0 0
O ri e n ta ti o n A n g le
0 0 0
O ri e n ta ti o n A n g le
0 0 0
2 S o li d 4
5 Cro
ss -se c ti o n a l A re a , (i n 2 ) 1.0 In it ia l S tr a in (i n ./ in .) 0 3 L in k
8 Cro
Mises failure criterion along with the Willam and Warnke (1975) model to define the failure of the concrete. EX is the modulus of elasticity of the concrete (Ec), and PRXY is the Poisson‟s ratio (µ). The modulus of elasticity was based on the equation,
Ec = 57000√f’c (1)
with a value of f’c equal to 4,000 psi. Poisson‟s ratio was assumed to be 0.25. The compressive uniaxial stress -strain relationship for the concrete model was obtained u sing the following equations to compute the multi-linear isotropic stress-strain curve for the concrete (MacGregor 1992)
(2)
(3)
(4)
Where;
f = stress at any strain ε, psi ε = strain at stress f
= strain at the ultimate compressive strength, f’c
The multi-linear isotropic stress -strain implemented requires the first point if the curve to be defined by the user. It might satisfy Hook‟s Law;
(5)
The multi-linear curve is used to help with convergence of the nonlinear solution algorithm.
Fig. 4. Uniaxial Stress-Strain Curve
Fig. 4 shows the stress-strain relationship used for this study and is based on work done by Kachlakev,et al. (2001). MacGregor Nonlinear model curve Point 1, defined as ' 0.45 fc’ is calculated in the linear range (Equation 4). Other
points are calculated from Equation 2 with ε0 obtained from
Equation 3.Last point is defined at f‟c and ε0=0.003 in./in.
indicating traditional crushing strain for unconfined concrete.
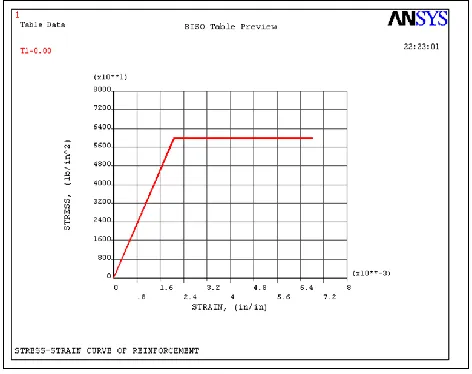
Fig. 5. Idealized Stress-Strain Curve of Reinforcing Steel
G. MODELING
Fig. 6. T ypical Beam Dimensions
Fig. 8. Different types of shear reinforcements
Fig. 9. Reinforcement Detailing for Beam Model
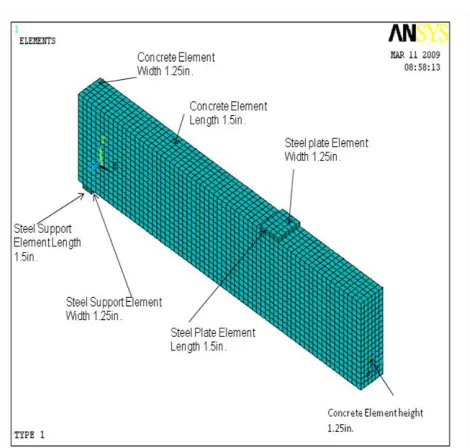
Fig. 10. Mesh of the Concrete, Steel Plate and Steel Support
Link8 elements were used to create the flexural and shear reinforcement. Only half of the stirrup is modeled because of the symmetry of the beam. Fig. 10 illustrates that the rebar shares the same nodes at the points that it intersects the shear stirrups. The element type number, material number, and real constant set number for the calibration model were set for each mesh as shown in Table IV.
Fig. 11. Reinforcement Configuration and Meshing for T ype 1 TABLE IV
MESH ATTRIBUTES FOR THE MODEL
M
o
d
e
l
P
a
rt
s
E
le
m
e
n
t
T
y
p
e
M
a
te
ri
a
l
N
u
m
b
e
r
R
e
a
l
C
o
n
st
a
n
t
S
e
t
Concrete Beam 1 1 1
Steel Plate 2 2 N/A
Steel Support 2 2 N/A
Longitudinal
Reinforcement 3 3 2
Shear
Reinforcement 3 3 3
Fig. 12. Reinforcement Configuration and Meshing for without shear reinforcement
Fig. 14. Reinforcement Configuration and Meshing for T ype 3
Fig. 15. Reinforcement Configuration and Meshing for T ype 4
Fig. 16. Different Patterns of Shear Reinforcement in ANSYS
III. ANALYTICAL STUDY
For this purpose it is eventual to compare the develop model with an existing one. And here this simulation was made by using the data given by „Anthony J. Wolanoski B.S.‟ in his thesis paper [2]. Where, he used following specification -
1. Beam size – The width and height of beam were 10 in. and 18 in respectively
2. Clear span length – 15 ft 3. Area of steel – 0.93 in.2
4. Yield Stress of Steel, f
y= 60,000 psi
5. 28-days Compressive Strength of Concrete, f’c = 4800 psi
The detail of Wolanoski‟s beam and also the beam for simulation is given below:
Fig. 17. Reinforcement Detailing of Wolanoski‟s Beam
Fig. 18. Load-Deflection curve comparison of ANSYS and Backouse (1997) [2]
The graph of present analysis of Wolanoski‟s thesis is given bellow:
Fig. 19. Load-Deflection Curve after simulation
TABLE V
COMP ARISON BETWEEN ANTHONY J.WOLANOSKI ANALYSIS AND
P RESENT STUDY BY ANSYS
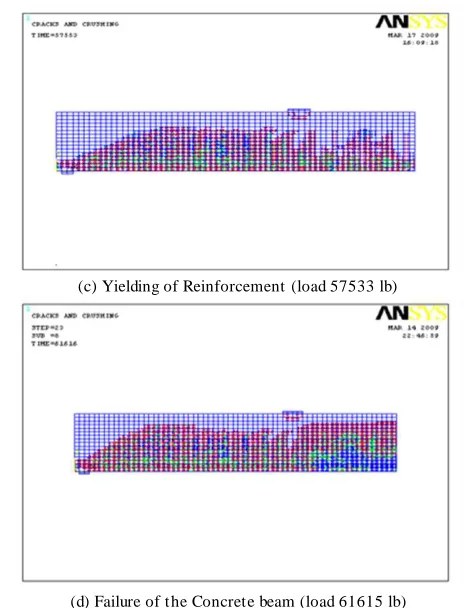
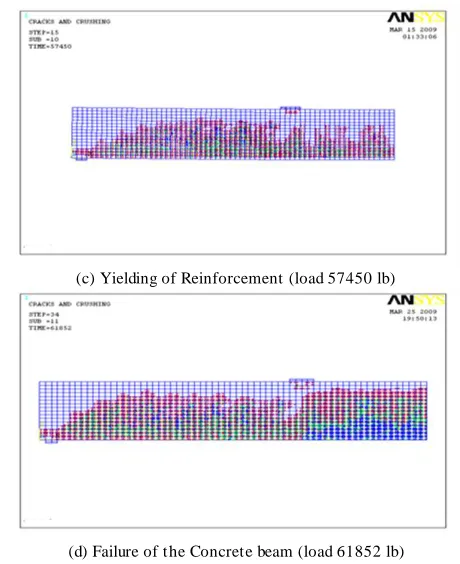
A. CRA CK DEV ELO PED IN THE CON CRE TE BEA MS At first the crack is forme d in the concrete beams because of flexural stress. For the increasing of loads the diagonal tension crack is initiated after the formation of 1st crack. The crack increase with the increase of loads and the steel stress reach to its yielding stress. The failure of concrete beams also obs erves by the formation of crack which is shown in fig.s 20, 21, 22, 23 and 24.
(a) 1st Crack of t he Concrete Model (load 9686 lb)
(b) Initiation of Diagonal T ension crack (load 20423 lb)
(c) Yielding of Reinforcement (load 57533 lb)
(d) Failure of t he Concrete beam (load 61615 lb)
Fig. 20 (a),(b),(c)&(d). Represents Cracks Formation in Beam of present study for Without Shear Reinforcement in different stages during the
application of load
(
a) 1st Crack of the Concrete Model (load 9658 lb)
(b) Initiation of Diagonal T ension crack (load 23048 lb)
M o d e l E x tr e m e T e n si o n F ib e r S tr e ss ( p si ) R e in fo rc e m e n t S te e l S tr e ss ( p si ) C e n te rl in e D e fl e c ti o n ( in ) L o a d a t F ir st c ra c k in g ( lb ) F ro m t h e si s p a p e r o f A n th o n y J . W o la n o sk i B .S . [2
] Ma
(c) Yielding of Reinforcement (load 57898 lb)
(d) Failure of t he Concrete beam (load 62020 lb)
Fig. 21. (a),(b),(c)&(d) represents Cracks Formation in Beam of present study for Shear Reinforcement T ype 1 in different stages during the
application of load
(a) 1st Crack of t he Concrete Model (load 9646 lb)
(b) Initiation of Diagonal T ension crack (load 19949 lb)
(c) Yielding of Reinforcement (load 57450 lb)
(d) Failure of t he Concrete beam (load 61852 lb)
Fig. 22. (a),(b),(c)&(d) represents Cracks Formation in Beam of present study for Shear Reinforcement T ype 2 in different stages during the
application of load
(a) 1st Crack of the Concrete Model (load 9657 lb)
(c) Yielding of Reinforcement (load 57576 lb)
(d) Failure of t he Concrete beam (load 61880 lb)
Fig. 23. (a),(b)(c)&(d) represents Cracks Formation in Beam of present study for Shear Reinforcement T ype 3 in different stages during the
application of load
(a) 1st Crack of t he Concrete Model (load 9658 lb)
(b) Initiation of Diagonal T ension crack (load 20313 lb)
(c) Yielding of Reinforcement (load 57451 lb)
(d) Failure of the Concrete beam (load 61964 lbs)
Fig. 24. (a),(b),(c)&(d) represents Cracks Formation in Beam of present study for Shear Reinforcement T ype 4 in different stages during the
application of load
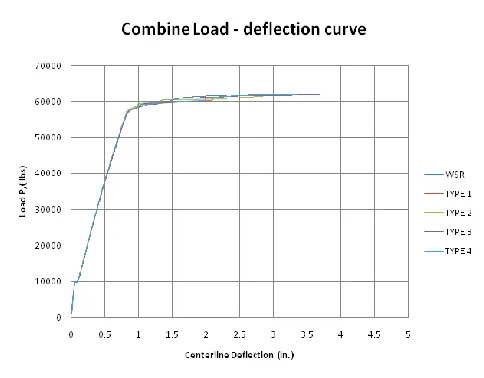
B. LOAD-DEFLECTION CURVE
Fig. 25. Combined Load-Deflection Curve for Different patterns of shear Reinforcement
IV. RESULTS AND DISCUSSIONS
TABLE VI
CRACK FORMATION AND DISTANCE OF CRACK FROM SUP P ORT AND
DEFLECTION AT FAILURE LOADS ON THE BASIS OF ANALYSIS
Type
1st crack
In it ia ti o n o f d ia g o n a l te n si o n c ra c k L o a d a t F a il u re ( lb ) D e fl e c ti o n a t F a il u re ( in .) L o a d (l b ) D is ta n c e f ro m su p p o rt ( in .) L o a d s ( lb ) D is ta n c e fr o m su p p o rt ( in .) W it h o u t sh e a r re in fo rc e m e n t
9686 78 20423 51 61616 2.3
1 T y p e 1
9658 75 23048 33 62020 4.0
3 4 0 T y p e 2
9646 82
.5
19949 42 61852 3.3
8 8 5 T y p e 3
9657 75
.7
5
17453 3
7
.5
61880 3.6
8 7 9 T y p e 4
9658 75 20313 36 61964 3.4
6
0
8
TABLE VII
COMP ARISON BETWEEN THEORETICAL CALCULATION AND ANSYS
TABLE VIII
FORMATION OF 1ST CRACK AND RESP ECTIVE DEFLECTION &STEEL
STRESS IN FINITE ELEMENT ANALYSIS
M
o
d
e
l Rein
fo rc in g (m a in b a r) S te e l S tr e ss (p si ) C e n te rl in e D e fl e c ti o n (i n .) L o a d a t F ir st C ra c k ( fl e x u re c ra c k ) (l b ) * M a n u a l C a lc u la ti o n A N S Y S * M a n u a l C a lc u la ti o n A N S Y S * H M a n u a l C a lc u la ti o n A N S Y S W it h o u t S h e a r R e in fo rc e m e n t 2 7 7 2 .3 4 2 7 8 8 .0 0 .0 5 3 9 4 0 .0 5 4 7 8 6 9 4 4 5 .5 9686 T y p e 1 2 7 8 8 .4 0 .0 5 4 7 9658 T y p e 2 2 7 8 8 .5 0 .0 5 4 7 5 1 9646 T y p e 3 2 7 8 8 .6 0 .0 5 4 7 5 0 9657 T y p e 4 2 7 8 8 .5 0 .0 5 4 7 4 8 9658 Model L o a d a t F ir st C ra c k ( lb ) C e n te rl in e D e fl e c ti o n ( in .) R e in fo rc in g S te e l S tr e ss ( p si ) Without Shear
Reinforcement 9686 0.056181 2859.0
Type 1 9658 0.064117 3870.0
Type 2 9646 0.057770 3077.0
Type 3 9657 0.058253 3138.3
TABLE IX
FLEXURAL STEEL STRESS ON THE BASIS OF ANALYSIS
M o d e l S te e l S tr e ss a t y ie ld in g o f st e e l (p si ) D e fl e c ti o n a t y ie ld in g o f st e e l (i n .) L o a d s o n b e a m a t y ie ld in g o f st e e l (l b ) S te e l S tr e ss a t fa il u re ( p si ) L o a d s o n b e a m a t fa il u re ( lb ) * T h e o re ti c a l c a lc u la ti o n 60000 - 57703 - - W it h o u t sh e a r re in fo rc e m e n t 60009 0 .8 5 8 3 5 0
57533 60108 62020
T
y
p
e
1
60010 0.9
1
7
1
4
57898 60143 62020
T y p e 2 60004 0 .8 2 9 5 7 8
57450 60163 61852
T y p e 3 60010 0 .8 8 4 7 3 6
57576 60114 61880
T y p e 4 60004 0 .8 5 5 7 5 2
57451 60128 61964
A. COMPARISON
From another thesis group [7] performing on “Experimental and Analytical Investigation of Flexural Behavior of Reinforced Concrete Beam” got the results as follows:
TABLE X
1ST CRACK FORMATION DISTANCE FROM SUP P ORT (WITHOUT SHEAR REINFORCEMENT)[7]
From present analysis:
TABLE XI
1ST CRACK FORMATION DISTANCE FROM SUP P ORT FOR THIS ANALYSIS
B. COMMENTS ON RESULTS
Initiation of diagonal tension crack occurs in Type 1 at larger loads in compare to others.
For the beam without shear reinforcement diagonal tension crack initiates at larger distance from support with compared to others.
The ultimate load carrying capacity is larger for Type 1 with respect to other types and also showing large deflection for its better ductile property.
Theoretical calculation and ANSYS analysis give almost same results for steel stressing at 1st crack.
At steel yielding the steel stress is almost same to the theoretical value. These data was collected from ANSYS output after analysis.
Steel stress at failure is maximizing for Type 2 shear reinforcement. These data was collected from ANSYS output after analysis.
Compare with another group, the behavior of 1st crack formation, is found satisfactory level.
From combined load deflection curve, the 1st cracking point and the steel yielding point for with and without different patterns of shear reinforcement are almost same.
V. CONCLUSION
The project emanated with an aim to find out the ultimate load carrying capacity of beams of without and with different patterns of shear reinforcements and also find out the different behaviors of beams for different stages of loading. The project is expected to generate reasonable solutions of focused problem defined under some parametric condition. Initially some parameters are chosen for these beams by analysis with finite element method. The ultimate load carrying capacity is then determined by without considering and considering different patterns of shear reinforcement with a constant flexural reinforcement. After completing the analysis curves are drawn for without and with different patterns of shear reinforcement, to find out various parameters (1st crack formation in beams, initiation
1st Crack Formation Distance from Support
Without shear
reinforcement 0.413L
Type 1 0.396L
Type 2 0.437L
Type 3 0.401L
Type 4 0.396L
1st Crack Formation Distance from Support
Lab Test 0.421L
of diagonal cracks, failure load etc.) for finding effective shear reinforcement pattern for beam to this loading condition. Also a simulation and comparison to another group is done to the satisfactory use of finite element modeling in structural components. The following conclusion can be stated based on the evaluation of the analyses:
ANSYS 3D concrete element is very good concerning the flexural and shear crack development but poor concerning the crushing state. However this deficiency could be eas ily removed by employing a certain multi-linear plasticity options available in ANSYS.
From close observation of analyses results it can be concluded that all types of web reinforcements are almost same effective for static loading condition.
VI. REFERENCES
[1] Nilson, Arthur H.; Darwin, David; Dolan Charles W., 2006 “Design Of Concrete Structures”, McGraw-Hill, 13th Edition.
[2] Wolanski, Anthony J., B.S., 2004, “ Flexure Behavior of Reinforced and Prestressed Concrete Beams Using Finite Element Analysis”, Faculty of Graduate School, Marquette University, Milwaukee, Wisconsin, May.
[3] SAS (2005) ANSYS 10 Finite Element Analysis System, SAS IP, Inc.
[4] Hossain, M. Nadim, 1998, “ Structural Concrete; T heory & Design”, Addison-Wesley Publishing Company.
[5] Nakasone, Y., Yoshimoto, S., Stolarski, T . A., 2006, “ENGINEERING ANALYSIS WIT H ANSYS SOFT WARE”, ELSEVIER, 1st Published.
[6] Kachlakev, D.; Miller, T.; Yim, S., May, 2001, “Finite Element Modeling of Reinforced Concrete Structures Strengthened With FRP Laminates”, California Polytechnic State University, San Lius Obispo, CA and Oregon State University, Corvallis, OR for Oregon Department of T ransportation, May.
[7] Nasir-Uz-Zaman, M, Sohel Rana, M, 2009 “Experimental And Analytical Investigation of Flexural Behavior of Reinforced Concrete Beam”, Undergraduate Thesis Report, Department of Civil Engineering, Khulna University of Engineering and T echnology, Khulna, April.
[8] Willam,K. J. and Warnke, E. P. (1975), “ Constitutive models for the triaxial behavior of concrete”, Proceedings of the International Assoc. for Bridge and Structural Engineering , vol 19, pp. 1- 30.
[9] Murdock, L. J., Brook, K. M. and Dewar, J. D., “Concrete: Materials and Practice”, 6th Edition, Edward Arnold, London, 1991