Abstract—In recent years, road register has been drawn and recorded in order to determine various road statuses. The data includes road names, investigated data, starting and ending point of the road, the road intersecting point, etc. Importantly, to undergo road maintenance, annual corrections for work and road facilities are necessary. Also, research in the utilization of point cloud data in diverse fields is currently being examined. In previous studies, the authors have been applying point cloud data to numerous stages of construction life cycle management. This paper will reveal the utilization of point cloud data by using the editor system the authors have constructed. Finally, the authors put this system into practice on road surface data, determined possible outcomes for road maintenance in road registration, and demonstrated a range of possibilities of using point cloud data in various considerations and discussions.
Index Terms—Attributes assign data, editor system, point cloud data, road maintenance.
I. INTRODUCTION
Since the early introduction of point cloud data, it has been used in several fields such as architecture, civil engineering, etc. Current research regarding point cloud data is mainly about the surface reconstruction of various structures in order to understand the various reconstruction algorithms and the creation of a 3D model of an object constructed from point cloud data. Unfortunately, research regarding the use of point cloud data in construction life cycle management like in Japan is rarely found. As a matter of fact, Japanese researchers have long been applying point cloud data for the use in design, construction, and maintenance stages.
In their previous research studies, the authors have made an attempt to extract the road network pattern from the data captured from the aerial laser profiler, thereby making an improvement of the visual range by using the MMS data and analyzing the rock falls [1]-[3]. In addition, the authors have added the possibility of using point cloud data at the preliminary design consultation [4] and edited the attributes of point cloud data through manual operation to expand the scope of its usability.
Other Japanese researchers have also used point cloud data in a vast variety of fields. For example, Kamei and others made an effort to extract the data of the power poles from the one measured by using MMS [5]. Ikeda and others have suggested using the classification technique on each of the structures around the roads [6]. Another group of authors have used the diagrammatic elevation point cloud data
Manuscript received May 10, 2014; revised August 13, 2014.
The authors are with School of Science and Technology in Kumamoto University, Japan (e-mail: [email protected], [email protected], [email protected], [email protected]).
obtained from MMS and fixed laser survey to distinguish the attributes of the roads and the structures around them by the location data [7]. Other researchers have also perceived the location of the structures by color information [8]. Based on these studies, the findings revealed that there are many possibilities in using point cloud data. As a consequence, the authors in the present study have created a point cloud data editor system to further widen the use of point cloud data.
At present, road surface data management in Japan is being handled by using road register. There are not many problems concerning road register, but its usage is still insufficient. Since road register uses a two-dimension-based data, it is difficult to see surrounding objects and a cross-profile view of the location. Also, the data concerning road register is improperly organized. The authors in this study are hence proposing the use of point cloud data in road register which can bring about better road surface data management. By this means, the authors developed a point cloud data editor and combined it with an attribute analysis method for the improvement of the current status of road surface data management.
II. USE OF POINT CLOUD DATA IN ROAD MAINTENANCE
A. Road Maintenance
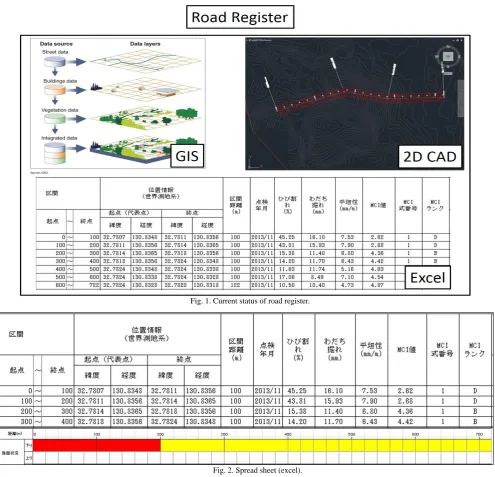
Currently, road register is being used for road maintenance. Three elements—spread sheet (Excel), two-dimensional CAD, and GIS (Geographic Information System)—are deployed for road register as can be seen in Fig. 1.
1) Spreadsheet (excel)
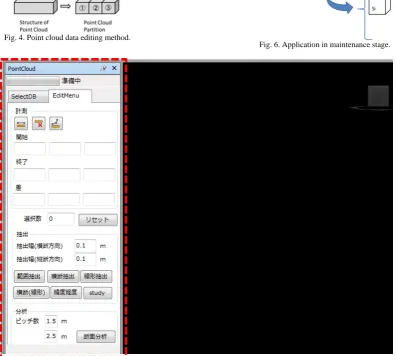
Spreadsheet is being used as a data table which consists of road names, analyzed data, starting and ending point of the road, the road intersecting point, etc. Spreadsheet is a generalized and simplified form of the data and can be used in many projects such as geographical cube models, etc. However, with spreadsheet, it is difficult to understand the location and the elevation surface of the road. A sample of spreadsheet being used in Japan is shown in Fig. 2.
2) Geographic information system (GIS)
GIS is a system which provides data of maps and drawings of the Earth. It is possible to integrate all the data inside GIS, but the re-production of the road state and the elevation view of the road surface data are very weak. It is possible to connect the maintenance data and location data together, but such data is used during the maintenance phase only. On the one hand, objects such as street lights, trees, and mirrors are difficult to identify in GIS. As a result, it is not convenient to operate the data in the road surface data management. On the other hand, point cloud data has a better understanding in
Development of Attribute-Assign-Editor for Road Surface
Point Cloud Data
elevation view as well as cross and profile section of the object. As the point cloud data does not contain any attributes, it is troublesome to distinguish the data set.
B. The Use of Point Cloud Data
Point cloud data is a very high accuracy 3D external surface data of an object that comes with two types of information: 3D coordinating (x, y, z) and color (r, g, b) as seen in Fig. 3. Point cloud data is acquired by using 3D survey equipment such as a laser profiler, MMS, a fixed laser survey, Field Viewer, etc.
1) Challenges
Due to the fact that the point cloud data itself does not contain any attributes, this leads to difficulties in many fields. For example, it is possible to analyze the road surface point
cloud data for MCI (Maintenance Component Index), but point cloud data lacks the MCI attribute; therefore, it is incredibly difficult to visualize the actual state of the road. It is also possible to analyze the data in the spreadsheet or the data derived from GIS. The deliverables are changeable according to the level of importance set by the owners. However, it takes time to process a large amount of data. Due to these crucial issues, the point cloud data is considered to have low usability and is adopted in only visualization of the existing structure or the planned drawing. Such concern leads to its limited usage in construction life cycle management.
2) Advantages in using point cloud data
Fig. 1. Current status of road register.
Fig. 2. Spread sheet (excel).
In the first research study, the point cloud data is used in the design stage. The result indicated that it is easy for point cloud data to be reproduced on the drawings of street plans, underground-installed objects, to mention a few. Because of that, the authors can see the geomorphic expression and a 3D
model in a more detailed form.
their most recent study, the authors have developed an editing system of point cloud data.
Fig. 3. Point cloud data.
Fig. 4. Point cloud data editing method.
Fig. 5. Application in construction stage.
Fig. 6. Application in maintenance stage.
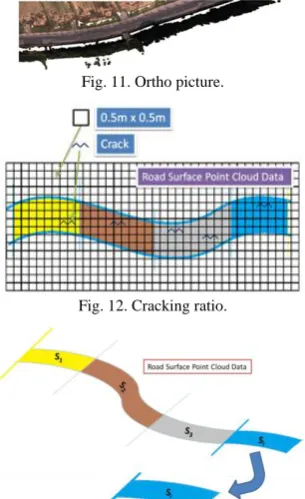
Fig. 7. Maintenance data output tool plus (MDot+).
In the current study, the authors hence intend to apply this editing system to the maintenance stage of the construction life cycle management—whereas α, β, and γ stand for attributes Fig. 6. With a hope for a better result by using point cloud data, the authors believe that the editing system thereof can help to improve the road register at the maintenance stage of the construction life cycle management.
C. The Analysis and Partition of Point Cloud Data
From the results of previous research, the authors have conducted analysis and the partition of road surface point cloud data in order to determine MCI of the road. By using 3D viewer software to view the road surface data, it is possible to do the visualization and check the elevation view of the road. Furthermore, it is possible to determine the profile and cross section of the road surface data. An add-in tool is used for visualization of the road maintenance data
information.
III. DEVELOPMENT OF ATTRIBUTE ASSIGNED SYSTEM
A. System Introduction
will be computed using the ortho pictures obtained from MMS calculated by mesh method. Subsequently, the authors are going to explain how this editor works by applying it to a particular site in the domain of partition function, analyzer and attributes, among many other things.
B. Analysis and Editing Functions 1) Analysis function
a) Rutting
Rutting is a track in the ground which is made by the passage of a vehicle or vehicles. The amount of rutting is the depth of the track created due to the friction between the road surface and the tire of a vehicle. The equation for rutting is shown below (see Fig. 9).
(1a) (1b)
where, a: the estimated value of slope of the straight line on a flat road surface, b: the estimated value of the intercept of the straight line on a flat road surface, xi: distance of the clustered points on the road surface, zi: the height of clustered points on the road surface, n: the number of clustered points on road surface.
By using these two equations and the location of the tire, the rutting volume, Wi, can be determined.
b) Flatness
Flatness of the road surface is the standard deviation value of the elevation level difference between the flat pavement and the assumed value of the actual road surface. This value is an important indicator of road surface shape management which represents the amount of unevenness of the road surface. The equation used in calculating the flatness is shown below (Fig. 10).
Fig. 8.Processof MDot+.
Fig. 9.Rutting.
1 ) ( 2 n Z Z n i ave i
(2) where, σ: flatness (mm/m), Z: the average value of the difference elevation between reference line and discharge site, n: the number of data
c) Cracking ratio
The cracking ratio is easily obtained from dividing the area under investigation by the area that contains the crack. However, the current MMS technology cannot reach the depth of the crack. Thus, in the current case study, the cracking ratio is obtained using ortho pictures which are produced by the front and back camera installed in MMS as shown in Fig. 11. The cracking ratio is calculated using the formula shown below (Fig. 12).
N
b b
b
C 10.6 21.0 3 (3) where, C: cracking ratio (%), b: the area of each box containing the cracks (0.5 mm 0.5 mm), 0.6: the percentage of one line of the crack in one compartment on the road surface, 1.0: the percentage of two lines or more of the crack in one compartment on the road surface, N: number of the area containing the cracks
These attributes will be assigned in each partition of the road surface data.
2) Partition function
MDot+ has a function to separate a group of point cloud data. The system for this function was first developed in the past projects, but, in the present study, the authors improved this system and put it in the editor. The point cloud data is split according to the length of the linearity. The line further divides the data into diverse sections. The length of the line can be freely set. The data is split into sections (Si {i = 1, 2,...,
n}) as shown in Fig. 13. By dividing Si, it is possible to assign
attributes to the point cloud data in each section.
Fig. 11. Ortho picture.
Fig. 12. Cracking ratio.
Fig. 13. Partition function.
2 2 i i i i i i x x n z x z x n a
2 2 2 i i i i i i i x x n x z x z x n bFig. 14. Application site.
IV. APPLICATION AND RESULT
A. Introduction of Application Site
This case study uses the point cloud data of A town that is measured by using a 3D survey equipment — MMS. The current study is being used for purposes of road maintenance in road information management. The application site — A town — has a total distance of 194 kilometres and total points of 10 million. Road surface point cloud data of A town is shown in Fig. 14.
B. Application of MDot+ in the Site
First, the authors explained the partition process in the application site, a part of A town. By using MDot+, the road surface data of the A town is partitioned into 100 meters interval according to the section measurement unit set by Ministry of Land, Infrastructure and Transportation (MLIT). The authors used one of the roads in the application site as a sample to show the partition. The specified road surface data was first partitioned by using 100 meters interval in which the road data could be divided into four parts. The four partitions are illustrated in Fig. 15. MDot+ can also be manually operated and re-analysis can be held if any error occurs in the data.
Fig. 15. Road surface point cloud data partition.
Fig. 16. Road surface data partition and visualization.
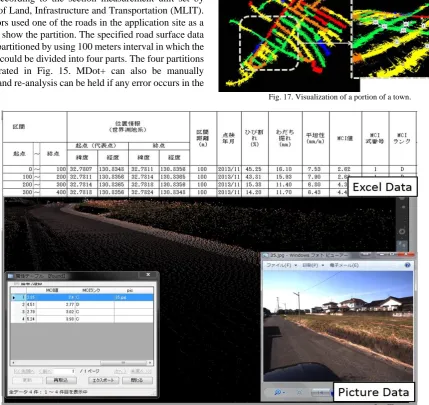
Fig. 17. Visualization of a portion of a town.
For visualization, first, the authors assigned attributes to the partitioned point cloud data from the analyzed results. Subsequently, the authors used the additional add-in for attaching colors to point cloud data in accord with the values on road surface characteristics distribution ratio set by the Japanese government illustrated in Fig. 16. The full visualization of a portion of A Town is shown in Fig. 17. In addition, the attributed point cloud data can be manually changed and updated by changing the value on the spread sheet created by MDot+.
After assigning attributes to the point cloud data, it is also possible to link the pictures data and spread sheet data of the road surface to the attributed point cloud data (Fig. 18). Since MMS has the front and back camera, it is able to take picture while doing the survey. With spread sheet linkage, the user can change not only the values inside 3D viewer, but also those outside by using the data table.
V. DISCUSSION
MDot+, which has been applied into this site, has been helpful for improving the road register for the following reasons.
First, with automatic and manual analysis of the road surface data, the process of road maintenance can be completed swiftly and faster than the original way by 50 percent. It is possible to perform the re-analysis rapidly since the process of this editor usage does not require much time.
Second, with this editor, the organization of the computed attributes is automatically stored in each place and the database of point cloud data is separately stored in the main driver. For that reason, it is possible to change the database of the specified road data within a very short amount of time. Once MDot+ process started, the attributes files will be accordingly organized; therefore, there is no need for re-organization after the analysis is done.
Third, by putting labels on the data, the road can be easily identified. By coloring each section of the road, the part that needs re-evaluation or repair can be easily identified. By combining the said techniques, it is very convenient for the user to observe the state of the road. The specified road can be inspected individually or wholly as wished.
With data linkage, the analyzed data from MDot+ can be changed and updated anytime. It is probable to have the road surface point cloud data re-analyzed. It is within a realm of possibility to check the actual state of the road with picture linkage. Because of this linkage, the data inside each part of the road can be automatically viewed with just a click on the 3D viewer screen.
VI. CONCLUSION
In this study, the authors applied MDot+ in a sampling site in order to propose the use of point cloud data at the maintenance stage of road surface data management. First, the study started with partition, analysis, and data organization. Second, the authors demonstrated the visualization of the attributed data and the data linkage. Finally, they concluded this paper with different possibilities of using point cloud data in various stages of construction life
cycle management.
It is important that the 3D program currently being used in this case study has a slow processing time. It is thus hard to get the analyzed results as soon as users want. Further, the authors hope that this editor can be used at each stage whenever needed. By solving all these problems in their next research, the authors hope to extend the deployment of point cloud data at various stages of road surface data management—not only the use in road surface data management but that in the actual project of other fields such as river embankment and bridge in the near future as well.
ACKNOWLEDGMENT
The authors would like to express their gratitude to Asahi Survey and Design Co., Ltd, SK Engineering Co., Ltd and Informatics Autodesk Co., Ltd for providing precious data to this study.
REFERENCES
[1] M. Ueno, I. Kobayashi, K. Yamamoto, and S. Takeshita, “Constructed the road network for the shelter simulation using laser measurement data,” Journal of Applied Computing in Civil Engineering, vol. 16, pp. 195-202. 2007.
[2] I. Kobayashi, S. Miyashita, M. Sakaguchi, and M. Ueda, “Improvement design of sight distance using MMS data,” Journal of Applied Computing in Civil Engineering, vol. 18, pp. 1-8, 2009. [3] S. Miyashita, I. Kobayashi, T. Noma, and Y. Yamamura, “Forecasts of
falling rock spots, and application to preliminary design using two kinds of point clouds,” Journal of Applied Computing in Civil Engineering, vol. 19, pp. 149-156, 2010.
[4] I. Kobayashi, F. Yoshida, T. Noma, and Y. Kobayashi, “Application of point cloud data for preliminary design using model space,” Journal of Applied Computing in Civil Engineering, vol. 19, pp. 157-164, 2010. [5] K. Kamei, K. Togashi, Y. Hashimoto, and K. Nishikawa, “Detection of
utility poles by analyzing 3D point cloud acquired by mobile mapping system,” The Papers of Technical Meeting on Intelligent Transport Systems, IEE Japan, pp. 11-15, 2011.
[6] K. Iked, S. Oguri, and H. Masuda, “Segmentation and Shape Modeling of Features in Mobile Mapping Data,” Proceedings of the Japan Society for Precision Engineering Semestrial Meeting, 2012. [7] I. Kobayashi, S. Miyashita, Y. Fujita, and A. Takao, “Attribute analysis
of elevation point cloud data in the road space,” Journal of Applied Computing in Civil Engineering, vol. 19, pp. 185-192, 2010. [8] I. Kobayashi, Y. Fujita, H. Sugihara, and K. Yamamoto, “Attribute
analysis of point cloud data with color information,” Journal of Japan Society of Civil Engineers, vol. 67, no. 2, pp. 95-102, 2012.
[9] Y. Fujita, S. Ogata, I. Kobayashi, and T. Yamanaka, “Pedestrain bridge removal plan using point cloud data editor,” International Society for Computing in Civil and Building Engineering, pp. 47-54, 2013.
Y. Fujita was born in Okayama, Japan in 1981. He
received a B.E. degree and an M.E. degree in civil and environmental engineering from Kumamoto University, Japan in 2010 and 2012, respectively.
In 2012, he started working as a system engineer for Bear Root System Company, Kumamoto, Japan. His current research interests include program development, system development, and point cloud data. He is a member of Japanese Society of Civil Engineer (JSCE).
Mr. Fujita is now a doctoral student in the Graduate School of Science and Technology, Kumamoto University. He has been a scholarship student of Kumamoto University since his undergraduate time. He suggests the usage of point cloud data in construction life cycle management.
I. Kobayashi was born in Beppu City, Oita, Japan
in 1951. He received a B.E. degree and an M.E. degree in civil engineering from Kumamoto University, Japan in 1974 and 1976, respectively. He received his doctoral degree in civil engineering from Kyoto University in 1989.
1997, he became a professor in civil and environmental engineering at Kumamoto University. He had been a chief secretary and a member of Committee on Historical Studies in Civil Engineering, Japan Society of Civil Engineers until 2004. He is currently the chairman of Landscape Design Research Committee at the Graduate School of Science and Technology, Kumamoto University. His current research interests encompass landscape design, civil engineering history, and construction information modeling/management (CIM).
Dr. Kobayashi received many awards in the past few years. For instance, he received the best paper award in JSCE in 1997, Good Design Prize of Sustainable Design Prize in 2012, and the best design award of JSCE in 2013, to mention a few.
Y. Hoshino was born in Tokyo, Japan in 1971. He received a B.E. degree in civil engineering from Tokyo University in 1994. He obtained an M.E. degree in civil engineering, civil and earth resources course and a doctoral degree from Tokyo University in 1996 and 2005, respectively.
In 1996, he started working in the Architecture Planning and Landscape Design (APL) Office. Later, he became an assistant in the Engineering Faculty of Kumamoto University in 1999. Presently, he is an assistant professor at the Graduate School of Science and Technology, Kumamoto University. His current research interests comprise urban planning and landscape planning.
He received good design prize of Sustainable Design Prize in 2012.
W. Chanseawrassamee was born in Bangkok,
Thailand in 1990. He received a B.E. degree in civil and environmental engineering from Kumamoto University, Japan in 2014. He is currently enrolling on a master course at the Graduate School of Science and Technology of Kumamoto University.
He was a Japanese Government
(Monbukagakusho: MEXT) scholar and is currently being sponsored by Assuran International Scholarship Foundation. His current research interests include point cloud data and CIM. He is also a member of Japanese Society of Civil Engineer (JSCE).