e-ISSN: 2278-7461, p-ISSN: 2319-6491
Volume 5, Issue 1 [October 2015] PP: 32-43
Detailed Slope Stability Analysis Of Selected Slope Sites Situated
Along Katas-Choa Saiden Shah Road
Danish Ali*, Yasir Majeed**, M. Shahzad**, M. M. Iqbal**, Sonia Liaqat**,
M. Asif Gill**, M. Amir Ali**
*Mining & Nuclear Engineering Dept., Missouri S & T, Rolla MO, USA **Mining Engineering Dept., University of Engineering & Technology, Lahore, Pakistan
ABSTRACT: - This paper deals with the analysis of scan line survey data gathered from three selected slope sites situated along Kattas-Choa Saiden Shah road in Pakistan. The road side slope sites around Kattas-Choa Saiden Shah road can be vulnerable to mass movement processes, most commonly due to rock fall/sliding. These consist of Potwar portion (the Sakesar limestone and the Chor Gali Formation) of Eocene succession of the Cenozoic sedimentary sequence of the Upper Indus basin.
A detailed failure analysis of the discontinuity data of the selected sites was performed by using the DIPS software that has shown the likelihood of toppling and planar failures. For slope face 1 the toppling and the planar sliding risk came out to be 67.6% and 62% respectively, for slope face 2 the toppling and the planar sliding risk came out to be 50% and 30% respectively and for slope face 3 the toppling and the planar sliding risk came out to be 81% and 30.1% respectively. It’s the first time that such a detailed failure analysis have been conducted for the aforementioned sites. Furthermore, it hasbeen recommended that the selected slopes may temporarily be stabilized using any of the various technique mainly flattening or reducing the slope angle, plastic wire mesh reinforcement, drainage techniques, seeding with grasses and legumes and rock bolting. But in the long run it cannot be stopped without complete understanding of the structure because failure is continuing in that area, which may in near future bring a major disaster.
Keywords: - Slope Stability, DIPS, Kinematic Analysis, Sakesar Limestone, Chor Gali formation, Scan line survey
I.
INTRODUCTION
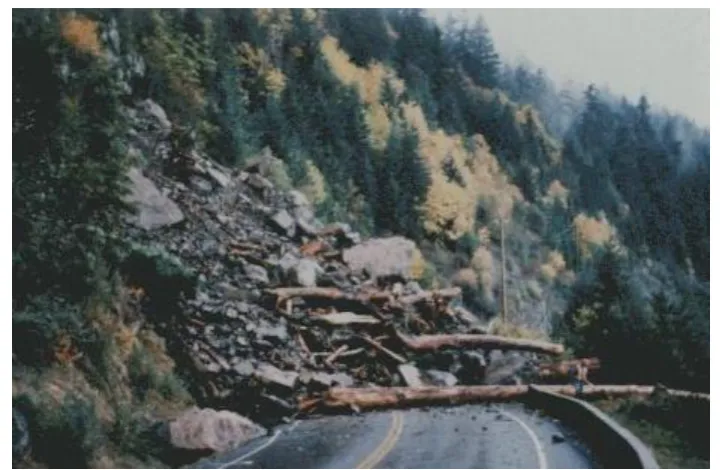
Failures of rock slopes, both man-made and natural, include rock falls, overall slope instability and landslides, as well as slope failures in open pit mines. The consequence of such failures can range from direct costs of removing the failed rock and stabilizing the slope to possibly a wide variety of indirect costs. Examples of indirect costs include damage to vehicles and injury to passengers on highways and railways, traffic delays, business disruptions, loss of tax revenue due to decreased land values, and flooding and disruption to water supplies where rivers are blocked by slides. In the case of mines, slope failures can result in loss of production together with the cost of removal of the failed material, and possible loss of ore reserves if it is not possible to mine the pit to its full depth.
Figure 1In 1991, a rock slide near Loggers Creek closed the Sea-to-Sky Highway for 12 days and cost $7 million for repairs and preventative structures (photo courtesy of the Ministry of Transportation and Highways).
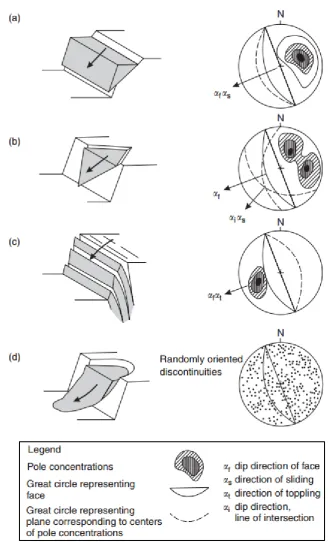
A major cause of slope failures along road cuts or mine walls is the presence of unfavorably oriented discontinuities (joints, faults, bedding planes, foliation, and shear zones that can act as failure planes) with respect to slopeface, causing plane, wedge, and toppling failures (Figure 2).
To evaluate the potential for discontinuity orientation-dependent slope failures, Markland’s test is used (Hoek and Bray, 1981; Wyllie and Mah, 2005). According to the Markland’s test, a plane failure may occur when a discontinuity dips in the same direction (within 20) as the slope face, at an angle gentler than the slope angle but greater than the friction angle along the failure plane (Hoek and Bray, 1981; Wyllie and Mah, 2005) (Figure 2). A wedge failure may occur when the line of intersection of two discontinuities, forming a wedge-shaped block, trends in the same direction as the slope face and its plunge angle is less than the slope angle but greater than the friction angle along the discontinuities (Hoek and Bray, 1981; Wyllie and Mah, 2005) (Figure 2). A toppling failure may result when discontinuities parallel to the slope face (within 30) are steeply dipping into the slope face (Figure 2) (Goodman and Bray, 1976). According to Goodman and Bray (1976), a toppling failure involves inter-layer slip movement. The requirement for the occurrence of a toppling failure according to Goodman and Bray (1976) is “If layers have an angle of friction Φj, slip will occur only if the direction of the applied compression makes an angle greater than the friction angle with the normal to the layers. Thus, a pre-condition for interlayer slip is that the normals be inclined less steeply than a line inclined Φj above the plane of the slope. If the dip of the layers is σ, then toppling failure with a slope inclined αdegrees with the horizontal can occur if (90 - σ) + Φj < α”.
Like many other developing countries Pakistan has been frequently subject to a variety of natural hazards. Apart from the vast alluvial Indus plains, where people are mostly vulnerable to devastating floods, waterlogging and related hazards, a major part of the country is mountainous which is geomorphological active and where people, their houses and other properties are vulnerable to natural hazards of various types like earthquake, mass movements, landslides, flash floods and several others. However, of all these hazards the landslides and related failure processes are the most damaging to the work of man because they are an ever-present and frequent danger for the people and their property in the area.
In this study three different portions of roadside rock slopes situated near Katas-Choa Saiden shah road was selected for slope stability analysis.
Figure 2 Main types of block failures in slopes, and structural geology conditions likely to cause these failures: (a) plane failure in rock containing persistent joints dipping out of the slope face, and striking parallel to the face; (b) wedge failure on two intersecting discontinuities; (c) toppling failure in strong rock containing discontinuities dipping steeply into the face; and (d) circular failure in rock fill, very weak rock or closely fractured rock with randomly oriented discontinuities. (Wyllie and Mah, 2005)
Geology of the Area:
emplacement of ophiolite and mélange sequences, widespread volcanism and magmatism, and change from Neogene and Quaternary. It also records the evolution of vertebrate faunas. The present day configuration of the country was thus formed.
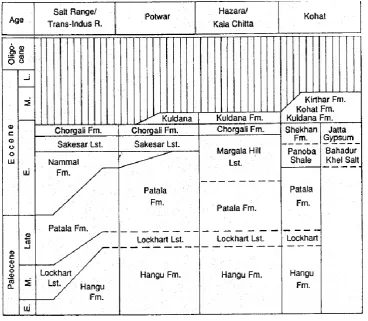
In particular, our area consisted of Potwar portion (the Sakesar limestone and the Chor Gali Formation) of Eocene succession of the Cenozoic sedimentary sequence of the Upper Indus basin. With increase in limestone beds the Nammal Formation transitionally passes into the overlying Sakesar Limestone (Gee 1935, Fatmi 1973), the type locality of which is the Sakesar Peak (32˚31’30”N; 71˚36’E). It consists of grey, nodular to massive limestone which is cherty in the upper part. Near Daudkhel, the Sakesar limestone laterraly grades into massive gypsum. Its thickness ranges from 70m to about 300m. It contains, amongst others, Nummulites atacius, N. mamilla, Assilina granulosa, A, subspinosa, Fasciolites oblonga, F. globosa, Lockhartia conditi, L. hunti, Operculina nummulitoides, Orbitolites complanatus and Rotalia trochidiformis. Its age is Early Eocene. The Chor Gali Formatoin (Pascoe 1920, Fatmi 1973) rests conformablyon the Sakesar Limestone (Type locality Chor Gali Pass, 33˚26’30”N; 70˚41’E). It consists largely, in the lower part, of thin bedded grey, partly dolomitized and argillaceous limestone with bituminous odor, and, in the upper part, of greenish, soft calcareous shale with interbeds of limestone. Its thickness ranges from 30m to 140m. It contains molluscs, osctracods and foraminifera (Davies 1937, Eames 1952, Latif 1970c). The most significant, larger foraminifera include Assilina spinosa, A. granulosa, A. daviesi, Flosculina globosa, globorotalia ressi, Lockharti hunti, L. tipper, L. conditi, Nummulites atacicus, N. mamilla, Orbitolites complanatus, Rotalia crookshanki, R. trochidiformis etc. The age of the Chor Gali formation is Early Eocene. It is overlain unconformably by the Neogene sequence.
Figure 3 Cenozoic sequences of the Upper Indus Basin (after Porth & Raza 1990 a, fig 5)
Slope face 1:
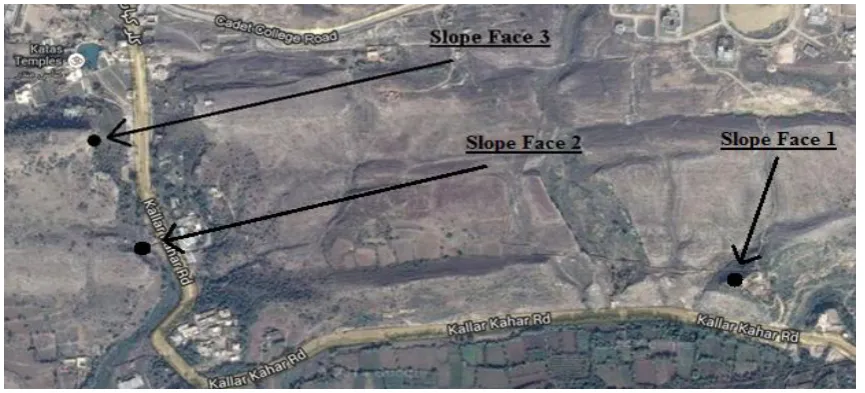
Slope Face 1 is located mid-way between the Katas-Choa Saiden road. The face is shown in the figure 4 & its location is shown in the figure 5. The coordinates of Slope face 1 are 32° 43' 11.76" Northing, 72° 57' 51.75" Easting at an elevation of 1433ft with the dip and dip direction of 72˚ and 162˚. The face is 40-50ft in length along which horizontal and vertical scan line survey is run.
Slope face 2:
is shown in the Figure 5. The coordinates of the Slope face 2 are 32° 43' 14.49" Northing, 72° 57' 10.89" Easting at an elevation of 1402ft with the dip and dip direction of 69° and 135° respectively.
Slope face 3:
Slope Face 3 is located Near Katas on roadside of Katas-Choa Saiden road. The face is shown in the Figure 4& its location is shown in the Figure 5. The coordinates of Slope face 3 are 32° 43' 21.83" Northing, 72° 57' 7.95" Easting at an elevation of 1389ft with the dip and dip direction of 77° and 141° respectively. The face is 60-70ft in length along which horizontal and vertical scan line survey is run.
Figure 4 Slope Faces a) Slope face 1 b) Slope face 2 c) Slope face 3
Figure 5 Google Earth Image Map showing the location of Slope Faces 1, 2 & 3
a)
b)
II.
METHODOLOGY
Detailed scan line survey was carried out at three different slope sites and kinematic analysis is performed. Kinematic analysis is purely geometric technique; it examines which mode of failure is possible in a jointed rock mass. Angular relationships between discontinuities and slope surfaces are applied to determine the potential and mode of failure (plane, wedge & toppling) (Kim et al., 2002). Markland test (Markland, 1972) is one of the kinematic analysis methods designated to evaluate the possibility of wedge failure, in which wedge shaped mass slides along the line of intersection of two planes. A refinement to Markland’s test has been discussed by Hocking (1976). Field observations include a natural slope condition, types and description of materials involved, vegetation conditions, and surface erosion. The measurements taken in the field are slope angle, dip & dip direction, spacing and persistence of discontinuities. The data was graphically analyzed using DIPS software.For a planar, clean (no infilling) discontinuity, the cohesion will be zero and the shear strength will be defined solely by the friction angle. A friction angle of 36° was calculated by the back analysis of the slopes in the study area.
III.
ANALYSIS USING DIPS SOFTWARE
Slope face 1:
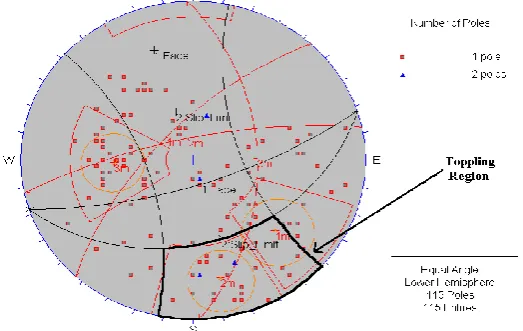
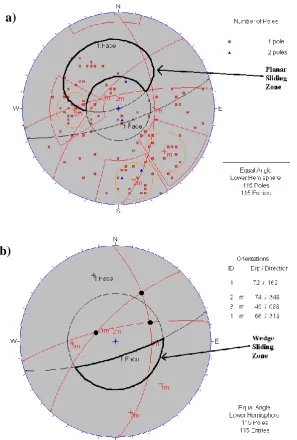
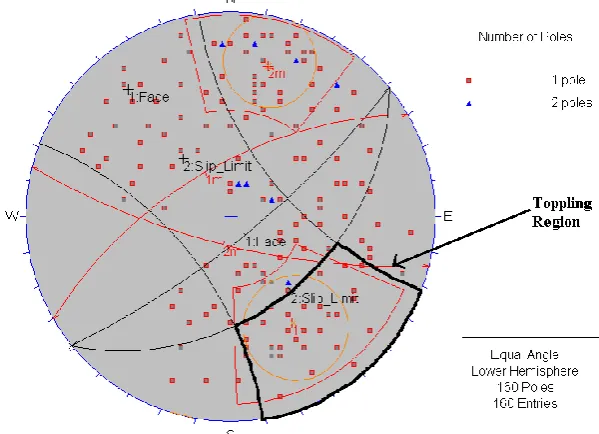
Pole Plot & Contour Plot along with Mean Discontinuity Planes and Face plane for Slope face 1 are shown in the Figure 6. Scatter Plot with Variability cone of Standard Deviation 1, Slip Limit & Friction Cone& Toppling region as bounded by slip limit and friction cone is displayed in Figure 7. Planar sliding zone as bounded by Daylight envelope and Pole friction cone & Wedge sliding zone as bounded by Face plane and Plane friction cone is shown in Figure8.
Figure 7: Scatter Plot with Variability cone of Standard Deviation 1, Slip Limit & Friction Cone showing the Toppling region (Outlined portion)
Figure 6: (a) Pole Plot (b) Contour Plot with Mean Discontinuity Planes and Face plane
Figure 8: (a) Planar sliding zone (b) Wedge sliding zone
Slope face 2:
Pole Plot & Contour Plot along with Mean Discontinuity Planes and Face plane for Slope Face 2 are shown in the Figure 9. Scatter Plot with Variability cone of Standard Deviation 1, Slip Limit & Friction Cone & Toppling region as bounded by slip limit and friction cone is displayed in Figure 10. Planar sliding zone as bounded by Daylight envelope and Pole friction cone & Wedge sliding zone as bounded by Face plane and Plane friction cone is shown in Figure 11.
a)
b)
Figure 9: (a) Pole Plot (b) Contour Plot with Mean Discontinuity Planes and Face plane
Figure 10: (a) Scatter Plot with Variability cone of Standard Deviation 1, Slip Limit & Friction Cone showing the Toppling region (Outlined portion)
Figure 11: (a) Planar sliding zone (b) Wedge sliding zone
Slope face 3:
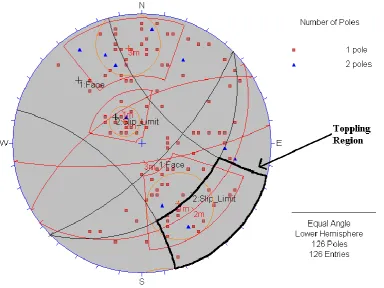
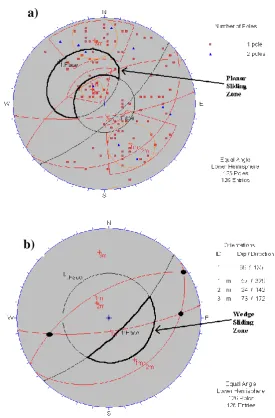
Pole Plot & Contour Plot along with Mean Discontinuity Planes and Face plane for Slope Face 3 are shown in the Figure 12. Scatter Plot with Variability cone of Standard Deviation 1, Slip Limit & Friction Cone & Toppling region as bounded by slip limit and friction cone is displayed in Figure 13. Planar sliding zone as bounded by Daylight envelope and Pole friction cone & Wedge sliding zone as bounded by Face plane and Plane friction cone is shown in Figure 14.
a)
a)
Figure 13: (a) Scatter Plot with Variability cone of Standard Deviation 1, Slip Limit & Friction Cone showing the Toppling region (Outlined portion)
Figure 12: (a) Pole Plot (b) Contour Plot with Mean Discontinuity Planes and Face plane
b)
Figure 14: (a) Planar sliding zone (b) Wedge sliding zone
IV.
RESULTS
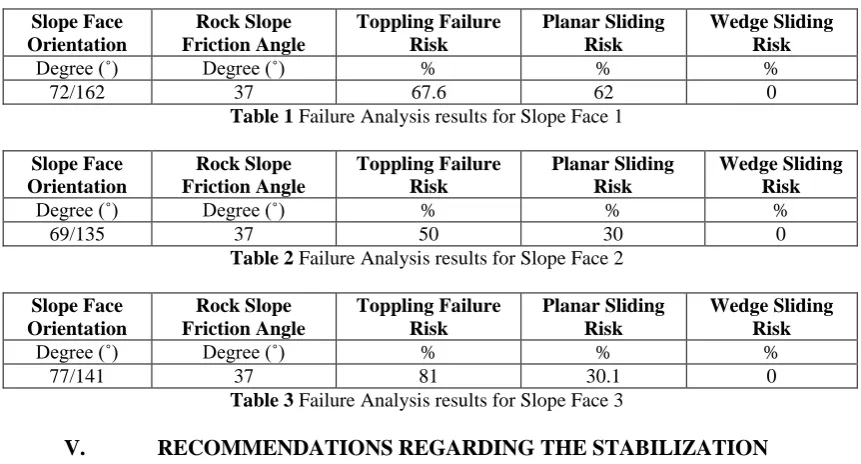
A detailed failure analysis was carried out using the DIPS software as described earlier which indicated that there are considerable chances of Toppling and Planar failure at Slope Face 1,2 & 3. But there is no chance of Wedge failure at any of these faces at all. The results for Slope face 1, 2 & 3 are shown in the Table 1, 2&3 respectively. Slope Face Orientation Rock Slope Friction Angle Toppling Failure Risk Planar Sliding Risk Wedge Sliding Risk
Degree (˚) Degree (˚) % % %
72/162 37 67.6 62 0
Table 1 Failure Analysis results for Slope Face 1
Slope Face Orientation Rock Slope Friction Angle Toppling Failure Risk Planar Sliding Risk Wedge Sliding Risk
Degree (˚) Degree (˚) % % %
69/135 37 50 30 0
Table 2 Failure Analysis results for Slope Face 2
Slope Face Orientation Rock Slope Friction Angle Toppling Failure Risk Planar Sliding Risk Wedge Sliding Risk
Degree (˚) Degree (˚) % % %
77/141 37 81 30.1 0
Table 3 Failure Analysis results for Slope Face 3
V.
RECOMMENDATIONS REGARDING THE STABILIZATION
OF ROCK SLOPES
As through the detailed failure analysis of selected slope sites, it can be seen that there is a 67.6%, 50% & 81% risk of Toppling failure at Slope face 1,2 & 3 respectively. Moreover, there is a 62%, 30% & 30.1% risk of Planar failure at Slope face 1,2 & 3 respectively and there is no chance of Wedge failure at all, Therefore it’s the Toppling and Planar failure that need to be taken care of. The following are some of the recommendations regarding the stabilization of these slope sites:
Flattening or reducing slope angle could be one of the method for improving the stability of Slopes as it reduces the weight of material which in turn improves the stability of the slope.
Relatively limited permanent stabilization works on the upper most lift of the face. This comprises PVC coated steel mesh put over the rock face. The grid acts similarly to reinforcing mesh in concrete, adding strength to the shear strength of the soil.
Ground water probably is the most important single contributor to landslide initiation. Therefore adequate drainage of water is the most important element of a slope stabilization scheme. Various Drainage techniques may include Site Leveling, Ditches and Drains, Erection of Drain pipes & Steel bin wall. Construction of rock catch fences, bunds and provisions for rock bolts locally as required.
Seeding with grasses and legumes which reduces surface erosion can be used to stabilize the slope. Planting with shrubs adds vegetative cover and stronger root systems, which in turn will enhance slope stability. Heavy and light hand scaling of loose rock from selected areas of all faces, local benching and regarding of
scree to reduce the risk of rock fall on less stable areas and those areas to be covered in rock fill.
Rock Sheds may be built over road to shield the area from rock fall and rock avalanches. They can be open ended or can completely envelope the rock fall area in a concrete or steel structure that will deflect rockfall away from the road.
REFERENCES
[1]. Admassu, Y. and A. Shakoor. DIPANALAYST: A Computer Program for Quantitative Kinematic Analysis of Rock Slope Failures. Computer & Geosciences, (2013), http://dx.doi.org/10.1016/j.cageo. 2012.11.018.
[2]. Davies, L. M. & Pinfold, E. S. (1937): The Eocene beds of the Punjab Salt Range. – Geol. Surv. India Mem., Palaeont. Indica, New Series 24, 1: 79 pp.; Calcutta.
[3]. Fatmi, A. N. (1973): Lithostratigrapgic units of the Kohat-Potwar Province, Indus Basin, Pakistan – – Geol. Surv. Pak. Mem. 10, 80 pp.; Quetta.
[4]. Gee, E. R. (1935 a): The Saline series (Lower Eocene) of Northwestern India – 22nd Sci. Cont. Calcutta 1935, Proceed.; Calcutta.
[5]. Gee, E. R. (1935 b): Recent observations on the Cambrian sequence of the Punjab Salt Range. – Geol. Surv. India Rec. 68, 1:115 – 120; Calcutta.
[6]. Goodman, R. E. and Bray, J. (1976) Toppling of rock slopes. ASCE, Proc. Specialty Conf. on Rock Eng. for Foundations and Slopes, Boulder, CO, 2, 201–34.
[7]. Hendron, A. J. and Patton, F. D. (1985) The Vaiont slide: a geotechnical analysis based on new geological observations of the failure surface. Waterways Experiment Station Technical Report, US Army Corps of Engineers, Vicksburg, MS, Vol. 1, 104 pp.
[8]. Hocking, G. (1976) A method for distinguishing between single and double plane sliding of tetrahedral wedges.Int. J. Rock Mech. Mining Sci., 13, 225–6.
[9]. Hoek, E. and Bray, J. (1981) Rock Slope Engineering, 3rd edn, Inst. Mining and Metallurgy, London, UK. Kiersch, G. A. (1963). Vaiont Reservoir Disaster. Civil Engng, 34(3), 32–9.
[10]. Kim, K.S., Park, H. J., Lee, S. and Woo, I. (2004). Geographic information system (GIS) based stability analysis of rock cut Slopes. Geosciences Journal, Vol. 8, No. 4, pp. 391-400.
[11]. Latif, M. A. (1973 c): Micropaleontology of the Galis Group, Hazara, West Pakistan. – Jb. Geol. B. A., Sonderband 15: 63 – 66; Wien.
[12]. Markland, J. T. (1972) A useful technique for estimating the stability of rock slopes when the rigid wedge sliding type of failure is expected. Imperial College Rock Mechanics Research Report No. 19,10pp. [13]. Pascoe, E. H. (1920): Petroluem in the Punjab and North-West Frontrier Province. – Geol. Surv. India
Mem. 40, 3: 331 – 393, 5 figs., 20 plts.; Calcutta.