International Journal of Engineering Research and Development
e-ISSN : 2278-067X, p-ISSN : 2278-800X, www.ijerd.com
Volume 2, Issue 7 (August 2012), PP. 73-79
A Comparison of Two MPPT Techniques for PV System in
Matlab Simulink
Ms. Sangita S. Kondawar
1, U. B. Vaidya
21
Student of M.Tech(EMS), RCERT, Chandrapur.
2
Professor, Electrical Department, RCERT, Chandrapur.
Abstract––In the context of renewable energy, this study treats the case of the conversion of solar energy, which is one part of non pollutant energy, to electrical one. In this paper, two different methods are used to maximize the generated power. Thus, a comparison between the ‘perturb and observe’ control method and the ‘incremental conductance’ control method are given, analyzed and discussed.
Keywords––Renewable energy, solar panel, photovoltaic cell, modeling and control.
I.
INTRODUCTION
In general, the Earth has two global movements that affect the reception of the solar energy to its surface: the rotation that it does once on itself per day and the yearly revolution that it does around the sun. The combination of these movements implies daily changes in the receipt of the solar light to particular places. The reason for which the energizing flux received to soil hardly passes 1000 W/m2 is that the atmosphere modifies in an important way the direct radiance of the sun. The phenomenon named "photovoltaic effect" consists mainly in transforming the solar light in electric energy by means of the semiconductor devices named photovoltaic cells. The solar panel, or photovoltaic generator, is itself constituted of an association of series and parallel of the necessary number of modules to assure the requisite energy. Maximum Power Point Trackers (MPPTs) play an important role in photovoltaic (PV) power systems because they maximize the power output from a PV system for a given set of conditions, and therefore maximize the array efficiency. Thus, an MPPT can minimize the overall system cost. MPPTs find and maintain operation at the maximum power point, using an MPPT algorithm. Many such algorithms have been proposed. However, one particular algorithm, the perturb-and-observe (P&O) method, continues to be by far the most widely used method in commercial PV MPPTs. Part of the reason for this is that the published MPPT methods do not include comparisons between multiple existing algorithms. [4][8][10]
II.
IMPLEMENTATION IN SIMULINK (PROGRAMMING & ALGORITHMS OF TWO
TECHNIQUES.)
Implementation of Perturb & Observe Method using MatLab Simulink. [4][5][6][7][9]
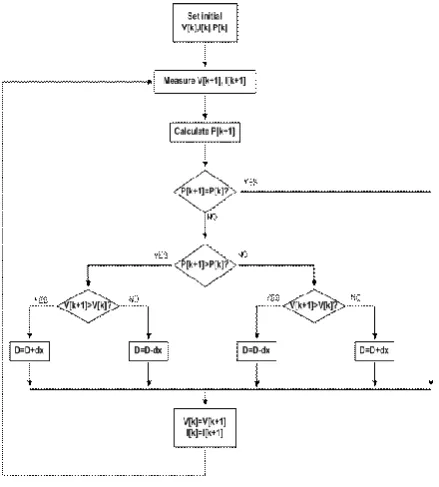
Fig. 1 Flow diagram of P&O MPPT method
Figure below shows the block diagram of this MPPT method and the coding of P & O block is shown below the figure. In this coding, the duty cycle ( D) of used DC – DC converter is calculated by the following expression.
D = Dold + deltaD
Where deltaD is the duty cycle step.
The different steps of the ‘Perturb and Observe’ method are : 1. Take current and voltage measurements, power calculation, 2. If the power is constant, return to take new measurement, 3. If power decreased or increased, test the voltage variation, 4. According to the direction of voltage variation, modify the current.
The simulink block of MPPT technique (P & O) is shown below in fig. 2.
Fig. 2. Block Diagram of P&O MPPT method Coding of P & O Block
function D = PandO(Param, Enabled, V, I)
A Comparison of Two MPPT Techniques for PV System in Matlab Simulink
P= V*I; dV= V - Vold; dP= P - Pold;
if dP ~= 0 & Enabled ~=0 if dP < 0
if dV < 0
D = Dold - deltaD; else
D = Dold + deltaD; end
else if dV < 0
D = Dold + deltaD; else
D = Dold - deltaD; end
end else D=Dold; end
if D >= Dmax | D<= Dmin D=Dold; end Dold=D; Vold=V; Pold=P;
Implementation of Incremental Conductance Method using MatLab Simulink.
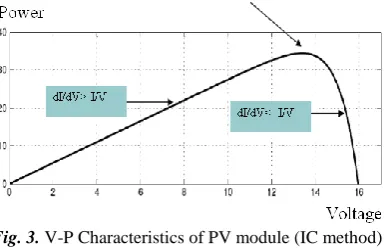
This method consists in using the slope of the derivative of the current with respect to the voltage in order to reach the maximum power point. To obtain this point, dI/dV must be equal to –I/V as shown in figure 3
Fig. 3. V-P Characteristics of PV module (IC method)
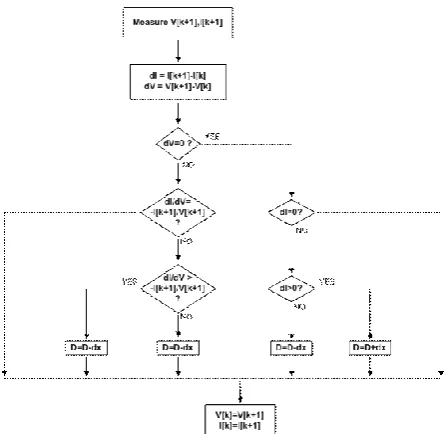
Fig. 4. Flow diagram of Incremental Conductance method
In addition, by using power formula, P=V.I, its derivative becomes : dP = V dI + I dV
In general, the duty cycle (D) of used DC – DC converter is calculated by the following expression. D = Dold + deltaD
Where deltaD is the duty cycle step.
The simulink block of MPPT technique (IC method)
The simulink block of MPPT technique (IC method) is shown below in fig. 5.
Fig.5. Simulink Block of MPPT technique (IC method)
Comparison of Two MPPT Techniques (P&O method and IC method) [3][4][5][8][10]
This paper presents in details comparative study between two most popular algorithms technique which is Perturb & Observe algorithm and Incremental Conductance algorithm. The Boost converter is used for comparison. Few comparisons such as voltage, current and power output has been traced. Multi changes in irradiance by keeping voltage and current as main sensed parameter been done in simulation. Matlab simulink tools have been used.
A Comparison of Two MPPT Techniques for PV System in Matlab Simulink
The block diagram of the PV simulation system used in this paper by using Perturb & Observe Method and Incremental Conductance Method is shown in fig. 6 and fig. 7
Fig. 6. The block dia. Of PV simulation using Perturb & Observe Method
Fig. 7. The block dia. of PV simulation using Incremental Conductance Method
Fig 6 & 7 are comparison diagrams of output current, voltage and power for the PV system with two selected MPPT algorithms under the conditions 1000W/m2, 250C and the load 10 by using the boost converter.
It can be observed that output power s with MPPT algorithm are obviously greater than those without MPPT algorithms.
III.
RESULT
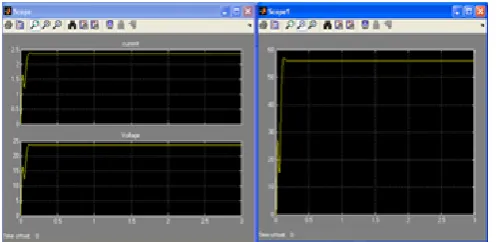
Fig. 8 Comparison diagram of o/p current, voltage & power without perturb & observe method
Fig. 9. Comparison diagram of o/p current, voltage & power with perturb & observe method
A Comparison of Two MPPT Techniques for PV System in Matlab Simulink
temperature has been included in the simulation circuit. From all the cases, the best controller for MPPT is Perturb & Observe controller.
REFERENCES
[1]. S. Rustemli, F. Dincer, Modeling of Photovoltaic Panel and Examining Effects of Temperature in Matlab/Simulink, ISSN 1392 – 1215 2011. No. 3(109)
[2]. Geoff Walker, EVALUATING MPPT CONVERTER TOPOLOGIES USING A MATLAB PV MODEL
[3]. Francisci M. Gonzalez-Longatt, Model of PhotovoltaicModule in MatlabTM, 2DO CONGRESO IBEROAMERICANO DE
ESTUDIANTES DE INGENIERIA ELECTRICA, ELECTRONICA Y COMPUTACION (II CIBELEC 2005
[4]. Ting-Chung Yu Yu-Cheng Lin, A Study on Maximum Power Point Tracking Algorithms for Photovoltaic Systems, A Study on Maximum Power Point Tracking Algorithms for Photovoltaic Systems
[5]. Mohamed Azab, A New Maximum Power Point Tracking for Photovoltaic System, proceedings of World Academy of Science, Engineering and Technology volume 34 October 2008 ISSN 2070-3740.
[6]. ROBERTO FARANDA, SONIA LEVA, Energy comparison of MPPT techniques for PV Systems, WSEAS TRANSACTIONS on POWER SYSTEMS.
[7]. Trishan Esram, Student Member, IEEE, and Patrick L. Chapman, Senior Member, IEEE, Comparison of Photovoltaic Array Maximum Power Point Tracking Techniques, IEEE TRANSACTIONS ON ENERGY CONVERSION, VOL. 22, NO. 2, JUNE 2007
[8]. Nazih Moubayed, Ali El-Ali, Rachid Outbib, A comparison of two MPPT techniques for PV system, WSEAS TRANSACTIONS on ENVIRONMENT and DEVELOPMENT
[9]. Hairul Nissah Zainudin, Saad Mekhilef, Comparison Study of Maximum Power Point Tracker Techniques for PV Systems, Proceedings of the 14th International Middle East Power Systems Conference (MEPCON’10), Cairo University, Egypt, December 19-21, 2010, Paper ID 278..
[10]. D. P. Hohm and M. E. Ropp*,y, Comparative Study of Maximum Power Point Tracking Algorithms, PROGRESS IN PHOTOVOLTAICS: RESEARCH AND APPLICATIONS, Prog. Photovolt: Res. Appl. 2003; 11:47–62 (DOI: 10.1002/pip.459) [11]. M. Calavia1, J.M. Perié1, J.F. Sanz2 and J. Sallán2, Comparison of MPPT strategies for solar modules, International Conference on Renewable Energies and Power Quality (ICREPQ’10), Granada (Spain), 23th to 25th March, 2010, European