© 2018 IJSRST | Volume 4 | Issue 2 | Print ISSN: 2395-6011 | Online ISSN: 2395-602X Themed Section: Science and Technology
An Efficient Glaucoma Screening Using CDR From 2-D Retinal
Fundus Images
M. Kezia
M. Tech, Department of Electronics and Communication, JNTUA, Andhra Pradesh, India
ABSTRACT
Glaucoma is the second leading cause of blindness all over the world. Eye’s optic nerve will be damaged as the result of glaucoma. Patients are also unaware of the disease because of its slow progression with very few symptoms. So detecting the disease in time is very important to avoid irreversible blindness. Automated optic nerve head (ONH) assessment from 2-D retinal fundus images is more promising for low-cost glaucoma screening. In this paper, super pixels classification based segmentation method is used for optic disc and optic cup boundary estimation. Subsequently, the CDR for testing fundus eye image is computed. The proposed method achieves good accuracy in large-scale population-based glaucoma screening.
Keywords: Glaucoma screening, super pixel classificaton, optic disc segmentation, optic cup segmentation, cup to disc ratio(CDR) .
I.
INTRODUCTION
Glaucoma is an eye disease in which the optic nerve head is damaged. It is predicted to affect nearly 80 million people by 2020 [1]. Glaucoma is called the silent thief of sight as it progresses with few signs and the vision loss from glaucoma is irreversible. Many glaucoma patients are unaware of the disease. Although it is irreversible, its progression can be slowed down through treatment. So screening of people at high risk for the disease is vital.
Clinically, there are three methods to detect glaucoma: 1) intraocular pressure (IOP) measurement, 2) visual field test, 3) optic nerve head assessment. The IOP measurement is not an effective screening tool because glaucoma can be present with or without increased IOP. Visual field test requires special equipment only present in specialized hospitals and therefore unsuitable for screening. Optic nerve head assessment is more promising for glaucoma screening which is done by a trained professional but manual assessment is time consuming, subjective and
expensive. Therefore, Automatic ONH assessment would be very beneficial for large-scale glaucoma screening instead of manual ONH assessment.
Binary classification between diseased and healthy image features is one strategy for automatic optic nerve head assessment [2]–[4] but selection of features is difficult and also challenging at pixel level [5]. Another strategy is to use the clinical indicators, such as the vertical cup to disc ratio (CDR) [6], disc diameter [7], ISNT [8] rule, peripapillary atrophy (PPA) [9], notching [10], etc. CDR is well known among ophthalmologists. A larger CDR value indicates a higher risk of glaucoma and vice versa. There has been some research on automated CDR assessment from 3-D images [11]–[14]. 2-D colour fundus images are still referred over 3-D images because of their availability and low cost [11]. This paper focuses on automatic glaucoma screening using CDR from 2-D fundus images.
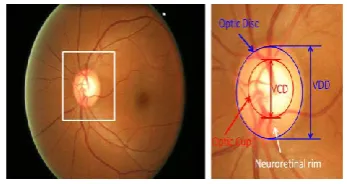
through which visual information of the photo-receptors is transmitted to the brain.
Figure 1. Major structures of the optic disc. The region enclosed by the blue line is the optic disc; The central bright zone enclosed by the red line is the
optic cup; And the region between the red and blue lines is the neuroretinal rim.
As shown in Figure 1, the disc can be divided into two distinct zones; namely, a central bright zone and a peripheral region. The central bright zone is optic cup and the peripheral region is neuroretinal rim. Clinically, CDR is the ratio of the vertical cup diameter (VCD) to vertical disc diameter (VDD). Therefore, accurate segmentation of disc and cup are essential for CDR measurement as shown in Figure 2.
Figure 2. General procedure for CDR assessment.
There have been several methods for automatic CDR measurement from 2-D fundus images, mainly pixel classification based methods [15]-[18], template based methods [19]–[21] and deformable model based methods [22]-[24]. This paper proposes super pixel classification based disc and cup segmentations for
glaucoma screening. Centre surround statistics were computed from super pixels and unify them with histograms for disc and cup segmentation. Based on the segmented disc and cup, CDR is computed. Whether glaucoma is present or absent is decided from computed CDR value as shown in Figure 3.
Figure 3. Block diagram of the proposed model
The paper summary is as follows. In Section II, description of Optic disc localization followed by ROI extraction. Section III describes super pixel classification based OD segmentation. Section IV explains super pixel classification based optic cup segmentation. Section V shows the experimental results including the accuracy for disc and cup segmentation as well as glaucoma screening. Conclusion is presented in final section.
II.
OPTIC DISC LOCALIZATION
Localization of disc is very important step in automatic glaucoma detection. Localization means finding out the disc pixels in the entire image. The region containing disc pixels is the required region of interest. After finding disc pixels, automatic extraction of ROI is done by calculating correlation coefficient between mask and original image. The algorithm to locali disc is as follows:
1. Resized original image to 256×256.
2. Applied mean smoothing filter to remove noise. 3. Binary image was generated by taking threshold. 4. Applied morphological operations (opening and
closing) to binary image.
5. Labelled the image and calculated basic region properties (area, centroid, bounding box). 6. Correlation coefficient calculated between mask
image and input image.
7. Pixels in the label with correlation coefficient = +1 are the required region of interest pixels. 8. Bounding box coordinates of required region
were given to imcrop function to automatically crop the region of interest.
III.
OPTIC DISC SEGMENTATION
Disc boundary estimation comes under segmentation which is a very challenging task due to variable
imaging conditions, blood vessel occlusions,
pathological changes around disc, etc. Edge detection followed by circular Hough transform initialization with an active shape model to segment the disc in [27]. Circular fitting for disc might lead to an underestimated disc because vertical diameter of disc is 7%–10% larger than the horizontal one. So ellipse fitting is often adopted for glaucoma detection [28]. The performance of the segmentation methods of disc depends upon the differentiation of edges from the disc and other structures, like PPA (region which looks like a part of the disc) [29] which makes to form another ellipse (often stronger) besides disc. To overcome the drawback of previous methods, a super pixel classification based method followed by deformable model is proposed. To compute local image features, super pixels work as a convenient primitive by capturing redundancy in the image. For
initialization of disc boundary, super pixel
classification is used and the deformable model is used to fine tune the disc boundary.
Figure 4. Super pixel based optic disc segmentation block diagram.
A. Generation of super pixels by SLIC
Simple linear iterative clustering [30] algorithm (SLIC) is used to aggregate nearby pixels into super pixels. Compared to other super pixel methods, SLIC is fast, memory efficient and very excellent at object’s boundary adherence. SLIC operates on single parameter K i.e. the number of desired super pixels.
1. In the image with pixels, Initial cluster centres are sampled on regular grid step
√ pixels.
2. At first, centres moved towards the lowest gradient position in a 3×3 neighbourhood. 3. SLIC iteratively searches for its best matching
pixel in eighborhood
around ased on colour and spatial proximity.
4. Based on the found pixel new cluster centre will be computed.
5. The iteration continues until the distance between the new centres and previous ones is small enough.
6. In final step, Post processing is applied to enforce the connectivity.
B. Feature Extraction
differences between disc and non-disc region. To form five channel maps, equalized histograms of red r, green g and blue b channels from RGB colour space and hue and saturation from HSV colour space are used. For retinal images, value from HSV colour space is almost the same as the red channel. Hence is not used. Histogram feature computed for the th super pixel is
[ ( ( ( ( ( ( ( ( ]
where function of histogram equalization is denoted by ( and the function to compute histogram is denoted by ( from jth super pixel . The histogram computation uses 256 bins and
dimensional feature
2) Centre Surround Statistics: A texture feature is required to differentiate the PPA region which looks closer to the disc. PPA contains blob-like structure which varies largely in multiple scales whereas disc is constant with homogenous structure. Centre surround statistics (CSS) from super pixels work well to reflect the difference between PPA and disc. To compute CSS,
1. Gaussian pyramids are generated with a ratio from level 0 to level 8[32].
2. CSS is computed for 6 maps at 2–5, 2–6, 3–6, 3– 7, 4–7 and 4–8 from an image channel using central levels and surround levels (coarser) , with
3. Feature map in centre level at denoted as ( and the feature map in surround level as ( , interpolate ( to be the same size as ( and then interpolated map is denoted as ( ( .
4. The centre surround difference is then
computed as | ( ( ( ) | .
5. All the difference maps are resized to be the equal size with the original.
6. Compute maps from and
channels.
7. Then CSS features, [ ] are computed as the first and second moments of these maps within super pixels where and
from Jth super pixel
( ∑( ( (1)
( ∑( ( ( (
(2)
3) Final Feature: To classify the present super pixel, features from neighbouring super pixels are also included. For features of four neighbouring super pixels and were computed. By moving horizontally to the left of the current super pixel , is determined as the first super pixel. Similarly, and are determined by moving right, up, and down, as shown in Fig. 5. For specific super pixel , CSS feature would be calculated as ̂ [ ] which has a dimension of .Then [ ̂ ] is the proposed feature.
Figure 5. Illustration of neighbouring superpixels
C. Initialization and Deformation
A support vector machine with linear kernal is used as the classifier in this part. In the training, same number of super pixels from the disc and non-disc region from a set of training images with manual disc boundary.
1. The training is performed on the active set and returns a trained classifier model.
2. Then the trained classifier is used for further testing.
3. Output value of a super pixel is assigned to all pixels in that super pixel
5. After the binary decisions assignment for all pixels, a matrix with binary values with 1 as object and 0 as background is available.
6. Using morphological operation, largest
connected object is obtained and its boundary is used as the raw estimation of the disc boundary. 7. The best fitted ellipse is computed as the fitted estimation using elliptical Hough transform [33].
IV.
OPTIC CUP SEGMENTATION
Very few methods have been proposed for cup segmentation like thresholding [18], [19], level set based approach [20] and deformable model based method [34]. Cup boundary detection when the pallor is weak is the major challenge. In such cases, landmarks like intensity changes or edges are not present to estimate the cup boundary reliably. In super pixel classification method for cup segmentation we incorporate prior knowledge into the training of super pixel classification instead of relying on vessel bends. The procedure for cup segmentation is similar like disc segmentation with few modifications.
Figure 6. Block diagram of super pixel based optic cup segmentation.
A. Feature Extraction
The minimum bounding box of the disc is used for cup segmentation. While computing histogram feature we exclude red channel because only little information of the cup present in the red
channel. Similarly, the center surround
statistics ̂ can be computed. When the pallor is non- obvious, distance is included as location information to obtain a reliable result, as illustrated in Fig. 7. is normalized using the height and width of the disc to adapt the variation of disc size. Mathematically, is computed as
√( ) ( ) (3)
Where ( denotes the coordinate of the disc centre, ( ) denotes the coordinate of the centre of
and denotes the height and width of the disc, respectively. Thus, the feature vector for cup segmentation is computed as [ ̂ ].
Figure 7. Illustration of distance Dj
especially from the inferior and superior sector of the cup.
C. Cup to Disc Ratio
After obtaining the disc and cup, CDR can be calculated. As mentioned in the introduction, CDR is an important indicator for glaucoma screening computed as
CDR= VCD/VDD (4)
If the computed CDR is greater than a threshold, it is glaucomatious eye, otherwise, healthy eye.
V.
EXPERIMENTAL RESULTS
A. Simulation Results
Table 1. Simulation results of input images for glaucoma screening
INPUT
IMAGE LOCALIZED ROI
DISC ROI WITH SUPERPIXELS
DISC BOUNDARY ESTIMATION
CUP BOUNDARY ESTIMATION
Cdra DIAGNOSIS
0.72
Glaucoma
0.69
Glaucoma
0.31
Normal
0.39
Normal
B. Performance Evaluation 1. Mean CDR Error:
To evaluate the accuracy of the proposed CDR, the CDR error is computed as
| |
(5)
Where denotes the manual CDR from trained professionals and denotes the automated CDR.
Mean CDR Error= (∑CDR Errors) (6)
Here, N denotes the total number of images in dataset.
2. Overlapping error for Optic Disc and Optic Cup: The overlapping error is computed as the evaluation metric for segmentation accuracy
( ( (7)
Where S and G denote the segmented and the manual “ground truth” disc or cup, respectively.
Table 2. MEAN CDR ERROR , Mean overlapping error of Disc and Cup BETWEEN PROPOSED
METHOD AND PREVIOUS METHOD
Metric
Method
Mean overlapping Error for Disc
Mean overlapping Error for Cup
Mean CDR Error
EHT 0.14 0.25 0.15
SP 0.11 0.18 0.09
SP+EHT (proposed)
0.07 0.11 0.06
VI.
CONCLUSION
Super pixel classification based methods for disc and cup segmentations have been demonstrated that HIST and CSS are beneficial for both disc and cup segmentation. In disc segmentation, CSS responds to blobs and provides better differentiation between PPA and discs compared with histograms. In cup segmentation, the benefit of CSS and Dj is even larger than that in disc segmentation, because the colour change from cup to neuroretinal rim is much smaller. The obtained CDRs for very large cups are still high and the CDRs for very small cups are still small, so the proposed method achieves high classification accuracy when differentiating glaucomatous subjects from healthy ones. The accuracy of the proposed method is
already much better than the air puff IOP measurement and previous CDR based methods [27].
VII.
REFERENCES
[1]. H. A. Quigley and A. T. Broman, "The number of people with glaucoma worldwide in 2010 and 2020," Br. J. Ophthalmol., vol. 90, no. 3, pp. 262-267, 2006.
[2]. J. Meier et al., "Effects of preprocessing eye fundus images on appearance based glaucoma classification," in Proc. 12th Int. Conf. Comput. Anal.Images Patterns, 2007, pp. 165–172.
[3]. R. Bock et al., "Classifying glaucoma with image-based features from fundus photographs," in Proc. Annu. Pattern Recog. Symp. German Assoc. Pattern Recog., 2007, pp. 355–364. [4]. R. Bock et al., "Glaucoma risk index: Automated
glaucoma detection from color fundus images," Med. Image Anal., vol. 14, pp. 471–481,2010. [5]. G. D. Joshi, J. Sivaswamy, and S. R. Krishnadas,
"Optic disk and cup segmentation from monocular color retinal images for glaucoma assessment," IEEE Trans. Med. Imag., vol. 30, no. 6, pp. 1192–1205, Jun. 2011.
[6]. T. Damms and F. Dannheim, "Sensitivity and specificity of optic disc parameters in chronic glaucoma," Invest. Ophth. Vis. Sci., vol. 34, pp. 2246–2250, 1993.
[7]. D. Michael and O. D. Hancox, "Optic disc size, an important consideration in the glaucoma evaluation," Clin. Eye Vis. Care, vol. 11, pp. 59– 62, 1999.
[8]. N. Harizman, C. Oliveira, A. Chiang, C. Tello, M. Marmor, R. Ritch, and J. M. Liebmann, "The ISNT rule and differentiation of normal from glaucomatous eyes," Arch. Ophthalmol., vol. 124, pp. 1579–1583, 2006.
occurrence and correlations," Arch. Ophthalmol., vol. 110, pp. 214–222, 1992. [10]. R. R. Allingham, K. F. Damji, S. Freedman, S. E.
Moroi, and G. Shafranov, Shields’ Textbook of Glaucoma, 5th ed. Philadelphia, PA: Lippincott Williams Wilkins, 2005.
[11]. J. Xu, O. Chutatape, E. Sung, C. Zheng, and P. C. T. Kuan, "Optic disk feature extraction via modified deformable model technique for glaucoma analysis," Pattern Recognit., vol. 40, pp. 2063–2076,2007.
[12]. M. D. Abràmoff, W. L. M. Alward, E. C. Greenlee, L. Shuba, C. Y. Kim, J. H. Fingert, and Y. H. Kwon, "Automated segmentation of theoptic disc from stereo color photographs using physiologically plausible features," Invest. Ophthalmol. Vis. Sci., vol. 48, pp. 1665–1673, 2007.
[13]. Z. Hu,M. D. Abràmoff, Y. H. Kwon, K. Lee, andM. K. Garvin, "Automated segmentation of neural canal opening and optic cup in 3-d spectral optical coherence tomography volumes of the optic nerve head," Invest. Ophthalmol. Vis. Sci., vol. 51, pp. 5708–5717, 2010.
[14]. M.D.Abràmoff, K. Lee, M. Niemeijer,W.
L.M.Alward, E. Greenlee, M. Garvin, M. Sonka, and Y. H. Kwon, "Automated segmentation of the cup and rim from spectral domain oct of the optic nerve head," Invest. Ophthalmol. Vis. Sci., vol. 50, pp. 5778–5784, 2009.
[15]. K. Stapor, A. Sacutewitonski, R. Chrastek, and G. Michelson, "Segmentation of fundus eye
images using methods of mathematical
morphology for glaucoma diagnosis," in Proc. Int. Conf. Comput. Sci., 2004, pp. 41–48.
[16]. N. Inoue, K. Yanashima, K. Magatani, and T. Kurihara, "Development of a simple diagnostic method for the glaucoma using ocular fundus pictures," in Int. Conf. IEEE Eng. Med. Biol. Soc., 2005, pp. 3355–3358.
[17]. D. W. K. Wong, J. Liu, J. H. Lim, X. Jia, H. Li, F. Yin, and T. Y. Wong, "Level-set based automatic
cup-to-disc ratio determination using retinal fundus images in argali," Proc. Int. Conf. IEEE Eng. Med. Biol. Soc., pp. 2266–2269, 2008. [18]. Y. Hatanaka, A. Noudo, C. Muramatsu, A.
Sawada, T. Hara, T. Yamamoto, and H. Fujita, "Automatic measurement of vertical cup-to disc ratio on retinal fundus images," in Proc. Int. Conf. Med. Biometrics,2010, pp. 64–72.
[19]. X. Zhu and R. M. Rangayyan, "Detection of the optic disc in imagesof the retina using the hough transform," in Int. Conf. IEEE Eng. Med.Biol. Soc., 2008, pp. 3546–3549.
[20]. A. Aquino, M. Gegundez-Arias, and D. Marin, "Detecting the optic disc boundary in digital fundus images using morphological, edge detection, and feature extraction techniques," IEEE Trans. Med. Imag.,vol. 29, no. 11, pp. 1860–1869, Nov. 2010.
[21]. J. Cheng, J. Liu, D. W. K. Wong, F. Yin, C. Cheung, M. Baskaran,T. Aung, and T. Y. Wong, "Automatic optic disc segmentation with peripapillary atrophy elimination," in Int. Conf. IEEE Eng. in Med. Biol. Soc., 2011, pp. 6624– 6627.
[22]. J. Lowell, A. Hunter, D. Steel, A. Basu, R. Ryder, E. Fletcher, and L.Kennedy, "Optic nerve head segmentation," IEEE Trans. Med. Imag.,vol. 23, no. 2, pp. 256–264, Feb. 2004.
[23]. Z. Zhang, J. Liu, N. S. Cherian, Y. Sun, J. H. Lim, W. K.Wong, N. M. Tan, S. Lu, H. Li, and T. Y. Wong, "Convex hull based neuro-retinal optic cup ellipse optimization in glaucoma diagnosis," in Int. Conf.IEEE Eng. Med. Biol. Soc., 2009, pp. 1441–1444.
[24]. F. Yin, J. Liu, S. H. Ong, Y. Sun, D. W. K. Wong, N. M. Tan, C.Cheung, M. Baskaran, T. Aung, and T. Y. Wong, "Model-based optic nerve head segmentation on retinal fundus images," in Int. Conf. IEEE Eng. Med. Biol. Soc., 2011, pp. 2626– 2629.
[25]. L. Tang, M. K. Garvin,Y.H.Kwon,
head rim in color fundus photographs by probability based active shape model," in ARVO, 2012.
[26]. D. W. K. Wong, J. Liu, N. M. Tan, F. Yin, B. H. Lee, and T. Y. Wong, "Learning-based approach for the automatic detection of the optic disc in digital retinal fundus photographs," in Int. Conf. IEEE Eng. Med.
[27]. F. Yin, J. Liu, S. H. Ong, Y. Sun, D. W. K. Wong, N. M. Tan, C.Cheung, M. Baskaran, T. Aung, and T. Y. Wong, "Model-based optic nerve head segmentation on retinal fundus images," in Int. Conf. IEEE Eng. Med. Biol. Soc., 2011, pp. 2626– 2629.
[28]. J. Cheng, J. Liu, D. W. K. Wong, F. Yin, C. Cheung, M. Baskaran,T. Aung, and T. Y. Wong, "Automatic optic disc segmentation with peripapillary atrophy elimination," in Int. Conf. IEEE Eng. in Med Biol. Soc., 2011, pp. 6624– 6627.
[29]. J. A. Giaconi, S. K. Law, A. L. Coleman, and J. Caprioli, Pearls of Glaucoma Management. New York: Springer, 2010.
[30]. R. Achanta, A. Shaji, K. Smith, A. Lucchi, P. Fua, and S. Susstrunk, "Slic superpixels
compared to state-of-the-art superpixel
methods," IEEE Trans. Pattern Anal. Mach. Intell., vol. 34, no. 11, pp. 2274–2281, Nov. 2012.
[31]. J. Cheng, J. Liu, Y. Xu, D. W. K. Wong, B. H. Lee, C. Cheung, T.Aung, and T. Y. Wong, "Superpixel classification for initialization in model based optic disc segmentation," in Int. Conf. IEEE Eng. Med. Biol. Soc., 2012, pp. 1450– 1453.
[32]. E. H. Adelson, C. H. Anderson, J. R. Bergen, P. J. Burt, and J. M. Ogden, "Pyramid methods in image processing," RCA Eng., vol. 29, no. 6, pp. 33–41, 1984.
[33]. A. Fitzgibbon, M. Pilu, and R. B. Fisher, "Direct least squares fitting of ellipses," IEEE Trans.