Enteromorpha Prolifera Detection with MODIS
Image Using Semi-supervised Clustering
Shunyao Wu
a,b, Fengjing Shao
a,b, Ying Wang
b, Rencheng Sun
b, Jinlong Wang
c a College of Automation Engineering, Qingdao University, Qingdao 266071, ChinaEmail: [email protected] [email protected]
b College of Information Engineering, Qingdao University, Qingdao 266071, China
Email: [email protected] [email protected]
c School of Computer Engineering, Qingdao Technological University, Qingdao 266033, China
Email: [email protected]
Abstract— In recent years, enteromorpha prolifera detection has received increasing attention. Supervised learning with remote sensing images can achieve satisfactory performances for green tide monitoring. However, data distributions be-tween images obviously differ, and it would be too costly to label a massive amount of images for enteromorpha prolifera detection. Thus, this paper focuses on detecting enteromorpha prolifera using not only limited labelled data, but also a large amount of unlabelled data. We propose an effective semi-supervised clustering framework for entero-morpha prolifera detection, which can reduce the labelling cost and alleviate the overfitting problem. Experimental results prove the effectiveness and potential of our approach, with almost a 15% increase from baseline. In addition, the proposed approach can provide quantitative assessments for band data of moderate resolution imaging spectroradiometer (MODIS) images, and several often ignored bands, such as bands 5, 6, and 7, are shown to be useful for enteromorpha prolifera detection.
Index Terms— enteromorpha detection, semi-supervised clustering, remote sensing images
I. INTRODUCTION
E
Nteromorpha prolifera is a type of green algae that is widely distributed along the coastal areas of China [1]. Its natural reproductive capacity and environmental adaptability are particularly strong, and it may provoke a green tide under suitable conditions. In recent years, frequent occurrences of green tide have resulted in great losses for offshore tourism and aquaculture. Therefore, the rapid and accurate tracking and detection of green tides are urgent issues that must be solved.Recently, various kinds of data were utilised for en-teromorpha prolifera detection, such as sonar data [2],
Manuscript received August 10, 2011; revised January 2, 2012; accepted April 16, 2012. c⃝2005 IEEE.
This work was partially supported by the State Key Program of National Natural Science of China (No. 91130035), the National Natural Science Foundation of China (No. 60974085), the National Public Benefit Research Foundation (No. 200905030), the National Science Foundation of Shandong Province (No. ZR2012FZ003), the National Science Foundation of Shandong Province (No. ZR2012FQ017) and the Science and Technology Planning Project of Qingdao (No. 12-1-4-4-(8)-jch).
aerial images [3], and remote sensing images [4]. With the rapid development of remote sensing technology and data sharing, remote sensing images, such as moderate resolution imaging spectroradiometer (MODIS), have be-come the main data source to monitor green tides [4]–[7]. For example, Xing et al. [5] adopted a dynamic threshold strategy to detect enteromorpha prolifera based on multi-temporal and multi-source remote sensing images. Gu et al. [6] incorporated three modes of data, namely satel-lite optical, satelsatel-lite microwave, and aerospace remote sensing, and used a decision tree algorithm to determine whether a sample was enteromorpha prolifera. Shi et al. [7] employed the fuzzy c-means method with images from the HJ-1A/1B satellites charge-coupled device sensor to complete the classification task for enteromorpha prolifera detection.
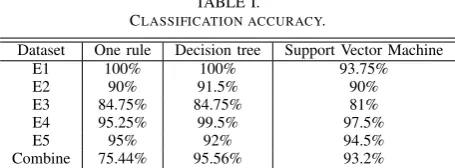
TABLE I. CLASSIFICATION ACCURACY.
Dataset One rule Decision tree Support Vector Machine
E1 100% 100% 93.75%
E2 90% 91.5% 90%
E3 84.75% 84.75% 81%
E4 95.25% 99.5% 97.5%
E5 95% 92% 94.5%
Combine 75.44% 95.56% 93.2%
and ”Combine”. As shown in Table I, the supervised methods can achieve a good performance. Nevertheless, when setting E1 as the training set and other images as the test sets, the method is ineffective, with the accuracy rate falling to 50%. The reason for this is because the training set is insufficient for supervised learning, which brings about the overfitting problem. There thus exists a trade-off between labelling costs and classification accuracy, while it is also complicated to determine the amount of training images and the sampling strategy needed for supervised learning.
To overcome these problems, this paper introduces semi-supervised learning for enteromorpha prolifera detection. Differing from supervised learning, semi-supervised learning [8]–[10] can efficiently make use of a small amount of labelled data (or prior knowledge) and a large number of unlabelled data. And semi-supervised learning has been widely applied to many fields, such as text mining [11] and bioinformatics [12]. Thus, we propose a novel framework for enteromorpha prolifera detection with semi-supervised clustering based on metric learning. On the one hand, the supplement size of the labelled data for semi-supervised learning is much smaller than for supervised learning, but the semi-supervised approach can effectively utilise unlabelled data to im-prove the classification accuracy. On the other hand, this method can alleviate the overfitting problem using par-tition samples according to their similarities as opposed to the learning classification model. In addition, attribute weights can be obtained through metric learning, which is useful for identifying the critical band for green tide detection.
The rest of the paper is organized as follows. In section II, we propose a semi-supervised learning framework for enteromorpha prolifera detection. In section III, we compare the performance of our approach with k-means on nine MODIS images, and apply the proposed approach to green tide monitoring. Finally, we conclude the paper and discuss some future work in Section IV.
II. SEMI-SUPERVISED LEARNING FRAMEWORK FOR ENTEROMORPHA PROLIFERA DETECTION
Traditional unsupervised clustering automatically groups similar objects, while separating different objects without providing a training set. Nevertheless, this strategy has many disadvantages, such as poor performance, unreadable clustering results, and limited ability to satisfy user requirements. To solve these problems, semi-supervised clustering has emerged as
Begin
Labelled images
UnLabelled images
Pixel dataset
Few labels
Few paiwise constraints
Semi-supervised
clustering Two clusters
Identifying categories
End
Figure 1. Main flow of our framework.
a solution, as it incorporates a small amount of prior knowledge so as to guide the clustering procedure and obtain better performances [13] [14].
This paper aims to use semi-supervised clustering with limited prior knowledge to detect enteromorpha prolifera in a large amount of unlabelled images and thus provide a promising strategy for the automation of green tide monitoring. Figure 1 demonstrates the main flow of our framework. Firstly, we pre-processed remote sensing images and extracted enteromorpha prolifera and non-enteromorpha prolifera pixels to obtain datasets. Subse-quently, we generated pairwise constraints based on labels and utilised semi-supervised clustering incorporating pair-wise constraints to partition the datasets into two clusters. Finally, we identified the categories of the two clusters according to the labels, so as to detect enteromorpha prolifera.
A. Data pre-processing
MODIS images have three different resolutions: 1km, 500m, and 250m. The satellite transits China twice every morning, with the monitoring areas covering the coastal waters of Qingdao, the Yellow Sea, and the East China Sea. Thus, it is conducive for accessing important entero-morpha prolifera information, such as the covered area, distribution, and drift trends.
We selected MODIS HKM images from the American National Aeronautics and Space Administration 1 as our data source, and each pixel in the images had seven bands of information. As many factors, such as attitude, altitude, and speed of aircrafts, may cause geometric distortions, we implemented more detailed pre-processing for the remote sensing images, such as geometric correction. Further, we extracted enteromorpha prolifera and non-enteromorpha prolifera samples from a small number of labelled images. The band information between the land and ocean was obviously different. Thus, it is feasible
to distinguish the land and ocean using coastline extrac-tion [15] or according to latitude and longitude data. Finally, we select pixels from the normal ocean as non-enteromorpha prolifera samples, and obtain non-enteromorpha prolifera samples from the sea area with the green tide.
B. Semi-supervised clustering based on metric learning
Given a set of pixels P = {p1, ...,pP}, a must-link constraint set S, and a cannot-link set D, the objective of clustering was to effectively partitionP intok(k= 2) clusters using prior knowledge.
1) Pairwise constraints: Pairwise constraints is a pop-ular type of instance-level knowledge in semi-supervised learning, and have become a common form to express user requirements. For instance, in the global positioning system (GPS) for intelligent navigation application, it is reasonable to determine whether the two GPS points of one car are on the same lane using trace contiguity and maximum separation [16]. Moreover, compared with labels, pairwise constraints are more consistent with the clustering objective as they focus on the differences between objects.
Pairwise constraints consists of must-link constraint set S and cannot-link constraint setD.
• Ifpiandpjare in the same cluster,(pi,pj)belongs toS.
• Ifpiandpjare in different clusters,(pi,pj)belongs toD.
Given the limited amount of labels, we obtained the pairwise constraints based on whether the labels of two pixels were the same or not. Further, we generated a larger amount of prior knowledge according to the properties of pairwise constraints. Provided that cluster number was 2, if(pi,pj)∈ S and(pi,pl)∈ D,(pi,pj)belonged toD; if (pi,pj)∈ S and(pi,pm)∈ S,(pj,pm)belonged to S; if (pi,pl)∈ D and (pl,po)∈ D,(pj,po)belonged toS.
2) Learning new metric with pairwise constraints: As an important semi-supervised clustering strategy, metric learning can learn new metric by solving optimisation, which aims to satisfy prior knowledge as much as pos-sible. Xing et al. [13] proposed an effective convex opti-misation to learn new metrics with pairwise constraints, which ensures the distances between objects belong to the must-link constraint setS as small as possible. As Xing′s method is both effective and efficient, our optimisation is constructed in accordance with this method.
minw
∑
(pi,pj)∈S
Dw(pi,pj) +λwTw
s.t.
∑
(pi,pj)∈D
Dw(pi,pj)≥1
w≽0 (1)
The first term of the objective function aims to reduce the differences between pixels belonging to the must-link constraint set S; the second term is the regulation term which ensures the consistent of band weights; the constraint means the differences between pixels belonging to the cannot-link constraint setDshould be large enough.
Dw(., .) =
∑d
j=1wjdϕ(., .), wheredϕ(., .)corresponds to the Bregman divergences; dstands for the dimension number of the dataset, and d= 7, as the MODIS image used in this paper has seven bands. The Bregman diver-gences [17] can be applied to many useful distances, such as Itakura-Saito, Mahalanobis, Squared Euclidean, and so on. Thus, this paper utilises the Bregman divergences as the metric of our framework so as to improve its expansibility.
On the condition that ϕ: S → R is a strictly convex function defined on a convex set S ⊆ Rd to ensure that
ϕis differentiable onri(S), the Bregman divergencesdϕ are defined as follows:
dϕ(pi,pj) =ϕ(pi)−ϕ(pj)−<pi−pj, ϕ(pj)> (2)
where∇ϕis the gradient vector ofϕ.
Given the different function ϕ, the Bregman diver-gences can be transformed into different types of dis-tances. For example, given ϕ(x) = x2, d
ϕ(x, y) = (x−y)2, and D
w(., .) becomes a parameterised square
Euclidean distance, Dw(x,y) = ∑d
j=1wj(xj−yj) 2. In
this paper, we utilize the parameterised square Euclidean distance when constructing the optimization with pairwise constraints.
3) Algorithm procedure: Generally,k-means clustering contains two steps: step 1, assigning each pixel to the nearest cluster; step 2, re-estimating the cluster represen-tations. The two steps are iterated until convergence is obtained.
In this paper, we firstly employed the large-scale op-timisation software, MOSEK, to solve the opop-timisation. After solving the optimisation, the obtained metric was used to assign the cluster index for step 1. Cluster repre-sentations were then obtained by computing the arithmetic mean of clusters for step 2. The procedure of the semi-supervised clustering was as follows:
4) Identifying categories of clusters: As an unsuper-vised method, clustering cannot determine the categories of objects. To identify categories of clusters, this paper counted the number of labelled enteromorpha prolifera samples in each cluster and then assigned the cluster with a greater number of enteromorpha prolifera samples as the enteromorpha prolifera class, with the other cluster being normal ocean class.
III. RESULTS AND DISCUSSION
In this section, we validate the effectiveness of our approach with several experimental results.
A. Datasets and experimental setting
Algorithm 1: Procedure of semi-supervised clustering Input: Pixel dataset P, must-link setS, cannot-link
setD.
Output: Two Clusters obtained with semi-supervised clustering.
Procedure Begin
Step 1: Integrate must-link set S and cannot-link setD by constructing the optimisation according to formula (1);
Step 2:Solve the optimisation problem to obtain the weight vector of bandsw;
Step 3:Scale all the pixels based on the band weight vector w;
Step 4: Divide the scaled dataset into two clusters using thek-means algorithm.
Procedure End
them E1 to E9. In the experiments, we extracted the training set from E1, and then respectively combined E1 and the other images to obtain eight datasets. When providing 2m (m is a positive integer) labelled pixels, we generated m must-link constraints and1.2m cannot-link constraints for the semi-supervised clustering 2. In addition, we set d for the parameter λ in the objective function of the optimisation (1).
B. Evaluation criteria
Two common clustering external indexes, NMI and Purity, were used to evaluate the clustering results and Accuracy was adopted to evaluate the accuracy of entero-morpha prolifera detection.
Normalised mutual information is one type of measure based on information entropy and is widely adopted [14] [19].
N M I(C,B) = √I(C,B)
H(C)H(B)
=
∑k i=1
∑k
j=1nijlog n·nij
ni·nj
√∑k
i=1nilognni
∑k
j=1njlog nj
n
(3)
Here, H presents the entropy and I computes the mutual information.Cpresents the clustering results after applying our approach to partition P, while B denotes the pre-specified structure. n represents the number of pixels in the dataset. The number of items inCandBare both k. We use nj to express the object number in the
ith cluster andnj in thejth cluster;nij thus denotes the item number included in ith andjth cluster.
Purity built one-to-one correspondences between the clusters and classes, and measured the proximity of the cluster assignments to the pre-specified structure.
P urity(C,B) =max(
∑k
i=1ni,M ap(i))
n (4)
2The ratio between must-link and cannot-link constraints was set according to [18]
TABLE II.
CLUSTERING ACCURACY UNDERPURITY/NMIINDEX.
Dataset k-means our approach
E2 0.6167/0.1677 0.8333/0.4791 E3 0.5000/0 0.7481/0.5000 E4 0.7086/0.2029 0.7818/0.3013 E5 0.7481/0.3285 0.8525/0.5757 E6 0.8249/0.4751 0.8937/0.6040 E7 0.7536/0.3507 0.7692/0.3735 E8 0.6182/0.1481 0.7481/0.3283 E9 0.5307/0.2419 0.8237/0.6750 mean 0.6626/0.2394 0.8063/0.4796
Here,Cstands for the cluster indexes,Bfor the under-lying class labels, and ifor the cluster index. M ap(i)is the class label corresponding to the cluster index i, and
ni,M ap(i) is the number of pixels not only belonging to cluster i, but also classM ap(i).
Accuracy is a simple index used to calculate the con-sistency of results with the underlying class labels for classification.
Accuracy(C,B) =
∑k i=1ni
n (5)
Here,Cstands for classification results whileBpresents the underlying class labels.irepresents the category index andni the number of correct instances for categoryi.
C. Comparison with k-means
Tables II and III provide the empirical results of our approaches in comparison to k-means clustering. Each result was generated using 20 trials. We provided 10% labelled data and generated 5% must-link constraints and 6% cannot-link constraints for each dataset. As shown in Tables II and III, the clustering quality and classification accuracy of our approach were better than the k-means on the whole datasets. Table IV shows the t-test results comparing our approach tok-means. This index indicates that the improvement observed with our proposed method was statistically obvious.
The experimental results also demonstrated the effec-tiveness of category identification, as the accuracy was mostly in line with the purity with the exception of the E4 dataset. This was because the clustering did not function as expected, and all of the pixels in E4 were partitioned into the same cluster. The reason was that this image contained heavy fog, which had a negative influence on sampling.
Through the metric learning, band information could be organised according to the weights calculated, and we find, band 2 >band 5 >band 6>band 4>band 1 >
TABLE III. CLASSIFICATION ACCURACY.
Dataset k-means our approach
E2 0.6167 0.8333 E3 0.5000 0.7481 E4 0.5101 0.5792 E5 0.7481 0.8525 E6 0.8249 0.8937 E7 0.7536 0.7692 E8 0.6051 0.7481 E9 0.5307 0.8237 mean 0.6361 0.7810
TABLE IV.
T-TEST OF OUR APPROACH VS.k-MEANS
Dataset NMI Purity Accuracy
E2 2.2828e-006 2.2828e-006 2.2828e-006 E3 0 7.9678e-299 7.9678e-299 E4 9.7101e-006 1.8137e-006 0.1923 E5 3.7652e-005 3.7572e-005 3.7572e-005
E6 0.0022 0.0060 0.0060
E7 8.9731e-027 6.5897e-027 6.5897e-027 E8 2.2834e-006 2.2828e-006 2.2828e-006 E9 0.0014 9.7640e-004 9.7640e-004
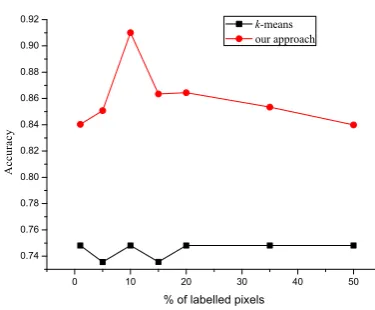
D. Classification performance versus labels
As shown in Figures 2 and 3, we demonstrated the performance versus the number of labels for the E5 and E9 datasets. With an increasing number of labels, we provided more pairwise constraints as stated in the experiment setting. It was clear that our approach was superior to the k-means method. However, the perfor-mance of our approach was deduced with the increase in labels. There are two possible reasons for this. On the one hand, the incoherence between must-link and cannot-link constraints may decrease the clustering quality, especially in cases of large amounts of prior knowledge [20]. On the other hand, it may cause the overfitting problem to learn with a large number of labels extracted from E1.
0 10 20 30 40 50
0.74 0.76 0.78 0.80 0.82 0.84 0.86 0.88 0.90 0.92
A
c
c
u
r
a
c
y
% of labelled pixels k-means our approach
Figure 2. Performance versus labels for the E5 dataset.
0 10 20 30 40 50
0.60 0.65 0.70 0.75 0.80 0.85
A
c
c
u
r
a
c
y
% of labelled pixels k-means our approach
Figure 3. Performance versus labels for the E9 dataset.
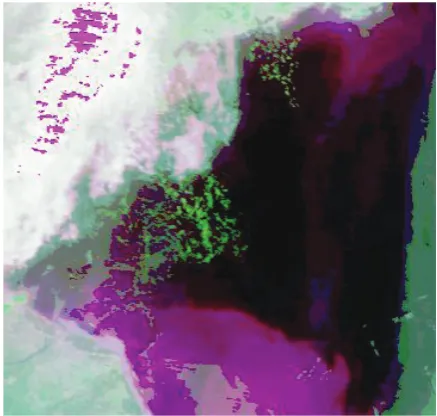
Figure 4. Artificial visual interpretation of the E5 image.
E. Green tide monitoring application
Finally, we applied the proposed approach to green tide monitoring. During the period from May 14th to July 17th in 2008, greed tide occurred in the sea area of Qingdao, China. Thus, we select two MODIS images on May 31st and June 29th, E5 and E9 images, to test our approach.
Figures 4 and 6 are the artificial visual interpretation of E5 and E9 images. Figures 5 and 7 demonstrate the detection effect on the E5 and E9 images, respectively. According to the previous analysis, we select 10% la-belled pixels in E1 images for semi-supervised clustering. As shown in Figures 5 and 7, Our approach was thus successful in effectively identifying green tide according to the real disaster area marked by the artificial visual interpretation. In particular, due to the thick curtain of fog in the E9 image, its performance was not as great as the E5 image.
IV. CONCLUSIONS
Figure 5. Green tide detection for the E5 image.
Figure 6. Artificial visual interpretation of the E9 image.
Figure 7. Green tide detection for the E9 image.
labelled data and a large amount of unlabelled data for the automation of green tide monitoring. With few labels, we generated pairwise constraints for semi-supervised clustering and then adopted metric learning to incorporate pairwise constraints, so as to partition the pixel set into two clusters. Finally, we identified the corresponding cat-egories of clusters for enteromorpha prolifera detection by counting the amount of enteromorpha prolifera samples. Experimental results demonstrate the effectiveness of our approach, which is promising for using the weights of band information obtained based on metric learning to monitor green tide.
In the future, we aim to design a more systematic method by combing multi-source remote sensing images and implementing an effective toolkit for the automation of green tide monitoring. Other work involves apply-ing and comparapply-ing the performance of metric learnapply-ing strategy with other semi-supervised learning algorithms for enteromorpha prolifera detection. Active learning will also be introduced into the semi-supervised clustering procedure.
ACKNOWLEDGMENT
The authors are grateful to the anonymous referees for their valuable comments and suggestions to improve the presentation of this paper.
REFERENCES
[1] Z. Liang, X. Lin, M. Ma, J. Zhang, X. Yan, and T. Liu, “A preliminary study of the enteromorpha prolifera drift gath-ering causing the green tide phenomenon [j],”Periodical of Ocean University of China, vol. 4, pp. 601–604, 2008. [2] L. Zhu, G. Yao, and X. Zhang, “Researching in enteromor-pha disaster monitoring based on sonar detection,”Science and Technology Information, pp. 187–188, 2009. [3] X. Dong, J. Dong, and L. Qu, “Enteromorpha
detec-tion in aerial images using support vector machines,” in
IEEE Youth Conference on Information, Computing and Telecommunication, 2009, pp. 299–302.
[4] C. Hu, “A novel ocean color index to detect floating algae in the global oceans,”Remote Sensing of Environment, vol. 113, no. 10, pp. 2118–2129, 2009.
[5] Q. Xing, X. Zheng, P. Shi, J. Hao, D. Yu, S. Liang, D. Liu, and Y. Zhang, “Monitoring green tide in the yellow sea and the east china sea using temporal and multi-source remote sensing images,”Spectroscopy and Spectral Analysis, vol. 31, no. 6, pp. 1644–1647, 2011.
[6] X. Gu, X. Chen, Q. Yin, Z. Li, H. Xu, Y. Shao, and Z. Li, “Stereoscopic remote sensing used in monitoring enteromorpha prolifra disaster in chinese yellow sea,”
Spectroscopy and Spectral Analysis, vol. 31, no. 6, pp. 1627–1632, 2011.
[7] Y. Shi, L. Shi, M. Xa, N. Yang, and J. Ding, “The application of hj-1a/1b’s ccd data to entermorpha prolifera monitoring over the yelow sea and east sea,” Remote Sensing Information, vol. 2, pp. 47–50, 2012.
[8] X. Zhu and A. B. Goldberg, “Introduction to semi-supervised learning,”Synthesis lectures on artificial intel-ligence and machine learning, vol. 3, no. 1, pp. 1–130, 2009.
[9] S. Xu, “Semi-supervised tensor graph-optimized linear dis-criminant analysis for two-dimensional face recognition,”
[10] Z. Huang and Y. Chen, “A prototype patterns selection algorithm based on semi-supervised learning,”Journal of Software, vol. 8, no. 8, pp. 1984–1990, 2013.
[11] K. Nigam, A. McCallum, and T. Mitchell, “Semi-supervised text classification using em,”Semi-Supervised Learning, pp. 33–56, 2006.
[12] T.-P. Nguyen and T.-B. Ho, “Detecting disease genes based on semi-supervised learning and protein–protein interaction networks,” Artificial Intelligence in Medicine, vol. 54, no. 1, pp. 63–71, 2012.
[13] E. P. Xing, M. I. Jordan, S. Russell, and A. Ng, “Distance metric learning with application to clustering with side-information,” inAdvances in neural information process-ing systems, 2002, pp. 505–512.
[14] S. Basu, M. Bilenko, and R. J. Mooney, “A probabilistic framework for semi-supervised clustering,” inProceedings of the tenth ACM SIGKDD international conference on Knowledge discovery and data mining. ACM, 2004, pp. 59–68.
[15] S. Dellepiane, R. De Laurentiis, and F. Giordano, “Coast-line extraction from sar images and a method for the evaluation of the coastline precision,”Pattern Recognition Letters, vol. 25, no. 13, pp. 1461–1470, 2004.
[16] K. Wagstaff, C. Cardie, S. Rogers, and S. Schr¨odl, “Con-strained k-means clustering with background knowledge,” inICML, vol. 1, 2001, pp. 577–584.
[17] A. Banerjee, S. Merugu, I. S. Dhillon, and J. Ghosh, “Clustering with bregman divergences,” The Journal of Machine Learning Research, vol. 6, pp. 1705–1749, 2005. [18] M. Halkidi, D. Gunopulos, M. Vazirgiannis, N. Kumar, and C. Domeniconi, “A clustering framework based on subjec-tive and objecsubjec-tive validity criteria,”ACM Transactions on Knowledge Discovery from Data (TKDD), vol. 1, no. 4, p. 4, 2008.
[19] X. Hu, X. Zhang, C. Lu, E. K. Park, and X. Zhou, “Exploiting wikipedia as external knowledge for document clustering,” in Proceedings of the 15th ACM SIGKDD international conference on Knowledge discovery and data mining. ACM, 2009, pp. 389–396.
[20] I. Davidson, K. Wagstaff, and S. Basu, “Measuring constraint-set utility for partitional clustering algorithms,”
Knowledge Discovery in Databases: PKDD 2006, pp. 115– 126, 2006.
Shunyao Wu received the B.S. and M.S. degree in computer Science and technology and computer software and theory from Qingdao Technological University, China, in 2008 and 2011, respectively. He is currently working towards his Ph.D. degree in systems theory at Qingdao University, China. His current research interest includes data mining, machine learning, complex network and bioinformatics.
Fengjing Shao received her B.S. degree in computer science from Shandong University, China in 1982 and her Ph.D. degree in information engineering from Osaka University, Japan in 1991. She is a professor in College of Information Engineer-ing, Qingdao University, China. Her research interests include complex network, network complexity and data mining.
Ying Wang received her B.S. degree in computer science from Qingdao University, China in 2011. She is currently a master student and working towards her M.S. degree at Qingdao University, China. Her current research interest includes data mining and remote image detection.
Rencheng Sunreceived his B.S. degree in applied mathematics from Qingdao University, China in 2002, his M.S. degree in computer software and theory from Qingdao University, China in 2005, and his Ph.D. degree in systems theory at Qingdao U-niversity, China in 2010. He is currently an associated professor in College of Information Engineering, Qingdao University. His research interests include complex network and data mining.