81 | P a g e
EXPERIMENTAL STUDY ON I-SHAPE AND C-SHAPE RCC STRUCTURE
BEHAVIOUR DUE TO WIND LOAD
Shweta Sunil Khandagale
PG Student, Civil Structural Engineering Department Rajarambapu Institute of Technology
Islampur, India
Dr. P. S. Patil
Professor, Civil Engineering Department Rajarambapu Institute of Technology
Islampur, India [email protected]
Abstract— Wind induced load is an important and essential design issue in the design of structures. This study present pressure coefficient for RCC structure of different geometric shapes. These shapes are C-shape, I-shape. The geometry of different shapes of building model were drawn by using CAD software. The pressure coefficient was calculated by IS code method. The IS 875 (Part 3)-1987 was used for the analysis of RCC structure of various geometric shapes. The experimental investigation & finite element analysis will be carried out to compare the results with IS code method. Experimental investigation is carried out in open circuit wind tunnel while the IS code analysis will be carried out using IS 875 (Part 3)-1987.
Keywords—Pressure distribution, Geometric shapes, IS code method, CAD, Open circuit wind tunnel.
I. INTRODUCTION
This part of dissertation work first discusses about IS code analysis on RCC structure behaviour due to wind load of various geometric shapes. Also the experimental work and introductory part of finite element analysis work is summarized. The geometry of different shapes of building models (L-shape, C-shape, I-shape) were drawn by using CAD software. The IS 875 (Part 3) - 1987 was used to find out pressure coefficient of structure. And for validation the finite element analysis and experimental work is carried out. Open circuit wind tunnel is used for experiment work.
II. EASE OF USE
Wind is natural movements of the air or the flow of gases on a large scale. Wind is classified by the scale, their speed, the type of forces that causes them, the region in which they occur, and their effect. Wind has different aspect; the most important aspect is its density. There are different types of loads acting on the structure during the whole period of life. Wind induced loads is an important and essential design issue in the design of structures. For the designing of high rise buildings, industrial buildings, cable suspension bridges, electricity, transmission towers, telecommunication towers, chimneys etc. The wind tests is very important. So to avoid the failure of the structure due to wind loading the wind analysis is necessary.
The wind load is calculated by different methods such as using codes, software etc. One of method for calculation of wind load is the wind tunnel apparatus. Wind tunnel test is one of the important tools to analyse the wind effect.
A wind tunnel is tool used in aerodynamic research to experiment the effect of wind/air on the various objects. It is used in design of most major tall buildings to identify
the wind induced structural loads and responses for which the superstructure must be designed. Wind velocity, density of the free stream, surrounding conditions and terrain influence are the main criteria involved in determining wind loads in wind tunnel test.
In previous literature, research carried out effect of wind on high rise structure considering three shapes squares, rectangular and circular. But there is lack of research on the effect of wind on structures considering other shapes (C-shape, I-shape, Rectangular shapes). Hence there will be need to develop the guidelines for effect wind load on a structures of various geometric shapes.
III. ANALYTICAL AND EXPERIMENTAL INVESTIGATION
A. Geometric Details
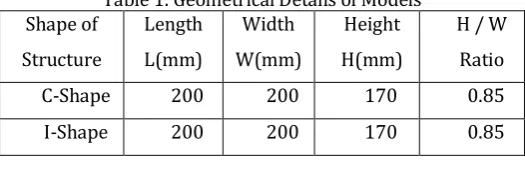
Three models have been used for the investigation of pressure coefficient for the pitched roof. These models has the different geometric shapes like C-Shape, Shape. I-Shape and C-I-Shape had the same length (L) of 200mm, same width (W) of 200mm and same height (H) of 170mm.
Table 1: Geometrical Details of Models Shape of
Structure
Length L(mm)
Width W(mm)
Height H(mm)
H / W Ratio
C-Shape 200 200 170 0.85
I-Shape 200 200 170 0.85
B. Investigation by Using IS Code:
The IS:875 (Part 3)-1987 Indian Standard Code of practice for Design Loads (Other Than Earthquake) for Buildings and Structures Part 3 Wind Loads was use for the investigation of a plane roof. The IS Code provides the wind pressure and forces on buildings and structures required for the wind analysis.
The IS: 875 (part 3) – 1987 deals with the wind load to be considered while designing building, structures and their components. The IS code includes,
The classification of terrain based on characteristics of the ground surface irregularities.
Forces and pressure coefficients for large range of clad and unclad buildings.
The drag coefficient for different structures
The external and internal pressure coefficient for gable roofs, curved roofs, butterfly type structures.
82 | P a g e For the calculation of wind load on the individual structural element, e.g., roofs, wall and individual cladding unit, it is essential to take account of the pressure difference between opposite faces. So for the clad or pitched roof structure, it is necessary to know the internal as well as external pressure. According to the IS: 875 (Part 3) - 1987 clause 6.2.1 the Wind load F is calculated by using the following formula,
F = ( Cpe- Cpi ) A Pd………..………(1) Where,
F = Wind Load
A = Surface area of structural element or cladding unit
Pd = Design Wind Pressure Cpe= External Pressure Coefficient Cpi = Internal Pressure Coefficient
External Pressure Coefficient:
The pressure coefficients are always given for a particular surface or part of the surface of the structure. The pressure coefficient (Cp) is the ratio of the difference between the pressures acting at a point on a surface and the static pressure of the incident wind to the design wind pressure. Average values of pressure coefficients are given for critical wind direction in one or more quadrant Pressure coefficients is used for calculation of forces on roof sheeting, glass panels, and the individual cladding surface. For the pitched roof having different pitch angles the external pressure coefficients are given in IS 875 (Part 3)-1987 Table No. 5. The external pressure coefficients are given in IS are for 00 and 900 wind direction. The external pressure coefficients are given for different building height ratio and for roof angles.
Three models of plane roof have been used for the analysis. These models has the different geometric shapes like I-Shape, C-Shape. I-Shape and C-Shape had the same length (L) of 200mm, same width (W) of 200mm and same height (H) of 170mm. The geometrical details are shown in Table 2
According to IS 875 (Part 3)-1987 Table No. 5, the building height ratios are required. The selected models were having the width (W) of 200mm and height (H) of 170mm, hence H/W=170/200=0.75
The table no. 2 shows the external pressure coefficient (Cpe) for wind angle 00 and 900 which is given in IS 875 (Part 3)-2015.
Table 2: External pressure coefficient (Cpe) values for plane roof analysis from IS 875 (Part 3)-2015
Sr. No.
Shape of Structure (Plan-Section)
Building Height
Ratio H / W
External Pressure Coefficient (Cpe) For Wind Angle 00 Windward Leeward
2 C - Shape 0.85 -0.8 -0.6
3 I - Shape 0.85 -0.8 -0.6
Analytical Calculation of External Pressure Coefficient: The external pressure coefficient for the is calculated by using the following formula,
Cpe= P-P∞ / 0.5Ϸ∞V∞2…..……… (2)
Where,
Cpe = External Pressure Coefficient
P =the pressure at the point at which pressure coefficient is being evaluated
Ϸ∞ = the pressure in the free stream V∞ = the free stream velocity C. Experimental Investigation
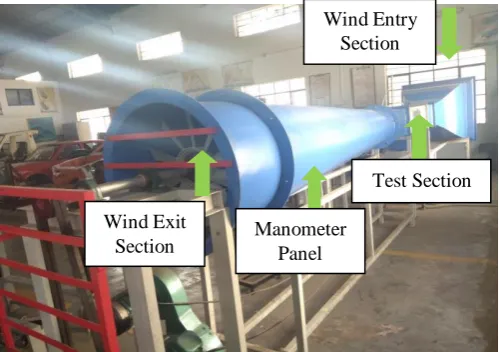
Wind tunnel testing is used in the design of most major tall buildings to identify the wind-induced structural loads and responses for which the superstructure must be designed. A wind tunnel is a tool used in aerodynamic research to experiment the effect of wind/air on the various objects. A wind tunnel consist of a tabular test section in which the object is to be tested. The air/wind is made to move from the object by a
x
powerful fan system. In the wind tunnel we measure the aerodynamic forces, pressure distribution, and other aerodynamic characteristics.For the experimental investigation the open circuit wind tunnel is used. Fig. 1 shows the open circuit wind tunnel used for the experimental investigation.
Figure 1: Open Circuit wind tunnel used for experimental investigation
Model Configuration and Testing -
For the experimental investigation the wind tunnel apparatus was used. The acrylic sheets of 6 mm thickness were used for the preparation of the models. The machine cutter is used for the cutting of the models. The pressure holes on models was drilled by using drilling machine. The copper wires were inserted at the pressure points to find the pressure. The models with different geometric shape was cast.
All the acrylic material models were tested in the wind tunnel apparatus for 6 different velocities 7m/s, 10m/s, 12.5m/s, 15m/s, 17.5m/s, 20m/s. The digital anemometer was used to check the wind velocity during the investigation. The 15 ports manometer is used to record the pressure difference at different pressure points. Figure 2 shows the cast models.
Wind Exit Section
Test Section
Manometer Panel
83 | P a g e Figure 2: Acrylic models of C-Shape, I-Shape, L-Shape
Pressure distribution obtained in experimental investigation-
The table shows the pressure distribution on the marked points for 7m/s, 10m/s, 12.5m/s, 15m/s, 17.5m/s, 20m/s wind velocities respectively.
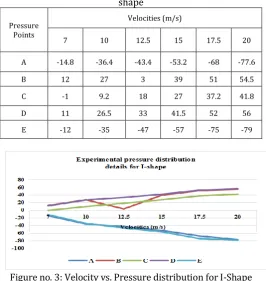
Table 3: Experimental pressure distribution details for I-shape
Pressure Points
Velocities (m/s)
7 10 12.5 15 17.5 20
A -14.8 -36.4 -43.4 -53.2 -68 -77.6
B 12 27 3 39 51 54.5
C -1 9.2 18 27 37.2 41.8
D 11 26.5 33 41.5 52 56
E -12 -35 -47 -57 -75 -79
Figure no. 3: Velocity vs. Pressure distribution for I-Shape by experimental analysis
Table 4: Experimental pressure distribution details for C-shape
Pressure Points
Velocities (m/s)
7 10 12.5 15 17.5 20
A -0.2 -0.4 -12.6 -19.4 -3.6 -31.8
B 12 11.5 18 21 25.5 27.5
C 9 12 12 11.33 17 11.33
D 10.5 7 22 31 43 44.5
E 10.33 18.33 19.66 27 37.66 40
Figure no. 4: Velocity vs. Pressure distribution for C-Shape by experimental analysis
Calculation of External Pressure Coefficient for the Experimental Investigation-
The external pressure coefficient for the cast model is calculated by using the eq.no. (2) For the calculation of external pressure coefficients for structure the pressure at the point is given in Table 3, 4 and 5respectively. The free stream velocity is calculated by using Pitot tube. The velocities were measured by using an anemometer.
External pressure calculation for I-shape for 10m/s velocity at point B is as follows,
P = the pressure at the point B = 27 Pa P∞ = the pressure in the free stream = 193 Pa Ϸ∞ = the free stream fluid density = 11.70N/m3 V∞ = the free stream velocity = 10m/s
Cpe= P-P∞ / 0.5Ϸ∞V∞2 = -0.28
According to the above formula all the external pressure coefficients were calculated. The external pressure coefficient for structure are given in table 3 and 4...
IV. RESULTS AND DISCUSSION
The results obtained by IS code and experimental are presented. The building models having different shape were analysed by Is code and experimentally tested for 7m/s, 10m/s, 12.5m/s, 15m/s, 17.5m/s, 20m/s wind velocities respectively. The results obtained for pressure distribution is discussed below.
External pressure coefficient Cpe for experiment investigation:
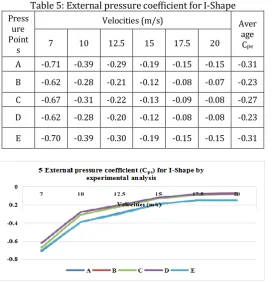
84 | P a g e Table 5: External pressure coefficient for I-Shape
Press ure Point
s
Velocities (m/s) Aver
age Cpe 7 10 12.5 15 17.5 20
A -0.71 -0.39 -0.29 -0.19 -0.15 -0.15 -0.31
B -0.62 -0.28 -0.21 -0.12 -0.08 -0.07 -0.23
C -0.67 -0.31 -0.22 -0.13 -0.09 -0.08 -0.27 D -0.62 -0.28 -0.20 -0.12 -0.08 -0.08 -0.23
E -0.70 -0.39 -0.30 -0.19 -0.15 -0.15 -0.31
Figure 5: External pressure coefficient (Cpe) for I-Shape by experimental analysis
Figure 5 shows the graphical representation of pressure coefficient vs. Velocity for I-shape by experimental analysis. The graph shows the pressure coefficient values for the wind velocities 7m/s, 10m/s, 12.5m/s, 15m/s, 17.5m/s, 20m/s.
Table 6: External pressure coefficient for C-Shape Press
ure Point
s
Velocities (m/s) Aver
age Cpe 7 10 12.5 15 17.5 20
A -0.66 -0.33 -0.26 -0.17 -0.13 -0.12 -0.29
B -0.62 -0.31 -0.22 -0.13 -0.10 -0.09 -0.25
C -0.63 -0.31 -0.23 -0.14 -0.10 -0.10 -0.27
D -0.63 -0.32 -0.22 -0.13 -0.09 -0.08 -0.25
E -0.63 -0.30 -0.22 -0.13 -0.09 -0.08 -0.24
Figure 6: External pressure coefficient (Cpe) for C-Shape by experimental analysis
Figure 6 shows the graphical representation of pressure coefficient vs. Velocity for C-shape by experimental analysis. The graph shows the pressure coefficient values for the wind velocities 7m/s, 10m/s, 12.5m/s, 15m/s, 17.5m/s, 20m/s.
B. Comparison of external pressure coefficient (Cpe):
The pressure coefficients for C-shape and I-shape were calculated. The experimental and IS code results for pressure coefficients were compared.
Table 7: Comparisons between IS code and Experimental results for average pressure coefficient
Structure Shape (Plan
section) Points
Average Cp
IS Code Experimental
I-Shape
Windward -0.8 -0.31
Leeward -0.6 -0.27
C-Shape
Windward -0.8 -0.29
Leeward -0.6 -0.27
Table no 7 shows the comparison between IS code and experimental results of average pressure coefficient for windward and leeward side.
V. CONCLUSION
The objective of the present work is to compare IS code results and Experiment results for wind analysis on building.
1. The pressure coefficient for I-Shape and C-Shape as per IS: 875 (Part-3)-2015 are compared with experimental results, it is observed that experimental results on windward side and leeward side is more than specified by IS code. 2. The experimental analysis shows that the pressure
coefficient on windward and leeward decreases from bottom to top for all wind velocities.
3. The leeward side of the all two models shows the lower pressure coefficient than windward side. So we can say that windward side is critical section of the model.
REFERENCES Standard Code:-
IS: 875(Part-3) -2015 Indian Standard Code of Practice for Design Loads (Other Than Earthquake) For Buildings and Structures Part 3.
Book:-
Wind Effects on Building and Structures- by Dr. Keith J Eaton
Research
85 | P a g e geometric shapes.” Journal of Wind Engineering and Industrial Aerodynamics ELSEVIER, 133 (2014).P.P 181-190.
[2] Michael Jesson, Mark Sterling, Chris Letchford, Chris Baker, “Aerodynamic forces on the roofs of low, mid and high-rise buildings subject to transient winds.” Journal of Wind Engineering and Industrial Aerodynamics ELSEVIER, 143 (2015).P.P 42-49.
[3] Yan Zang, Partha Sarkar, Hui Hu, “An experimental study on wind loads acting on a high-rise building model induced by microburst like winds.” Journal Of Fluids And Structures ELSEVIER, 50 (2014) July.P.P 547-564.
[4] Y. Tamura, H. Kikuchi, K. Hibi, “Extreme wind pressure distribution on low-rise building models.” Journal of Wind Engineering and Industrial Aerodynamics ELSEVIER, 89 (2001).P.P 1635-1646.
[5] Gang li, Shi Gan, Yongrin Li, Li Wang, “Wind induced interference effects on low-rise buildings with gable roof.” Journal Of Wind Engineering And Industrial Aerodynamics ELSEVIER, 170 (2017) July.P.P 94-106.
[6] Aishe Zhang, Ming Gu, “Wind tunnel tests and numerical simulations of wind pressure on buildings in staggered arrangement.” Journal Of Wind Engineering And Industrial Aerodynamics ELSEVIER, 96 (2008) April.P.P 2067-2079.
[7] Y. Ozmen et al, “Wind flow over the low-rise building models with gabled roofs having different pitch angles.” Building And Environment ELSEVIER, vol.95,(2015) Sept. P.P 63-74.
![Improvements for Kosovo's spatial planning system / [presentation given in May 2011]](data:image/gif;base64,R0lGODlhAQABAIAAAP///wAAACH5BAEAAAAALAAAAAABAAEAAAICRAEAOw==)