An Improvement of Contourlet Transformand Its
Application to Image Retrieval
Jian Wu
The Institute of Intelligent Information Processing and Application Soochow University, Suzhou 215006, China
Email: [email protected]
Zhiming Cui, Pengpeng Zhao, Jianming Chen The Institute of Intelligent Information Processing and Application
Soochow University, Suzhou 215006, China Email: [email protected]
Abstract—Contourlet transform is an effective solution to
solve two or more dimensional singularity and has good direction and anisotropy. Against the shortage of ability of describing the spatial distribution characteristic of object’s edge information, this paper proposed a new image retrieval algorithm based on Contourlet transform, which blocks the indexed image and decomposes each sub-block images using Contourlet transform. At first, carry out weighted processing for sub-band data of each sub-block image, extract features with high classification ability from high and low frequency sub-band data, and give greater weight for those features with high classification ability. Then, according to the energy of each sub-block image, give greater weight for those sub-block image with strong texture characteristic. At last, retrieve the images using weighted Euclidean distance between two image feature vectors as image similarity. The experiment results show that our algorithm has good retrieval performance.
Index Terms—edge-spatial distribution; Contourlet
transform; image blocking; image retrieval
I. INTRODUCTION
At present, most image retrieval algorithms use the underlying characteristics of the images to describe them, such as color, texture, appearance, etc. The main purpose of shoes image retrieval is to retrieve and return the shoes whose styles people are interested in. As shoes’ edge information is abundant, the texture features of shoes should be considered more. Texture features are usually obtained by statistical methods, structural methods, model method and frequency-domain method, Including co-occurrence matrix, Markov random field model, wavelet transform, etc[1]. In 2002, based on the wavelet multi-scale analysis, Do and Vetterli put forward Contourlet Transform[2], which is a new non-adaptive, directional and multi-scale analysis and can achieve decomposition in any direction and on any scale. It is good enough to describe the contours and direction of the image texture information in pictures, which makes up
for the lack of the wavelet transform. Contourlet transform is a multi-resolution, local, and directional method of image representation. It has unique advantages when it is used to express a small, directional segment and contour[3].
Contourlet transform is currently used in image segmentation[4,5], image denoising[6,7], image fusion[8,9] and others[10], but less used in image retrieval application. Literature[11] studied the use of Contourlet transform in image retrieval applications, which proposed that the extraction of characteristic quantities have a high ability of classification from the high and low frequency sub-band data has a great improvement when compared to traditional Contourlet transform. Without considering the spatial distribution of directional texture information in the image, however, the effect of its application in this study of image retrieval is not good. In this paper, by decomposing each sub-block after blocking the searched image, we give greater weight to the sub-blocks have a higher texture feature based on the energy of each sub-block. While the local characteristics of the image, we also take considering the overall characteristics of the image into account. Experimental results show that the algorithm has a good retrieval performance.
II. CONTOURLET TRANSFORM
and low-frequency sampling signal, that is the high-frequency components. And then we continue the decomposition to the low-frequency components. At last, we get the entire multi-resolution image. We should use DFB filter to do the multi-directional decomposition to each high-frequency signal we get by LP decomposition. Contourlet transformation process is shown in Figure 1.
Figure 1. Contourlet transform structure schematic.
Contourlet transform domain can be extended from discrete space to continuous function in the square integrable space
L
2(
R
2)
. Just like the wavelet decomposition, Contourlet transform in the continuous domains to decompose the whole spaceL
2(
R
2)
into multi-scale, multi-dimensional sub-space sequence by the use of the iterative filter group. That is,))
(
(
)
(
,2
0 0 0
2
2 j
j l
l k j k j
W
V
R
L
⊕
⊕
= ≤
⊕
=
(1)In (1),
⊕
is an orthogonal summation, subspaceV
0 isan approaching component of the lowest scale, which is consisted of orthogonal base of scaling functions after its zoom and pan.
W
jl,jk is the balance unchanged directionalsubspace. If j, k, n are used respectively as the scale, orientation and location parameter, and then Contourlet function can be expressed as,
∑
∈−
=
2
)
(
)
(
)}
(
{
,, ,z m
m j l k l
k l
n k
j
t
g
m
S
n
t
j j
j
μ
ρ
(2)In (2),
g
klj is the low-pass analysis filter.μ
j,m(
t
)
isa frame defined in
R
2, Over-sampling matrixS
klj isdefined as,
⎩
⎨
⎧
<
≤
<
<
=
−− − −j j
j j
l l
l
l l
l k
k
diag
k
diag
S
2
2
),
2
,
2
(
2
0
),
2
,
2
(
1 1
1 1
(3)
In (3), parameter
k
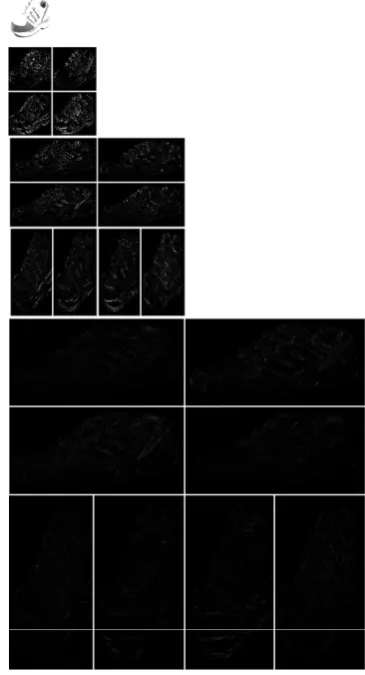
determines the direction of the DFB Analysis.Meixue and others have studied the effect Contourlet transform decomposition scale to the separation degree of different types of target. It was found that the separation degree between classes of third level sub-band is max[13]. This paper uses three-level LP decomposition and the numbers of each direction sub-band are respectively 4,8,8.
Figure 2 is a three-level, eight-direction Contourlet transform rendering of the athletic shoes.
Figure 2. All sub-bands after Contourlet transform
III. FEATURE EXTRACTION ALGORITHM
A. Thinking of Image Blocking
Contourlet transform mainly takes the signal’s global characteristics into account. In order to consider image local features as well as global features, in this paper blocking Contourlet transform algorithm is used to extract the sub-band coefficients of each sub-block of the image. Feature extraction algorithm is shown in Figure 3.
2 2 2 2 2 2
1,1 1,2 1,1 1,2 1,2 1,2 2,1 2,2 2,1 2,2 2,2 2,2
,1 ,2 ,1 ,2 ,2 ,2
, ,..., , ,..., , ,... , ,..., , ,..., , ,... ...
, ,..., , ,..., , ,...
N N N N N N
μ μ σ σ τ τ
μ μ σ σ τ τ
μ μ σ σ τ τ
Figure 3. Feature extraction algorithm schematic based on blocking Contourlet transform
The procedure is as follows:
Multi-direction image
Multi-resolution
Sub-band
(2,2)
(1) Read the image.
(2) Divide the image into N×N blocks and we get
2
N sub-blocks.
_
{(
1) *
}
(
,[(
1) *
1,
(
1) *
1,
1,
1])
image strel i
n
j
imcrop image
j
width
i
width
width
width
−
+
=
−
+
−
+
−
−
(4)In formular (4), width is the side length of each block and imcrop is used to cut the image.
(3) Calculate each sub-block’s Contourlet feature
{ }
Character i
.
After blocking the image, implement Contourlet transform to each sub-block, and then extract mathematical characteristics of directional sub-band’s coefficient distribution from every level in each sub-block of the image as the characteristics vector.
(4) Give each sub-block weight.
After blocking, not every sub-block can well reflect the image texture information and their contributions to the description of image’s texture features are different. Effective sub-blocks’ weights can help us effectively improve the retrieval precision.
B. High-frequency Sub-band Features
After blocking Figure 2, we can implement the Contourlet decomposition to it. Figure 4 shows the edge statistical information of any three sub-bands’ coefficients from 1,2,3 level of the upper left corner of the image sub-block. Abscissa represents the transform coefficients after transformation while Ordinate
represents the frequency number of coefficients.
(a) Sub-band 1, layer 1
(b) Sub-band 4, layer 2
(c) Sub-band 7, layer 3
Figure 4. Statistical histogram of sub-bands’ coefficients of every Layer
As can be seen from the figure that Contourlet coefficient’s probability distribution has a very sharp peak in the zero, both sides are long tails and the value is closer and closer to zero and the peak is more and more prominent with the number of layers growing.The rest scale and direction of the image are also like this. The distribution of sub-band coefficients of Image’s Contourlet transform is in line with the generalized Gaussian distribution. From the view of sparse, Contourlet transform can be used to express the original images more sparse.
After implementing Contourlet transform to the image, sub-band coefficients in different directions and different scales can be obtained. Amplitude values of these coefficients characterize the energy of the image in different directions and scales. The formula of calculating the mean
μ
kl and standard deviationσ
klof Contourlet decomposition coefficients of sub-bands in every direction are as follows:| ) , ( | 1
1 1
∑ ∑
= =
×
= M
i N
j kl
kl
w
i
j
N
M
μ
(5)∑ ∑
= =
− ×
= M
i N
j
kl kl
kl
M
N
w
i
j
1 1
2 ) ) , ( ( 1
μ
σ
(6)In (5) and (6),
M
×
N
is the size of Contourlet decomposition’s sub-band,μ
kl is the mean of thesub-band l in layer k and
σ
kl is the standard deviation ofthe sub-band l in layer k.
C. Low-frequency Sub-band Features
features of the image. In 1979, Hralick raised 14 representative texture features from GLCM, which include four texture features as follows:
a) Energy
∑ ∑
− = − ==
1 0 1 0 21
(
,
)
n j n j
j
i
p
Q
(7)b) Entropy
1 1 2
0 0
( , ) ln ( , ) n n
j j
Q p i j p i j
− −
= =
=
∑∑
(8)c) Moment of inertia
∑ ∑ ∑
− = − = − ==
1 0 1 0 1 0 23
{
(
,
)
}
n k n i n j
j
i
p
n
Q
(9)d) Relation 2 2 1 0 1 0 4
)
,
(
y x n i n j y xj
i
ijp
Q
σ
σ
μ
μ
∑ ∑
− = − =−
=
(10)In the formulas above,
∑ ∑
− = − ==
1 0 1 0)
,
(
n i n jx
i
p
i
j
μ
∑ ∑
− = − ==
1 0 1 0)
,
(
n i n jy
j
p
i
j
μ
∑
−∑
= − =−
=
1 0 1 0 2 2)
,
(
)
(
n i n j xx
i
μ
p
i
j
σ
∑
−∑
= − =−
=
1 0 1 0 2 2)
,
(
)
(
n i n j yy
j
μ
p
i
j
σ
After calculating the characteristics of GLCM, their mean and standard deviation are calculated as the final feature vector.
D. Sub-block Weighting
Since the amplitude value of Contourlet coefficients response the change in direction at different scales of the image. The energy reflects image texture features in a particular direction and scale. The sub-band’s energy is , smaller, texture features are weaker. So the energy of each sub-block can be used to reflect their contribution to the search.
The energy of Contourlet transformcan be approximated as:
∑
∑
=
=
Cmm n n
km km
k
n
y
i
j
E
1 * 2 2 1)]
,
(
[
1
(11))
1
(
k
N
2E
k≤
≤
represents the sum of energy of the k sub-block.C
m represents the number of thesub-band in the kth sub-block,
n
km represents the number ofthe mth sub-band’s coefficient in the k th sub-block,
)
,
(
i
j
y
km represents Contourlet coefficient on the Sub-band position ( , )i j . As the sub-block energy reflects thetexture features, if the energy sub-block is greater, the texture is stronger, so greater weight should be given to it. On the contrary, it should be given smaller weight. Suppose the kth sub-block has a weight of αk,
2 1 k k N k k
E
E
α
==
∑
(12)IV. ALGORITHM IMPLEMENTATION
In this paper, a three-layer Contourlet transform is implemented, and the sub-band’s number of every layer is 4,8,8. Finally, it will produce a 48-dimensional feature vector, which is used in image retrieval, the vector is expressed as:
1 2 20 1 2 20 1 2 8
[ , ,..., , , ,..., , , ,..., ]
character=
μ μ
μ σ σ
σ τ τ
τ
(13)Block Contourlet algorithm is used for feature extraction of every sub-block. Then we get N2×48
features as follows.
2 2 2 2 2 2
1,1 1,2 1,1 1,2 1,2 1,2
2,1 2,2 2,1 2,2 2,2 2,2
,1 ,2 ,1 ,2 ,2 ,2
,
,...,
,
,...,
,
,...
,
,...,
,
,...,
,
,...
...
,
,...,
,
,...,
,
,...
N N N N N N
μ μ
σ σ
τ τ
μ μ
σ σ
τ τ
μ
μ
σ
σ
τ
τ
As the statistic of various features is different dimension, in order to express the similarity better, we use the weighted Euclidean distance to measure three types of feature extracted in the previoussection, the formula is as follows:
20 40 2 2 1 2 1 21 48 2 3 41 ( ) ( ) ( ) ( )
xi mi xi mi
i i
xi mi
i
D k ω μ μ ω μ μ
ω μ μ = = = = − + − + −
∑
∑
∑
(14)In the formula,
ω
1,
ω
2,
ω
3 represent distinguishing weight correspondingly, andω
1+
ω
2+
ω
3=
1
,xi
μ
represents the feature vector of the retrieved image,mi
μ
represents the feature vector of the mth image.k
D
is the distance among the kth sub-image, then the similarity between two images can be expressed as:2
1 N
k k
k
Dist
α
D=
=
∑
(15)extracted respectively and the 600 test images make up the test image library.
One of the important steps in the algorithm is to divide the image into several blocks. The property of image retrieval using theContourlet algorithm which is on basis of the “block” is better than which is not. But the different method for dividing the image will lead to different results. With the increasing of the block’s number, it is difficult to fine the statistical properties of sub-block and it will also influence the final retrieval results. Three block-dividing methods are proposed in the experiment, they are 2×2, 3×3 and 4×4. 10 images are randomly selected from each class and there are 60 queries. Table 1 shows that search results of six kind’s shoes when the block numbers are 2×2, 3×3 and 4×4 andthe searching number is 50.
TABLE I.
RETURNED RESULTS ON DIFFERENT DIVIDING METHOD
No. type of shoes 2×2 3×3 4×4
1 high-heeled shoes 58% 76% 70%
2 boots 99% 90% 85%
3 sport shoes 58% 74% 88%
4 flats 53% 73% 44%
5 slippers 89% 90% 85%
6 sandals 56% 58% 36%
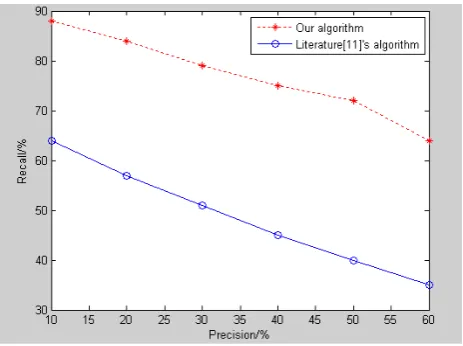
Table 1 figures out that there is difference among the adaptability of different method. For comprehensive, the 3×3 method is chosen in the experiment. In this paper,precision rate and recall rate are used as the evaluation rules of similarity retrieval. In the same retrieval conditions,the higher precision rate and recall rate are, the better the corresponding algorithm is. The algorithm in this paper compares with the algorithm from literature 11. Without loss of generality, 20 images are randomly selected from each class as examples of each experiment and we then get 120 queries. Figure 5 shows the retrieval results of two algorithms.
(a)The comparison of precision rate when changing the number of images
(b)The comparison of the relationship between precision rate and recall rate
Figure 5. The performance of two algorithms
From figure 5, we can see that the average precision rate of two algorithms decreases while the number of the returned images increasing. And the algorithm proposed in this paperis much better than the algorithm proposed by literature [11]. Literature [11] partly solve the problem that traditional Contourlet transform did not make full use of the coefficient of high-frequency and low frequency sub-band, but it has the drawback that the image’s space distribution about directional texture information is poor presented, and it is lack of the ability to describe the distribution character of the edge information space of target.
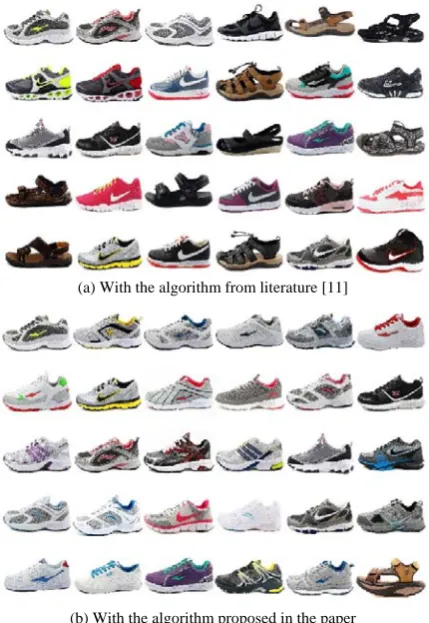
In order to visually analyze the retrieve results of two algorithms, sport shoes and slippers are selected for testing.Figure 6 is a test for sports shoes and Figure 7 is a test for slippers. Figure 6 and 7 show the retrieval result of the same query instance when the two algorithms return 29 images. In figure 6 and 7, the image on the top left corner is a query instance, the rest 29 ones are the results. The similarity decreases between the query instance and the results from left to right, and top to bottom in the figures.
(a) With the algorithm from literature [11]
(b) With the algorithm proposed in the paper
Figure 6. The retrieval results for the same query instance (sport shoes)
(a) With the algorithm from literature [11]
(b) With the algorithm proposed in this paper
Figure 7. The retrieval results for the same query instance (slippers)
To illustrate the retrieval results of different class using two algorithms, we randomly select 30 images from each class as the query image and retrieve 180 times in the library. The average precision rate for each class is used to evaluate the effect of retrieval results. Figure 8 shows the average precision rate of six classes using two algorithms when the number of returned querying images is 50.
Figure 8. The comparison of the precision rate of different class with two algorithms
From Figure 8, we know that two algorithms have distinctly difference about the precision rate of different class images. The algorithm in this paper is better the algorithm proposed in literature [11]. Especially for four classes of No.1, No.2, No.3 and No.5, the algorithm in this paper is obviously better than the one literature [11] proposed.
VI. CONCLUSION
ACKNOWLEDGEMENT
This research was partially supported by the Natural Science Foundation of China under grant No. 60970015, 61003054 and 61170020, the 2009 Special Guiding Fund Project of Jiangsu Modern Service Industry (Software Industry) under grant No. [2009]332-64, the Program for Postgraduates Research Innovation in University of Jiangsu Province in 2011 under grant No.CXLX11_0072, the Applied Basic Research Project (Industry) of Suzhou City under grant No. SYJG0927 and SYG201032, and the Beforehand Research Foundation of Soochow University.
REFERENCES
[1] G Rafiee, S S Dlay, W L Woo. A Review of Content-based Image Retrieval[J]. The Seventh International Symposium on Communication Systems, Networks and Digital Signal Processing, Newcastle upon Tyne, United kingdom, July 21-23, 2010, 775-779.
[2] Do M N, Vetterli M. Contourlets: a New Directional Multiresolution Image Representation[C]. The Thirty-Sixth Asilomar Conference on Signals, Systems and Computers, Pacific Grove, CA, USA, Nov. 3-6, 2002, 497-501.
[3] Do M N, Vetterli M. The Contourlet Transform: an Efficient Directional Multiresolution Image Representation [J]. IEEE Transactions on Image Processing, 2005, 14(12):2091-2106.
[4] Zhong Hua, Jiao Li-cheng, Hou Peng. Retinal Vessel Segmentation Using Nonsubsampled Contourlet Transform[J]. Chinese Journal of Computers, 2011, 34(3):574-582.
[5] Gang Liu, Xiao-Geng Liang, Jingguo Zhang. Contourlet Transform and Improved Fuzzy C-means Clustering Based Infrared Image Segmentation[J]. Systems Engineering and Electronics, 2011, 33(2):443-448.
[6] Wu Xiao-yue, Guo Bao-long, Li Lei-da. A New Image Denoising Method Combining the Nonsubsamped Contourlet Transform and Adaptive Total Variation[J]. Journal of Electronics and Information Technology, 2010, 32(2):360-365.
[7] Dai Wei, Yu Sheng-lin, Sun shuan. Image De-noising Algorithm Using Adaptive Threshold Based on Contourlet Transform[J]. Acta Electronica Sinica, 2007, 35(10):1939-1943.
[8] Li Guang-xin, Wang Ke. Color Image Fusion Algorithm Using the Contourlet Transform[J]. Acta Electronica Sinica, 2007, 35(1):112-117.
[9] Yang Xiao-hui, Jia Jian, Jiao Li-cheng. Image Fusion Algorithm in Nonsubsampled Contourlet Domain Based on Activity Measure and Closed Loop Feedback[J]. Journal of Electronics and Information Technology, 2010, 32(2):422-426.
[10]Jian Wu, Zhiming Cui, Pengpeng Zhao, Jian-ming Chen. Research on Vehicle Tracking Algorithm Using Contourlet Transform[C]. The 14th International IEEE Annual Conference on Intelligent Transportation Systems, Washington DC, USA, Oct. 5-7, 2011, 1267-1272.
[11]Huang Chuanbo, Shao Jie, Wan Minghua, Jin Zhong. Image retrieval using Contourlet transform[J]. Computer Engineering and Applications, 2009, 45(3):24-27.
[12]Lin Li-yu, Zhang You-yan, Sun Tao, et al. Contourlet Transform—Image Processing Applications[M]. Beijing: Science Press, 2008:28-42.
[13]Mei Xue and Xia Liang-zheng. Object Invariant Feature Extraction in Contourlet Field[J]. Computer Science, 2010, 37(11):275-277.
Jian Wu was born in Nantong on the 29th April, 1979, and got master degree in the field of computer application technology from Soochow university, Suzhou city, China in 2004. The main research direction is computer vision, image processing and pattern recognition.
He works as a teacher in the same college after his master graduation. Now he is pursuing the doctoral degree. He was awarded the Third Prize of 2007 Suzhou City Science and Technology Progress and the 2008-2009 Soochow University Graduate Scholarship Model.
Zhiming Cui was born in Shanghai on July, 1961. Professor, PhD Candidate Supervisor. The main research direction is deep web and video mining.
Pengpeng Zhao was born in Suzhou on March, 1980. Associate professor. The main research direction is Deep Web, Web data extraction and mining.