A Robust Method for Spike Sorting with Overlap
Decomposition
Min Dai
Tianjin Key Lab of Intelligent Computing & Novel Software Technology, Tianjin University of Technology, Tianjin 300191, PR China
Email: [email protected]
Jing Luo
Key Laboratory of Computer Vision and System, Ministry of Education, Tianjin University of Technology, Tianjin 300191, PR China
Email: [email protected]
Abstract—It is difficult to identify the spikes to different classifications especially when the neurons have many similar spike waveforms or lots of overlapped spikes. Our previous study proposed the window-slope representation (WSR), and it improved the classification accuracy of high similar spike waveforms. The classification accuracy of the method, however, will be affected by lots of overlapped spikes or low signal-to-noise ratio. In this paper, the second-order difference method is introduced to solve those problems. First the second-order difference of every spike is calculated to describe the convexity–concavity of the waveform. Then we use the window-slope representation to describe the tendency of waveform at each time. The method is tested at various signal-to-noise ratio levels based on simulation data coming from the Wave_clus. The experiment results show that the accuracy of classification can be improved by using the method together with K-means Cluster. In our experiments, the classification accuracy is above 95% on all datasets in Wave_clus, even under the low signal-to-noise ratio. It shows that this method has a strong robustness.
Index Terms—spike sorting; second-order difference; window-slope representation; overlapped spikes; K-means clustering
I. INTRODUCTION
The neuron is the basic structure and functional unit of the nervous system, it will generate stereotyped electrical pulses termed with action potentials or spikes when it is stimulated. Most neurons in the brain communicate with each other by firing spikes. Researching the spike’s activity regulation is an important approach to get close to the mystery of the human’s perception and sensing process, while the premise is to determine which spike comes from which neuron, this process is collectively referred to as “spike sorting”[1].
Generally, there are thousands of neurons in human body, and the spike waveforms generated by different
neutrons are different, which is the physiological basis for spike sorting [1]. Several methods of spike sorting have been put forward in the past work, such as clustering analysis[1,2], artificial neural network[3,4], templates matching[5], SVM(Support Vector Machine)[6-8], ICA(Independent Component Analysis)[9] ,etc. The classification results are often unsatisfactory when these methods are directly used to raw spike data. Some people made a change on the basis of these methods, which is to process and optimize the raw data. The current optimized methods are wavelet transformation [10], Principal Component Analysis [11, 12], etc. Combining with the classification algorithms, these optimized methods may reduce the spike dimension and improve the classification accuracy. But when the spike waveforms are very similar or there are too many overlapped spikes, the classification accuracy of these optimized methods declined significantly [13].
A feature representation called window-slope representation was proposed in our early work, this method is very profitable to classify the similar spikes and the classification accuracy increased greatly. But when there are lots of overlapped spikes and the signal-to-noise ratio is too low, the classification accuracy of this representation declined. So in this paper, we introduced the second-order difference. The second-order difference representation can describe the convexity-concavity of the waveform at each time. Through the combination of the second-order difference representation and the window-slope representation, the characteristics can be described better. A lot of experiments show that, using this new representation, the classification accuracy increased significantly especially for the overlapped spikes, besides this representation method had a strong robustness.
A. Features Overview of Spikes
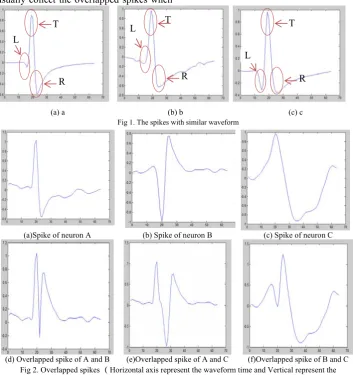
Generally, the spike waveforms generated by different neutrons are different, but in some cases the spikes coming from different neurons are very similar (see Fig 1). When the spike waveforms are very similar, the classification accuracy of many traditional methods will far degrade severely.
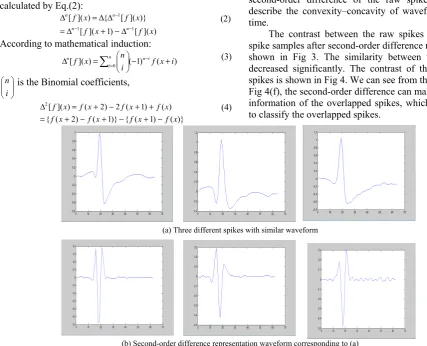
In addition, there are many neurons around in the multi-electrode array collection (MEA).The single electrode will usually collect the overlapped spikes when
more than one neuron firing at the same time (see Fig 2). The spike in Fig 2(d) was superimposed by spike of neuron A and B, there will be so many kinds of overlapped spike waveforms because of the different spikes superimposed at different times, such as the spike in Fig 2(e) was superimposed by spike of neutron A and B and the spike in Fig 2(f) was superimposed by spike of neutron A and C. Since the overlapped spikes, there will be so much detail information of spikes lost, which will improve the difficulty of the spike sorting.
(a) a (b) b (c) c Fig 1. The spikes with similar waveform
(a)Spike of neuron A (b) Spike of neuron B (c) Spike of neuron C
(d) Overlapped spike of A and B (e)Overlapped spike of A and C (f)Overlapped spike of B and C Fig 2. Overlapped spikes( Horizontal axis represent the waveform time and Vertical represent the
amplitude)
B. Window-slope Representation
After a lot of experiments and observations, we can see that, although the height or width of different spike waveforms is very similar, the spike tendency of different spikes at each time is different, especially at the feature point time. The amplitude values are different distinctly at L、T、R in the three waveforms, and the traditional feature representation and classification methods cannot highlight the feature (see Fig.1).
According to the characteristics, a novel feature representation of spike waveform is proposed called window-slope representation (WSR) in our early work [14]. It can describe the change degree at each time, especially at the feature point time. This representation was proposed to analysis the similarity of the ECG
waveforms early [14]. In this paper, we used it for spike sorting. In this method a spike waveform is divided into a series of windows with the time interval σ, and the slope of maximum and minimum amplitude in a window are extracted as the alternative feature information. Then each spike is completely represented by a sum of the alternative feature information, and the alternative feature information is considered as spike features for sorting. Let x = (x (0), x (1),
"
, x (m-1)) represents a sample of the raw spike, x(i)(0≤i≤m−1) represents the i-th raw spike data points, and m is i-the dimension of x. Let y=(y(0), y(1),"
, y(n-1)) represents the corresponding alternative feature extracted from z, and n is the TL
R
T
L
R L
dimension. Then the k-th component of yi can be calculated by Eq.(6):
σ
σ σ
σ
σ , , ) min( , , ) max(
)
( = (i−1)+1 i+1 − (i−1)+1 i+1
i
x x
x x
k
y " "
0≤k≤(m+1)/σ (6)
Here σ is the width of the conversion window, and it is usually a fixed time interval or sampling interval. The width of the window σ should not be set too large, otherwise that is easy to lost detail information of waveform.
From Eq.(6), we can see that, when the window width σ is fixed, the bigger of the amplitude difference in
a window, the greater of value yi(k). This just reflects the sharp degree of the waveform change. On the other hand, this new representation reduces the dimension of the sample and noise interference.
In order to investigate the performance of the window-slope representation, we used the simulated datasets to validate. The experiment used the window-slope representation combining with K-means cluster [15], the experiment of the PCA combining with K-means cluster as the control group. The classification accuracy for overlapped spikes is shown in Table I.
TABLEI.
COMPARISON OF CLASSIFICATION ACCURACY
Dataset Raw data(%) PCA(%) Representation(%) Window-Slope
C_Difficult1_noise005 97 97.4 70.4 C_Difficult1_noise020 32.6 45.8 57 C_Difficult2_noise015 72.2 85.4 85.4 C_Difficult2_noise020 73.2 78.4 78.4 C_Easy1_noise040 84.8 91 88.4 C_Easy2_noise005 98.4 98.6 99.6
Here the dataset in Table I, each dataset contains lots of overlapped spikes. The spike similarity of C_Difficult1 and C_Difficult2 is very high, and the spike similarity of C_Easy1 and C_Easy2 is low. The noiseXXX means the noise level of each dataset, large values indicate greater noise. From Table I, we can see that, comparing to the method which used raw data and PCA representation, the window-slope representation improved the classification accuracy, but when the number of the overlapped spikes was large such as the dataset C_Difficult1_noise020, there are totally 3414 spikes in this dataset and 790 of
them are overlapped spikes, the accuracy is only 57% and the accuracy of the dataset C_Difficult1_noise005(767 of 3383 are overlapped spikes) even declined. So one of the defects of the window-slope representation is that it is not available for spike soring when there are too much overlapped spikes in the dataset.
In order to verify the robustness of this method, we carried out the same experiments at different noise levels for the same dataset. Part of the experiment results are shown in Table 2.
TABLEII.
THESPIKECLASSIFICATIONACCURACYATDIFFDRENTNOISELEVELS Dataset data(%)Raw PCA(%) Representation(%) Window-Slope
C_Easy1_noise005 99.4 99.4 97.4 C_Easy1_noise010 98.4 99.4 97.4 C_Easy1_noise015 98.4 99 96 C_Easy1_noise025 97.8 98.4 93.6 C_Easy1_noise030 97 98.4 89.4 C_Easy1_noise035 91.6 95.2 93.2 C_Easy1_noise040 84.8 91 88.4
From the Table II, we can see that, no matter used the raw data for K-means cluster or optimized the spike with PCA or window-slope representation, the classification accuracy all declined along with the increasing noise level. Thus, we can say that when the noise is server, the window-slope representation is not profitable for spike sorting and does not have a strong robustness.
C. Second-order Difference Representation
Although the window-slope representation can improve the classification accuracy when the spike waveforms are very similar, but the classification accuracy is still unsatisfactory when the overlapped spikes are too many or the signal-to-noise ratio is too low.
point. In mathematics, the difference is equal to the differentiator in the discrete function. The second-order difference is used to describe the convexity–concavity of the waveform at each time. So the second-order difference is introduced to describe the spike tendency in this paper. The calculate method of the second-order difference is as Eq.(1):
Δf(x)= f(x+1)−f(x) (1) Here △f(x) is the first-order difference of f(x), and the difference generally refers to the forward difference. The Δn[f](x) is called as the N-Order Difference of f(x), calculated by Eq.(2):
) ]( [ ) 1 ]( [ )} ]( [ { ) ]( [ 1 1 1 x f x f x f x f n n n n − − − Δ − + Δ = Δ Δ =
Δ (2)
According to mathematical induction: ) ( ) 1 ( ) ](
[ 0 f x i
i n x
f n ni
i
n − +
⎟⎟ ⎠ ⎞ ⎜⎜ ⎝ ⎛ = Δ − =
∑
(3)⎟⎟ ⎠ ⎞ ⎜⎜ ⎝ ⎛ i
n is the Binomial coefficients,
)} ( ) 1 ( { )} 1 ( ) 2 ( { ) ( ) 1 ( 2 ) 2 ( ) ]( [ 2 x f x f x f x f x f x f x f x f − + − + − + = + + − + =
Δ (4)
Here 2[ ]( )
x f
Δ is the second-order difference.Let x = (x (0), x (1),
"
, x (m-1)) represents a sample of the raw spike, x(i)(0≤i≤m−1) represents the i-th raw spike data points, and m is the dimension of x. Let z = (z (0), z (1),"
, z (p-1)) represents the corresponding alternativefeature extracted from x, and p(p=m-2) is the dimension of z. Then the k-th component of zi can be calculated by Eq(5): ) ( ) 1 ( 2 ) 2 ( )
(k x k x k x k
zi = i + − i + + i (5)
We can see from Eq.(5), the new spike sample is the second-order difference of the raw spike, which can describe the convexity–concavity of waveforms at each time.
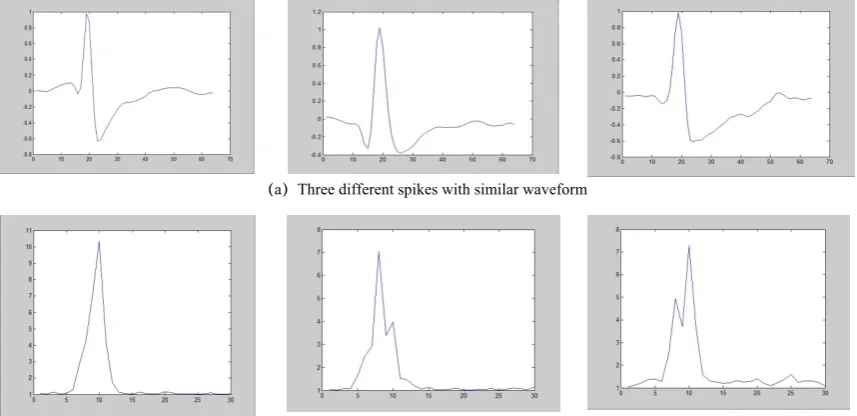
The contrast between the raw spikes and the new spike samples after second-order difference represented is shown in Fig 3. The similarity between the spikes is decreased significantly. The contrast of the overlapped spikes is shown in Fig 4. We can see from the Fig4(c) and Fig 4(f), the second-order difference can make up the lost information of the overlapped spikes, which can help us to classify the overlapped spikes.
(a) Three different spikes with similar waveform
(b) Second-order difference representation waveform corresponding to (a)
Fig 3. Second-order difference representation for similar spike waveforms(Horizontal axis represent the waveform time and Vertical represent the amplitude)
(d) Second-order difference
representation waveform for A representation waveform for B (e) Second-order difference representation waveform for (f)Second-order difference overlapped spikes Fig 4. Second-order difference representation for overlapped spikes(Horizontal axis represent the waveform
time and Vertical represent the amplitude)
D. Second-order Difference Combine with Window-slope Representaion
According to the characteristics of the window-slope representation and the second-order difference representation, we use the two representations for spike sorting. The combined representation can keep a high accuracy no matter how server the noise is or how large the number of the overlapped spikes is.
The contrast between the raw spikes and the new spike samples after second-order difference and window-slope representation represented is shown in Fig 5. The
combine representation can describe not only the convexity–concavity but also the tendency of the waveform. Comparing to the window-slope representation, the combined representation can decrease the similarity more greatly. The contrast of the overlapped spikes is shown in Fig 6. We can see from the Fig 6(c) and Fig 6(f), after represented by the combined representation, we can more easily identify which the overlapped spikes superimposed by, which can help us to classify the overlapped spikes.
(a)Three different spikes with similar waveform
(b) Second-order difference representation combine with WSR waveform corresponding to (a)
Fig.5 Second-order difference representation combine with WSR for similar spike waveforms (Horizontal axis represent the waveform time and Vertical represent the amplitude)
(d)Second-order difference representation combine with WSR
waveform for A
(e)Second-order difference representation combine with WSR waveform for b
(f)Second-order difference representation combine with WSR waveform for
overlapped spikes Fig.6 Second-order difference Representation combine with WSR for overlapped spikes
III.EXPERIMENTS AND RESULTS
In order to investigate the performance of the proposed method, we used the simulated datasets to validate our work. The simulated data are labeled with the originating neuron for each spike. This makes visual evaluation of the resulting clusters easier. The experiment data are provided with the Wave-clus software. The simulated dataset here includes four sets (with three type spikes in each) and each set was used to generate simulated continuous noisy neural signals with different levels of noise. These dataset are provided in MATLAB .mat files. There are approximately 3200~3600 spikes in each set.
A. Spike Classification Methods
This paper used the second-order difference and the window-slope representation to optimize the spike combining with K-means Cluster method for classification. The algorithm ideas outlined below:
1) Represent the original spike with second-order difference;
2) On the basis of the second-order difference , represent with the window-slope representation; 3) Given the number of cluster k, chose the first
signal spike of each class as the initial cluster center ;
4) For each sample, calculate its distance from each cluster center;
5) The samples are sorted into the nearest categories ,then recalculate the cluster center; 6) Repeat the step 4) and step 5) until all the
samples are classified;
7) Determine whether the cluster stop condition is satisfied. If true, then stop the algorithm, otherwise, remain the current cluster center, and return to the step 4), cluster all the samples again.
B. Experimental Results and Analysis
In order to compare the results of the experiment, in this paper , we carried out four experiments on each dataset: used the raw data for K-means cluster, (Take k=3, as is known in advance each dataset contains three type spikes in all the experiment data )、optimized the raw data with PCA as the new samples for K-means cluster, optimized the raw data with window-slope representation as the new samples for K-means cluster, optimized the raw data with second-order difference and window-slope representation as the new samples for K-means cluster. Table.3 shows the classification accuracy.
TABLEIII.
COMPARISONOFCLASSIFICATIONACCURACY
Dataset data(%)Raw (PCA%)
Window-Slope Representation(%)
Second-order difference combine with Window-Slope
Representation (%) C_Difficult1_noise005 97 97.4 70.4 99.2 C_Difficult1_noise020 32.6 45.8 57 99.4 C_Difficult2_noise015 72.2 85.4 85.4 100 C_Difficult2_noise020 73.2 78.4 78.4 99.9 C_Easy1_noise040 84.8 91 88.4 99.6 C_Easy2_noise005 98.4 98.6 99.6 99.9
Here the dataset in Table III, each dataset contains more overlapped spikes in the dataset of C_Difficult1 and C_Difficult2 than C_Easy1 and C_Easy2. From Table III, we can see that, comparing with other methods, the classification accuracy improved significantly when combined the second-order difference representation with window-slope representation, especially for the dataset
C_Difficult1_noise020 and C_Difficult1_noise005. The results show that the second-order difference method combining with window-slope representation is profitable for overlapped spike sorting.
for the same dataset. Part of the experiment results are shown in Table IV .
TABLE IV.
THESPIKECLASSIFICATIONACCURACYATDIFFDRENTNOISELEVELS
Dataset data(%)Raw PCA
(%)
Window-Slope
Representation(%) difference combine Second-order with Window-Slope
Representation (%) C_Easy1_noise005 99.4 99.4 97.4 99.2 C_Easy1_noise010 98.4 99.4 97.4 99.4 C_Easy1_noise015 98.4 99 96 99.2 C_Easy1_noise025 97.8 98.4 93.6 99.2 C_Easy1_noise030 97 98.4 89.4 99.8 C_Easy1_noise035 91.6 95.2 93.2 99 C_Easy1_noise040 84.8 91 88.4 99.6
Here the dataset in Table IV, the noiseXXX means the noise level of each dataset, large values indicate greater noise. The noise level in Table IV increases from noise005 to noise 040. From Table IV, we can see that, comparing with other optimized representation methods, the classification accuracy of this new representation keeps at a high level no matter how serious the noise is. This experiment proves that this new presentation has a strong robustness.
IV. CONCLUSION
The human body contains thousands of neutrons. And the spike sorting is very important for people to study the mystery of the neutron system. But it has always been difficult to identify the spikes to different classifications especially when noise is server or there are too many overlapped spikes. In this paper, we combined the window-slope representation with the second-order difference representation to optimize the spikes, which avoided the noise interference and improved the classification accuracy of overlapped spikes. We do a lot of experiments on dataset provided by the Wave-clus software. Experiment results shown that, comparing with PCA and window-slope representation, this method improved the classification accuracy significantly. In addition, with the increasing of the noise, the classification accuracy of PCA method will be obviously decreased. Using the method of this paper, the classification accuracy is always kept at a higher level even under the low signal-to-noise ratio. It shows that this method has a strong robustness.
ACKNOWLEDGEMENT
The paper is supported by Tianjin Natural Science Foundation (10JCYBJC00700) and Tianjin Key Foundation Foundation on science Supporting Plan(10ZCKFSF00800).
REFERENCE
[1] Weidong Ding, Jingqi Yuan, Peiji Liang. Study on the detection and sorting of multi-electrode neural spikes[J].
Chinese Journal of Scientific Instrument, 2006,27(12):1636-1640.
[2] Xinwu Li. A New Text Clustering Algorithm Based on Improved K_means[J]. Journal of Software, Vol 7, No 1 (2012), 95-101, Jan 2012.
[3] S. Gibson and et al., Comparison of spike sorting algorithm for future hardware implementation. Proceedings of conference IEEE EMBS, 2008: 5015 –5020.
[4] John J. Wade, Liam J. McDaid, Jose A. Santos, et al SWAT: A Spiking Neural Network Training Algorithm for Classification Problems [J].IEEE Transactions on neural networks, 2010,21(11):1817~1830.
[5] Pu-Ming Zhang, Jin-Yong Wu, Yi Zhou, etc. Spike sorting based on automatic template reconstruction with a partial solution to the overlapping problem [J]. Journal of Neuroscience Methods, 2004, 135: 55–65.
[6] Xuemei Zhang, Li Yang. Improving SVM through a Risk Decision Rule Running on MATLAB[J]. Journal of Software, Vol 7, No 10 (2012), 2252-2257, Oct 2012.
[7] Kyung Hwan Kim, Sung Shin Kim, Sung June Kim.
Advantage of support vector machine for neural spike train decoding under spike sorting errors[C].Proceedings of the 2005 IEEE Engineering in Medicine and Biology 27th Annual Conference,2005(5):5280~5283.
[8] Yaozhang Pan, Shuzhi Sam Ge, Feng Ru Tang, et al. Detection of Epileptic Spike-Wave Discharges Using SVM[C].16th IEEE International Conference on Control
Applications, Singapore: Control Applications,2007:467~472.
[9] Amir Madany Mamlouk, Hannah Sharp, Kerstin M.L. Menne, et al. Unsupervised spike sorting with ICA and its evaluation using GENESIS simulation [J].Neurocomputing,2005(65-66):275~282.
[10]Hansang Cho, D. Corina, G. A. Ojemann. A new neuron spike sorting method using maximal overlap discrete wavelet transform and rotated principal component analysis[C]. Cancun, Mexico: Proceedings of the 25th Annual International Conference of the IEEE, Vol.3. 2921-2924.
[11]Qifa Qu. Determination of Weights for the Ultimate Cross Efficiency: A Use of Principal Component Analysis Technique[J]. Journal of Software, Vol 7, No 10 (2012), 2177-2181, Oct 2012.
[13]Yun-Yu Chen, Tung-Chien Chen, and Liang-Gee Chen, “Ac-curacy and power tradeoff in spike sorting microsystems with cubic spline interpolation,” in Circuits and Systems (ISCAS), Proceedings of 2010 IEEE International Symposium on, Jun.2010, pp. 1508 –1511. [14]Tongtong Liu, Min Dai, Zhongyi Li. ECG Waveform
Similarity Analysis Based on Window-slope representation[J]. Journal of Computer Applications, 2012, 32(10), 2969~3972.
[15]H. Li, Q. Xu. Sub-threshold-based ultra-low-power neural spike detector[J].Electronics Letters, 2011,47(6): 367~368.
Min Dai Doctor,Professor of Tianjin University of Technology (TUT), the member of CCF and IEEE. The research direction is intelligent information processing, especially for biomedical Signal Processing.
Jing Luo Master degree candidates of