Proc. IAHS, 371, 203–209, 2015 proc-iahs.net/371/203/2015/ doi:10.5194/piahs-371-203-2015
© Author(s) 2015. CC Attribution 3.0 License.
Open Access
Non-stationar
ity
and
Extr
apolating
Models
to
Predict
the
Future
(HS02
–
IUGG2015)
Reliability of a conceptual hydrological model in a
semi-arid Andean catchment facing water-use changes
P. Hublart1,5, D. Ruelland2, I. Garc´la De Cortázar Atauri3, and A. Ibacache4 1UM2, UMR HydroSciences Montpellier, Montpellier, France
2CNRS, UMR HydroSciences Montpellier, Montpellier, France
3INRA, US 1116 AGROCLIM, Avignon, France
4Instituto de Investigaciones Agropecuarias, La Serena, Chile
5Centro de Estudios Avanzados en Zonas Áridas, La Serena, Chile
Correspondence to: P. Hublart ([email protected])
Received: 17 March 2015 – Accepted: 17 March 2015 – Published: 12 June 2015
Abstract. This paper explores the reliability of low-flow simulations by conceptual models in a semi-arid,
Andean catchment (30◦S) facing climate variability and water-use changes. Depending on water availability, a significant part of surface water resources are diverted to meet irrigation requirements. In return, these wa-ter withdrawals are likely to influence the hydrological behavior of the catchment. The value of model-based analyses thus relies on our ability to adequately represent the complex interactions between climate variabil-ity, human-induced flow perturbations and crop water use. In this study, a parsimonious hydrological model (GR4J) including a snow routine was combined with a model of irrigation water-use (IWU) to provide a new, 6-parameter model of the catchment behavior (called GR4J/IWU). The original, 4-parameter GR4J model and the 6-parameter GR6J model were also used as benchmarks to evaluate the usefulness of explicitly accounting for water abstractions. Calibration and validation of these three models were performed successively over two different 5-year periods representing contrasted water-use and climate conditions. Overall, the GR4J/IWU model provided better simulations than the GR4J and GR6J models over both periods. Further research is required to quantify the predictive uncertainty associated with model structures, parameters and inputs.
1 Introduction
The use of lumped, conceptual catchment models to evalu-ate the potential impacts of climevalu-ate change on the capacity to meet various water demands has gained considerable at-tention over the past decade. These models, however, are still openly criticized for their excessive reliance on calibrated pa-rameters and relative inability to cope with changing climate and anthropogenic conditions.
In irrigated catchments, seasonal and inter-annual varia-tions in temperature and precipitation should be expected to affect not only runoff generation and water availability but also crop growth and water-use. From this point of view, interdisciplinary approaches are required to incorporate cli-mate effects on crop phenology and evapotranspiration into current conceptual models. Any increase in irrigated areas or
any change in crop varieties may also alter the natural flow regime in such a way that currently available models can no longer be calibrated using the observed (influenced) stream-flow. Disregarding this fact can be particularly prejudicial to the reliability of model predictions during recession and low-flow periods. The poor performance of most conceptual mod-els during these critical periods is a well-recognized issue in the hydrological research community and many studies have formulated different approaches towards improving low-flow simulations. Very few of them, however, have attempted to explicitly account for the additional impact of river abstrac-tions for irrigation purposes at the catchment scale.
under-Figure 1.The Claro River catchment in Chile: (a) location of the cultivated areas in the valley floors, and (b) long term evolution of irrigated areas as estimated from national cadastral surveys conducted from 1980 to 2010 for two main varieties cultivated in the catchment.
standing of the hydrological processes should not necessarily translate into more complex models used in impact studies”. Indeed, maintaining low-dimensional, holistic modeling ap-proaches is essential to constrain parameter uncertainty and help the modelers focus on understanding the main drivers of hydrological change. This paper investigates one possible way of incorporating the effects of changes in crop types and irrigated areas over time into the parsimonious GR4J hydro-logical model. Particular attention is paid to the modeling of temperature effects on crop phenology so as to improve model reliability and usefulness under future climate condi-tions. The method is tested in a semi-arid catchment of the Chilean Andes, where recent studies have noticed a decline in water availability for irrigation purposes (e.g. Ribeiro et al., 2014).
2 Study area and data
2.1 General context
The Claro River catchment is a semi-arid, mountainous catchment located in north-central Chile (30◦S). It drains an area of about 1515 km2characterized by high elevations (820–5500 m a.s.l., Fig. 1a) and a series of granitic moun-tain blocks interspersed with steep-sided valleys. The valley-fill material consists of mostly unconsolidated alluvial sed-iments mantled by generally thin soils (< 1 m) of sandy to sandy-loam texture. Natural vegetation outside the valleys is extremely sparse and composed mainly of subshrubs and cushion plants with very low transpiration rates. Precipitation events occur mostly as snow during the winter months with extremely wet or dry years. The Claro River originates from a number of small, snowmelt-fed tributaries flowing either permanently or seasonally in the mountains.
Grape growing is by far the main agricultural activity in the catchment. Vineyards cover most of the valley floors and lower hill slopes (Fig. 1), where they benefit from a unique
combination of clear skies, high temperatures and overall dry conditions during the summer months. Grape growers, however, depend entirely on surface-water resources to sat-isfy crop water needs. All grapes are grown to be exported as early-season table grapes or processed into a brandy-like national drink known as pisco. Table varieties are mostly drip-irrigated while pisco varieties remain largely furrow-irrigated. Cultivated areas have, on the whole, achieved a dramatic increase from 1980 to the early 1990s, before sta-bilizing at about 1500 ha during the last 15 years (Fig. 1b.). Interestingly, pisco varieties prevailed over table ones from 1980 to around 1996 before reaching a limit of 850 ha in the early 2000s.
2.2 Hydroclimate and phonological data
Available precipitation and temperature data from respec-tively 12 and 8 stations were interpolated using the inverse distance weigthed method on a 5×5 km grid. Orographic ef-fects were considered by extrapolating catchment-averaged precipitation and temperature to the mean altitudes of five el-evation bands of equal area. To this end, a constant lapse rate of−5.5◦C km−1 (estimated from the data) was chosen for temperature and the exponential method described in Valéry et al. (2014) was applied to precipitation with a correction factor of 7.10−4m−1. Potential evapotranspiration was then computed using a version of the Oudin formula (Oudin et al., 2005) adapted to the Claro River catchment (for more details see Hublart et al., 2014).
Phenological observations were carried out over a 10-year period (2003–2013) at the Instituto de Investigaciones
Agropecuarias (INIA) located a few kilometers downstream
be-ginning of harvest depends on the intended use of the grapes. Table varieties generally require lower sugar contents (∼16◦ Brix) than those dedicated to the production of pisco (22◦ Brix), which are generally harvested a few months later. A final phenophase covers the post-harvest period that runs un-til the end of leaf fall (LF). To account for the huge differ-ences in the timing of phenological events between table and pisco varieties, two emblematic varieties among those used in this experiment were selected: Flame Seedless was chosen to represent table varieties and Moscatel Rosada was chosen to represent pisco varieties.
3 Modeling framework
3.1 Hydrological modeling
The GR4J hydrological model (Perrin et al., 2003) was com-bined with a model of irrigation water-use (IWU) to provide a new conceptual model of the catchment behaviour (here-after referred to as “GR4J/IWU”). The original 4-parameter GR4J model and the 6-parameter GR6J model developed by Pushpalatha et al. (2011) to improve low-flow simulations were also used as benchmarks to evaluate the usefulness of explicitly accounting for water abstractions.
IWU (m3s−1) was computed as a function of irrigation water requirements (IWR, in mm d−1) and surface-water availability:
IWU=min
"
0,min
" X
i
IWRi×Ai/8640, Qn,sim−Qmin
##
(1)
where Qn,sim (m3s−1) is the natural streamflow simulated by the GR4J model before accounting for water withdrawals andAi (ha) is the irrigated acreage for crop varietyi, which varies on a yearly basis as shown in Fig. 1b.Qmin(m3s−1) is a minimum discharge below which no withdrawal is al-lowed. This parameter was fixed at 0.25 m3s−1based on his-torical low-flow records. Simulated (influenced) discharge at the catchment outlet was computed from the difference be-tween Qn,sim and IWU at each time step. IWR were esti-mated using a simple soil-water balance approach and three temperature-based phenological models. For each crop vari-etyi:
SWCi(t)=SWCi(t−1)+PValley(t)+IWRi(t)−ETMi(t) (2)
ETMi(t)=KC,i(t)×PEValley(t) (3)
IWRi(t)=max [ 0,ETMi(t)−SWCi(t−1)
−PValley(t) ] (4)
where ETM refers to crop evapotranspiration under optimal conditions (mm d−1) and SWC to the average soil-water con-tent in the root zone (mm).PValleyand PEValleyare the areal
precipitation and potential evapotranspiration in the valleys (mm d−1), andKCis a coefficient depending on crop growth stages. Interpolated KC curves were constructed for each crop variety using the annual dates of budburst, full bloom, harvest and leaf fall simulated by the phenological models and the value ofKC at each of these dates:KC,BB,KC,FB, KC,HVandKC,LF. In this study,KC,BBandKC,LFwere fixed at zero whileKC,FBandKC,HVwere added to the GR4J na-tive parameters in calibration.
Finally, a modified version of the CEMANEIGE model (Valéry et al., 2014) was used to account for snow accumu-lation and melt processes within each elevation band. This model introduces two additional parameters to account for the snowpack cold-content and subsequent effects of posi-tive temperatures. In this study, it was modified to include sublimation losses, which can be very important in north-central Andes (a detailed description of this modification is postponed to a later publication). In the end, the hydrologi-cal models including the CEMANEIGE snow module relied on respectively six (GR4J) and eight (GR6J and GR4J/IWU) free parameters.
3.2 Phenological modeling
A simplified version of the 7-parameter UniChill Model pro-vided by Chuine (2000) was chosen to simulate the an-nual dates of budburst (tBB) for each grapevine variety. This model covers the periods of endormancy, where growth in-hibition is due to internal physiological factors, and ecodor-mancy, where buds remain dormant because of inadequate environmental conditions. To emerge from endodormancy, grapevines require an extended period of low temperatures which was represented as an accumulation of chilling rates RC:
CBB= t1
X
t=t0
RC(T) (5)
RC(T)=
2
1+expa(T −b)2 (6)
whereT is the average daily temperature in the valley andt0, a,bandCBBare fitted parameters. A sensitivity analysis (not shown here for brevity’s sake) was performed to determine the optimal value fort0, i.e. the starting date of the growing season. Likewise, to emerge from ecodormancy grapevines require an extended period of high temperatures which was represented as an accumulation of forcing ratesRF:
FBB= tBB
X
t=t1
RF(T) (7)
RF(T)=
1
1+exp [c(T −d)] (8)
with the usual base temperature of most degree-day models applied to grapevine. Overall, 5 parameters required calibra-tion for the simulacalibra-tion of budburst dates. The 4-parameter model developed by Wang and Engel (1998) was then chosen to simulate the annual dates of full bloom (tFB) and harvest (tHV):
FFB= tFB
X
t=tBB
RF(T) andFHV= tHV
X
t=tFB
RF(T) (9)
RF(T)= (
2(T−Tmin)α Topt−Tminα−(T −Tmin)2α
Topt−Tmin2α
ifTmin≤T ≤Tmax (10)
otherwise
with α=log (2)/log(Tmax−Tmin)/ Topt−Tmin
(11)
WhereTopt(◦C),Tmin(◦C) andTmax(◦C) are fitted param-eters which were calibrated separately for each phenologi-cal event (full bloom and harvest), and FFB and FHV are fitted parameters calibrated for full bloom and harvest, re-spectively. Finally, the post-harvest period was modelled as a constant number of days (NLF) betweentHVand the end of leaf fall (tLF). The value ofNLFwas obtained from interviews with local grape growers for each variety.
3.3 Calibration and validation strategies
The phenological models were calibrated over the whole dataset (2003–2013) using the Shuffle Complex Evolution (SCE) algorithm (Duan et al., 1993) to minimize the root-mean-square error (RMSE) between simulated and observed phenological dates. Given the small number of available ob-servations, a leave-one-out cross validation technique was chosen to assess the robustness of each model. Additional metrics such as the Nash-Sutcliffe Efficiency (NSE) were also used in validation to characterize modeling errors.
The hydrological models were calibrated and validated over several 5-year periods using the SCE algorithm to max-imize the following criterion:
Fobj=(KGE+KGEi)/2 (12)
where KGE and KGEi refer to the Kling-Gupta Efficiency (Gupta et al., 2009) computed from discharge and inverse discharge values, respectively. This composite criterion was chosen to emphasize recession and low-flow periods (Push-palatha et al., 2012). All models were run at a daily time step but calibrated using a 10-day time step to reduce the effect of structural inadequacies. In particular, a 10-day delay was considered sufficient to ensure that all return flows caused by conveyance and field losses have come back to the river system and that any difference between furrow and drip irri-gation scheduling are negligible. Likewise, the two grapevine
varieties selected to represent phenological variations among crop varieties are at best a rough approximation of the real crop diversity used in the catchment.
The simulation periods were chosen so as to represent contrasted climate and water-use conditions over the last 30 years. For conciseness, however, only two of them will be considered in the following sections. The first one (1989– 1994) is characterized by relatively dry conditions and a nearly 50 % increase in irrigated areas (dominated by pisco varieties). The second one (1999–2004) is associated with the El Niño event of 2002–2003 and characterized by quasi-constant irrigated areas (dominated by table varieties). Each of these periods was successively used in calibration and val-idation.
4 Results
4.1 Phenological modelling
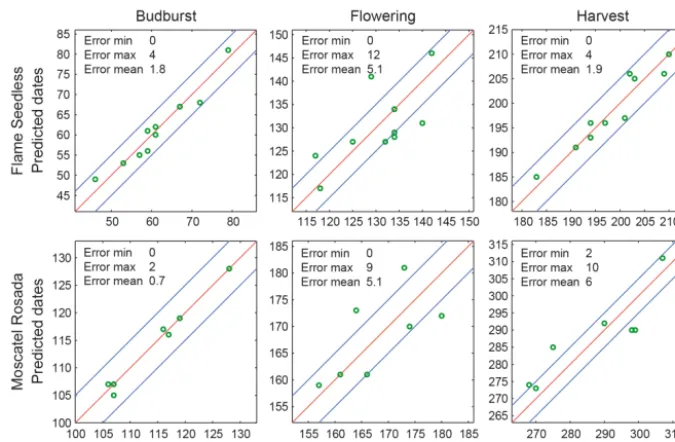
The results obtained with the phenological models are sum-marized in Fig. 2 and Table 1. Interestingly, the RMSE, NSE and bias values obtained with the three models did not show significant variation between calibration and validation. The NSE values were positive in all cases, the best performances being obtained for budburst (NSE > 0.90) and the worst for full bloom (NSE < 0.50). Likewise, the RMSE values were less than one week for all phenophases in both calibration and validation. The bias values remained close to zero, ex-cept with the harvest model which overestimated the length of the growing season in validation. Also, while the budburst and full bloom models performed equally well with the two varieties, the harvest model provided much better results with Flame Seedless than with Moscatel Rosada. Simulation er-rors, however, did not exceed 12 days in any case, as shown in Fig. 2. Such errors can be deemed acceptable with regard to the 10-day time step chosen to evaluate the hydrological models.
4.2 Hydrological modelling
Figure 2.Observed vs. predicted dates of budburst, full bloom and harvest at the INIA experimental site. The dates are expressed in number of days since 1 June. The minimum, maximum and mean absolute errors (in days) are given for each variety and stage of growth. The upper and lower blue lines indicate delays of±5 days between observed and predicted dates, respectively.
Table 1.Goodness-of-fit (calibration) and predicting performance (validation) of the phenological models. RMSE, Root Mean Square Error; NSE, Nash-Sutcliffe Efficiency; Bias, mean difference between the observed and predicted dates.
Calibration (whole dataset) Leave-one-out cross-validation
Flame Seedless Moscatel Rosada Flame Seedless Moscatel Rosada
Model RMSE NSE Bias RSME NSE Bias RMSE NSE Bias RMSE NSE Bias
BB 2.2 0.94 0.2 1.0 0.98 0.14 2.2 0.94 0.1 1.3 0.97 −0.14 FB 6.2 0.40 0.1 6.0 0.36 −0.29 6.2 0.39 0.2 6.5 0.26 0.29 HV 2.3 0.91 −0.1 6.7 0.79 −1.14 2.4 0.91 −0.2 6.8 0.78 −1.57
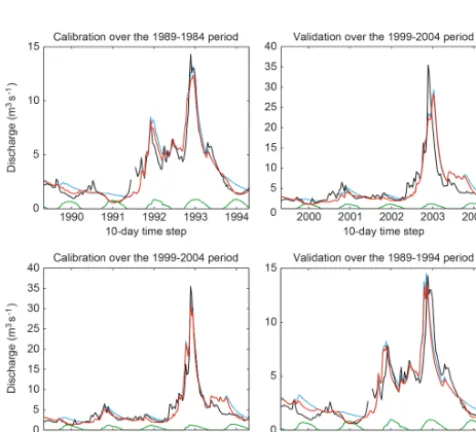
the GR4J/IWU model arose from timing errors in the simu-lation of peak flows rather than from the incorrect simusimu-lation of low flows (except in 1989–1990). In mountainous catch-ments, such errors are likely to be due to inadequacies in the modeling of snowmelt. Further research is underway to bet-ter estimate the dynamics of snow processes using remotely-sensed snow-cover data to determine the parameters of the CEMANEIGE model.
5 Conclusions and prospects
This paper investigated the usefulness of modifying a com-monly used conceptual model to improve low-flow simu-lations in a cultivated, snowmelt-fed catchment of north-central Chile. To this end, a modified version of the CEMANEIGE-GR4J model was designed to incorporate the effects of increasing irrigation water-use (IWU) over time. This approach relied on the use of temperature-based phe-nological models to capture the main dynamics of crop
water needs during the growing season. When tested over two different 5-year calibration and validation periods, the GR4J/IWU model was found to perform better than the GR4J and GR6J models, in particular with respect to the low-flow criterion (KGEi). The GR4J/IWU model appears to be less sensitive to changes in the water-use and climate conditions of the calibration period.
nat-Table 2.Goodness-of-fit (calibration) and predicting performance (validation) of the hydrological models.
Calibration over 1989–1994 Validation over 1999–2004
Model Fobj KGE KGEi Fobj KGE KGEi
GR4J 0.87 0.93 0.81 0.73 0.88 0.58 GR6J 0.87 0.92 0.82 0.79 0.86 0.72 GR4J/IWU 0.96 0.97 0.95 0.79 0.87 0.71
Calibration over 1999–2004 Validation over 1989–1994
Model Fobj KGE KGEi Fobj KGE KGEi
GR4J 0.86 0.95 0.77 0.74 0.85 0.63 GR6J 0.85 0.91 0.79 0.60 0.72 0.48 GR4J/IWU 0.92 0.95 0.89 0.86 0.88 0.84
Figure 3.Simulated influenced streamflow (in red) obtained with the GR4J/IWU model compared to observed streamflow (in black) in calibration and validation. Seasonal irrigation water-use (IWU) and the simulated natural streamflow (Qn,sim) are plotted in green and blue, respectively.
ural climate variability and shifts, which have been shown to influence the hydrological system behavior on the inter-annual (ENSO) and interdecadal (IPO) timescales (Quin-tana and Aceituno, 2012). Further research is also required to quantify the predictive uncertainty associated with model structure, parameters and inputs.
In the future, projected changes in temperature and precip-itation patterns may further amplify human-induced hydro-logical changes. In mountainous areas, warmer temperatures will reduce the fraction of precipitation falling as snow and tend to accelerate snowmelt, thereby leading to earlier peak flows in spring and decreased summer and fall flows. At the same time, higher temperatures in the cultivated valleys will affect the timing of phenological events, which drive the
sea-sonal pattern of crop water needs. Although some beneficial effects of elevated CO2can be expected at the leaf level, crop evapotranspiration could increase at the catchment scale due to complex feedbacks occurring within the canopy and in the air above it. In semi-arid catchments where irrigation water is derived from snowmelt-fed rivers, this could lead to a grow-ing mismatch between irrigation requirements and surface-water availability. This is the subject of an on-going research project.
Acknowledgements. The authors are very grateful to the Centro de Estudios Avanzados en Zonas Áridas (CEAZA) for its essential logistic support during the field missions and to the Dirección Gen-eral de Agua (Chile) for providing the necessary streamflow data.
References
Blöschl, G. and Montanari, A.: Climate change impacts – throwing the dice?, Hydrol. Process., 24, 374–381, 2010.
Chuine, I.: A Unified Model for Budburst of Trees, J. Theor. Biol., 207, 337–347, 2000.
Duan, Q. Y., Gupta, V. K., and Sorooshian, S.: A shuffled complex evolution approach for effective and efficient global minimiza-tion, J. Optim. Theory Appl., 76, 501–521, 1993.
García de Cortázar-Atauri, I., Daux, V., Garnier, E., Yiou, P., Viovy, N., Seguin, B., Boursiquot, J. M., Parker, A. K., van Leeuwen, C., and Chuine, I.: Climate reconstructions from grape harvest dates: Methodology and uncertainties, The Holocene, 20, 599– 608, 2010.
Gupta, H. V., Kling, H., Yilmaz, K. K., and Martinez, G. F.: Decom-position of the mean squared error andNSE performance criteria: Implications for improving hydrological modelling, J. Hydrol., 377, 80–91, 2009.
Hublart, P., Ruelland, D., Dezetter, A., and Jourde, H.: Reducing structural uncertainty in conceptual hydrological modeling in the semi-arid Andes, Hydrol. Earth Syst. Sci. Discuss., 11, 12137– 12186, doi:10.5194/hessd-11-12137-2014, 2014.
the science of hydrology, Water Resour. Res., 42, WR004362, doi:10.1029/2005WR004362, 2006.
Oudin, L., Hervieu, F., Michel, C., Perrin, C., Andreassian, V., An-ctil, F. and Loumagne, C.: Which potential evapotranspiration input for a lumped rainfall-runoff model? Part 2: towards a sim-ple and efficient potential evapotranspiration model for rainfall– runoff modelling, J. Hydrol., 303, 290–306, 2005.
Perrin, C., Michel, C., and Andréassian, V.: Improvement of a parsi-monious model for streamflow simulation, J. Hydrol., 279, 275– 289, 2003.
Pushpalatha, R., Perrin, C., Le Moine, N., and Andréassian, V.: A downward structural sensitivity analysis of hydrological models to improve low-flow simulation, J. Hydrol., 411, 66–76, 2011. Pushpalatha, R., Perrin, C., Le Moine, N., Mathevet, T., and
An-dréassian, V.: A review of efficiency criteria suitable for evaluat-ing low-flow simulations, J. Hydrol., 420–421, 171–182, 2012.
Quintana, J. M. and Aceituno, P.: Changes in the rainfall regime along the extratropical west coast of South America (Chile): 30– 43◦S, Atmósfera, 25, 1–22, 2012.
Ribeiro, L., Kretschmer, N., Nascimento, J., Buxo, A., Roetting, T., Soto, G., Señoret, M., Oyarzún, J., Maturana, H., and Oyarzún, R.: Evaluating piezometric trends using the Mann-Kendall test on the alluvial aquifers of the Elqui river basin, Chile, Hydrol. Sci. J., doi:10.1080/02626667.2014.945936, 2014.
Valéry, A., Andréassian, V., and Perrin, C.: As simple as possible but not simpler: What is useful in a temperature-based snow-accounting routine? Part 2 – Sensitivity analysis of the Ce-maneige snow accounting routine on 380 catchments, J. Hydrol., 517, 1176–1187, 2014.