Eurasian Journal of Business and Economics 2015, 8 (15), 115-140.
DOI: 10.17015/ejbe.2015.015.06
Assessment of Technical Efficiency of Public
Sector Banks in India Using Data
Envelopment Analysis
Aparna BHATIA
*, Megha MAHENDRU
**Abstract
The main aim of the paper is to analyze technical efficiency of Public Sector Banks (PSBs) in India during the period 1990-91 to 2011-12. The paper also examines whether there is statistically significant difference in efficiency of PSBs in the reformatory era (1990-91 to 2000-01) as compared to the post reformatory era (2001-02 to 2011-12). Using CAMEL framework, the paper also investigates the determinants of efficiency of PSBs. The results show that PSBs exhibit higher mean of the efficiency parameters in post reformatory era (2001-02 to 2011-12) than in the reformatory era (1990-91 to 2000-01). PSBs inefficiency is attributed to Pure Technical Inefficiency in reformatory era whereas the same is accredited to scale inefficiency in the post reformatory era. Paired t test shows that there is significant difference in performance of Public Sector Banks in reformatory era and post reformatory in all the Efficiency parameters. The results of Panel Data TOBIT regression suggest that various CAMEL parameters have significant impact on the technical efficiency of PSBs.
Keywords: Technical Efficiency, Public Sector Banks (PSBs), India, Data Envelopment Analysis (DEA), Panel Data Tobit Regression
JEL Code Classification: G2, C24
UDC: 336.771(540)
*Assistant Professor, Department of Commerce, Guru Nanak Dev University, Amritsar, India.
E-mail:[email protected]
**
1.
Introduction
Efficiency measures a firm’s performance relative to a benchmark at a given point of time (Rammohan & Ray, 2004). Efficiency is the best allocation of resources to obtain the highest level of outputs. Efficiency is defined as the choice of alternatives which produce the largest outcome for the given application of resources. Efficiency of banking system is an important issue in developing countries. For banks, efficiency implies improved profitability, greater amount of funds utilized in better ways, service quality for consumers and greater safety in terms of improved capital buffer in absorbing risk (Berger et al., 1993). It is associated with as to how a bank simultaneously minimizes cost and maximizes revenue based on its existing level of production technology. The efficiency of banks is necessary to sustain trust, confidence and soundness in the banking system (Zeitun & Benjelloun, 2013). Also, greater efficiency in the banking system leads to greater financial stability, product innovation and access of households and firms to financial services, which in turn affects economic growth (Egesa, 2010). The efficient performance of banks helps them to survive and better compete with other financial institutions. Efficient banks can achieve higher rate of return relative to cost, and at the same time participate in economic development. On the other hand, inefficient banks have fewer chances to survive in the market (Zeitun & Benjelloun, 2013).
There are two main approaches for efficiency measurement in financial sector i.e. technical efficiency and allocative efficiency. Technical efficiency refers to the ability to avoid waste by producing as much output as input usage allows, or by using as little input as production allows; as against allocative efficiency that refers to the ability to combine inputs and outputs in optimal proportion in the light of prevailing prices (Lovell, 1993). Technical Efficiency is desirable as long as inputs are costly to the firm. Achieving technical efficiency means producing highest output at the least cost. Technical Efficiency further consists of two efficiencies i.e. Pure Technical Efficiency and Scale Efficiency. Decomposing technical efficiency allows gaining insight into the main sources of inefficiencies (Sanchez, 2009). In other words, the nature of technical inefficiencies can be due to the inefficient implementation of the production plan in converting inputs to outputs (pure technical inefficiency) or due to the divergence of the firm from the most productive scale size (scale inefficiency).
share of assets of the Public Sector Banks to 73% and increased that of Private and Foreign sector banks to 20% and 7% respectively (Reserve Bank of India, 2012). It became imperative for the Public Sector Banks to remain efficient in the production process so that they could survive and sustain in the changing environment and remain dominating as before, as compared to their counterparts in private and foreign sector. So, the present paper focuses on assessing the performance of banks in Public sector only.
The paper is organized in various sections. Section II reviews the related studies in the literature. Section III discusses the data sources and model specifications which are employed in the study. Section IV outlines the results of the analysis of Indian Banking Sector using DEA and Panel Data Tobit regression technique. Finally, last section V reports the empirical findings and conclusion of the study.
2.
Literature Review
Many studies have explored the efficiency performance of banks (Bhattacharyya et al., 1997; Saha & Ravisankar 1998; Sathye, 2003; Niazi, 2003; Ataullah et al.,, 2004, Ataullah & Le, 2006; Kumar & Gulati, 2008; Ahmed, 2008; Sufian, 2009; Chauhan & Pal, 2009; Nigmonov, 2010; Kaur & Kaur, 2010; Zeitun & Benjelloun, 2013; Nyawo, 2014; Motlagh & Saleh, 2014). Specifically, technical efficiency too has been evaluated by number of studies (Yue, 1992; Bhattacharyya et al., 1997; Saha & Ravisankar, 1998; Vujcic & Jemric, 2001; Mukharjee et al., 2002; Casu et al., 2003; Halkos et al., 2004; Shanmugam & Das, 2004; Khanam & Nghiem, 2004; Bonin et al., 2005; Sensarma, 2006; Barros et al., 2007; Ketkar & Ketkar, 2008; Isik & Darrat, 2009; Zhao et al., 2010; Staub et al., 2010; Bala and Kumar, 2011; Uddin & Suzuki, 2011; Gulati, 2011; Sharma et al., 2012; Zeitun & Benjelloun, 2013; Nyawo, 2014; Motlagh & Saleh, 2014 etc). With respect to Indian Banking efficiency, most prominent studies include Bhattacharyya et al. (1997), Das (1997), Das (2000), Saha and Ravisankar (2000), Mukherjee et al.(2002), Sathye (2003), Rammohan and Ray (2004), Chakrabarti and Chawla (2005), Kumar and Gulati (2008), Ketkar and Ketkar (2008). These studies mainly focus on the efficiency differences among banks i.e. public, private and foreign banks. Some studies concluded that public sector banks were more efficient banks than private sector banks (Bhattacharyya et al., 1997; Mukherjee et al., 2002; Sathye, 2003; Rammohan & Ray, 2004; Das et al., 2005; Mahesh & Rajeev, 2009) while others showed that private sector banks were efficient (Khatri, 2004; Chakrabarti & Chawla,2005; Chatterjee & Sinha,2006; Mittal & Dhingra,2007), still some others highlighted that foreign banks were most efficient (Das,1997; Srivastava & Jain.,2006, Debasish, 2006; Gupta et al., 2008).
Commerce, State Bank of India, Canara Bank, State Bank of Hyderabad, Bank of Baroda and Dena Bank were found to be consistently efficient banks. Kumar and Verma (2003) observed that during 2001, the overall level of technical inefficiency in Indian public sector bank industry was around 17% and SBI groups outperformed the nationalized banks in terms of use of resources. Tandon (2006) reported that the maximum technical efficiency with respect to interest expense as input was for Punjab National Bank and Oriental Bank of Commerce (OBC) was considered as most efficient in terms of operating expense as input and business as output in 2003 to 2008. Kumar and Gulati (2008) observed that the efficient banks in Indian public sector banking industry were State Bank of Bikaner and Jaipur, State Bank of Mysore, State Bank of Patiala, State Bank of Travancore, Andhra Bank, Corporation Bank, and Punjab and Sind Bank. Bala and Kumar (2011) concluded that PSBs had the mean efficiency score of 0.890 while Technical Efficiency scores among the inefficient banks ranged from 0.553 for Central Bank of India to 0.999 for State Bank of Indore. Kumar (2012) also concluded that technical efficiency of Indian PSBs followed an uptrend, while allocative efficiency followed a path of deceleration.
provided that the factors like market share, profitability, and asset quality had no significant impact on the overall technical efficiency of Indian Public Sector Banking Industry. The efficiency of PSBs was positively influenced by their exposure to off-balance sheet activities. Ketkar and Ketkar (2008) concluded that both priority sector loans as percent of total loans (PSL) and investment as percent of total assets (INV) had the expected negative and statistically significant signs and each bank’s market size index (MSI) had statistically significant negative impact on efficiency. Gupta et al. (2008) reported that Operating profit to total assets had a positive and significant effect on efficiency. Assets size had no significant influence. CAR was not significant in 1999 and was not found to be significant in 2003. Sufian (2009) suggested that technical efficiency was positively and significantly associated with loans intensity. The efficient cost management was prerequisite for the improved efficiency of the Malaysian banking system. Log of GDP was also negatively related to Malaysian banks’ efficiency levels. Bala and Kumar (2011) showed that PRIORITY and OFFBALANCE were the most dominant and statistically significant variables that influence the technical efficiency of public sector banks. Overall the results showed that PSBs with lower level of priority sector advances were more efficient than those having higher level. Gulati (2011) reported that bank’s size (SIZE), market share in deposits (MS), staff productivity (SP) and Capital Adequacy (CRAR were statistically insignificant in all the regression equations. Advances to Priority Sector (PRIORITY) ratiowere observed to be statistically significant in only one instance. The most influential determinants of overall technical efficiency were ROA and exposures to off balance sheet Activities (OFFBALANCE) which was statistically significant coefficient. The profitability had a strong link with the overall technical efficiency of banks. Sharma et al. (2012) demonstrated that Bank diversification practices were negatively and significantly affecting the bank’s efficiency. Bank age affected the bank’s performance positively and significantly. New banks were gaining edge over the older ones. Loan intensity, management quality, market share and bank size was insignificant in nature. Profitability was positive and significant in nature and therefore highly profitable banks were more efficient in their operations.
some others have focused on macroeconomic variables (Hauner & Peiris, 2005; Ataullah & Le, 2006; Seelanatha, 2007; Pasiouras & Kosimidou, 2007; Asimakopoulos et al., 2008; Sufian, 2009). There is a need to put these factors into a systematic framework. This study analyses the efficiency of banks over the period 1990-91 to 2011-12 by dividing it into two sub periods as 1990-91 to 2000-01, representing the reformatory era and 2000-01 to 2011-12 representing the post reformatory era. The study attempts to use an assessment criteria developed in the U.S. to classify bank's overall condition popularly known by the acronym CAMEL to choose different factors affecting bank efficiency. The supervisory regulators of CAMEL include the Federal Reserve, the Office of the Comptroller of the Currency, the National Credit Union Administration, and the Federal Deposit Insurance Corporation.
3.
Data Sources and Model Specifications
3.1.
Data Envelopment Analysis (DEA)
change in the amounts of the outputs. The VRS includes both increasing and decreasing returns to scale. VRS allows decomposing of the technical inefficiencies into scale inefficiencies and pure technical inefficiencies. This paper uses Variable Return to Scale that decomposes Overall technical efficiency (OTE) into product of two components Pure Technical Efficiency (PTE) and Scale Efficiency (SE). Technical efficiency is measured either in terms of the optimal combination of inputs to achieve a given level of output (an input-orientation) or the optimal output that can be produced from given a set of inputs (an output-orientation). The output orientation model is more appropriate because banks mainly focus to increase their outputs rather than to reduce their inputs. Efficiency scores are measured by using DEAP Software. The following is the Mathematical programming equations used to calculate output oriented Technical Efficiency which is as follows:
vi, ur ≥ 0 ; r = 1, 2,…. s; i = 1, 2, …m
where
n = DMU observation j=nth DMU
s = output observation m= input observation r = sthoutput
i= mth input
yro= rth output that maximize revenue for DMU0
xio= ith input that minimize cost for DMU0
yro= rth output for DMU0
xio= ith input for DMU0
yrj= sth output for nth DMU
xij =mth input for nth DMU
3.2.
Paired T test
3.3.
Panel Data Tobit Regression Analysis
The Panel Data Tobit model is proposed by James Tobin (1958) to describe the relationship between a censored dependent variable and independent variables. The Simple application of OLS estimation procedure in censored dependent variable may produce biased estimates if there is significant position of the observation equal to 1(Saxonhouse, 1976; Resende, 2000; Kumar & Gulati, 2008; Gulati, 2011). The Panel Data Tobit model is applied due to the censored nature of the dependent variable (Technical efficiency are in range of 0 to 1) and extreme values of the independent variables which deviates from a normal distribution and highly skewed in nature (Niazi, 2003; Khanamand Nghiem, 2004; Burkiand Niazi, 2006; Gupta et al., 2008; Ahmed, 2008; Gulati, 2011; Sharma et al., 2012; Raphael, 2013). The censored Panel Data Tobitmodel can be defined as follows for ith bank:
Where xi is a vector of explanatory variables and β is the set of parameters to be
estimated. εi denotes the error term. The yi is a latent variable and yiis the efficiency
scores obtained for Ith bank from DEA model. The estimation of Panel Data Tobit results is performed using Statistical Software “Eveiws 5”.
3.4.
Specification of Bank inputs outputs and Data
deposits and funds into loans and financial investments. Under DEA Approach, the selection of inputs and outputs is the arbitrary process (Ariff & Can, 2008; Berger & Humphrey, 1997). However, the intermediate approach enlightens that deposits and funds along with other inputs assists to produce the income and loans and advances. Following the intermediation approach, this paper uses four inputs and three outputs. Deposits, borrowings, interest expenses and operating expenses are the inputs used in this paper. On the other hand, investments, advances, and total income (Chauhan & Pal, 2009; Joshi & Bhalero, 2011; Chhikara & Bhatia, 2012; Sharma et al, 2012) are considered as outputs. These inputs and outputs are selected as they represent bank’s all expenses and fund that are generated to produce the revenues and major bank’s business. The degree of correlation between inputs and outputs is an important issue that has great impact on the robustness of the DEA model (Yang, 2009). The correlation between inputs and outputs is calculated for identifying whether increasing amounts of inputs lead to greater outputs. Only positive and statistically significant inter-correlations between inputs and outputs meet the requirements of DEA. On the other hand, if an input variable has very low correlation with all the output variables, it may indicate that this variable does not fit the model. Thus, a correlation analysis is necessary to establish appropriate inputs and outputs. Table 1 provides the Pearson correlation matrix.
Table 1. Pearson correlation matrix
Outputs Inputs Deposits Borrowings Interest expenses
Operating Expenses Investments Pearson Correlation
Sig. (2-tailed) .809* (.000) .660* (.000) .823* (.000) .809* (.000) Loans and Advances Pearson Correlation Sig. (2-tailed) .790* (.000) .684* (.000) .791* (.000) .746* (.000) Total Income Pearson Correlation
Sig. (2-tailed) .974* (.000) .855* (.000) .993* (.000) .981* (.000) ** Correlation is significant at the 0.01 level.
norms came up with its 3 pillared structure in 1992. The reforms with respect to electronic banking modernized the traditional banking followed in India with its faster payment and settlement system, clearing mechanism, fund transfer, online bill payments, telephone banking. Anti-money Laundering (AML) and Know Your Customer (KYC) norms filtered the unethical and illegal issues from the banking business. However, the period from 2001-02 to 2011-12 focused on the implementation of these reforms. The study is based on secondary data. The data has been collected from the banks’ annual reports and website of Reserve Bank of India (RBI). Reports on Trend and Progress in Banking from 1990-91 to 2011-12 have been also used.
3.5.
Explanatory Variables and Hypotheses development
The paper adopts two-stage Data Envelopment analysis. The first stage involves estimation of efficiency scores namely Technical Efficiency (TE), Pure Technical Efficiency (PTE) and Scale efficiency (SE). In the second stage of analysis, Panel Data Tobit regression model is used with efficiency scores obtained in the first stage as dependent variables by regressing with a series of explanatory variables of bank efficiency. Several specific factors may influence a particular banks efficiency level. The independent variables used in the paper to explain the Public Sector Banks efficiency are representative of CAMEL Framework. CAMEL framework represents the performance of banks from each of the important parameters like Capital Adequacy, Assets Quality, Management Efficiency, Earning Quality and Liquidity. CAMEL framework is used for the reason that it includes both financial performance indicators as well as managerial aspects of bank performance. These parameters are explained as follows:
3.5.1. Capital Adequacy
Capital is the amount of own funds available to support the bank's business and act as a buffer in case of adverse situation (Athanasoglou et al. 2005). Increases in capitalization reduce the inefficiency and then improve performance by reducing the moral hazards (Naceur & Goaied, 2001). Larger bank capital reduces the chance of distress (Diamond, 2000). A lower capital adequacy suggests relatively risky position. In the present study Capital Adequacy is described in terms of Capital Adequacy ratio and Debt equity Ratio.
Capital is expected to affect profitability positively since it expands production and increase the efficiency (Berger, 1995; Goddard et al., 2004; Seelanatha, 2007). Hence, the following hypothesized has been tested:
H1- There is a significant positive relationship between Capital adequacy ratio and
Efficiency.
Debt equity Ratio: Banks have a lower equity base and usually use borrowings to
fund their assets. Borrowings being the cheaper source to help banks to expand their capacity to earn more money by making additional loans. But as per traditional theory of capital structure, debt is cheaper than equity capital only within reasonable or acceptable limit. Beyond that acceptable limit the lending becomes riskier (Pandey, 2013: 346). Kester (1986) and Rajan and Zingalas (1995) found a negative relationship between profitability and debt/asset ratios. The following hypothesis is formulated and tested:
H2- There is a significant negative relationship between Debt to equity and
Efficiency.
3.5.2. Asset Quality
The bank assets include current assets, fixed assets, loan and advances to customers and banks and other investments. Loan and advances is the major asset of the banks that generates a sizeable share of bank’s income. The loan portfolio quality has direct bearing on efficiency of the banks. Hence, the asset quality of a bank is measured through:
Non Performing assets (NPA) to Net advances: Thenon performing loans tell how
well the bank is managing its loan portfolio. The lower the ratio of Non Performing assets (NPAs) to Net advances the better the bank is performing (Seelanatha, 2007; Sangmi & Nazir, 2010). The highest risk of the bank is the losses derived from loans (Dang, 2011). Thus, it leads to the following hypothesis:
H3- There is a significant negative relationship between Non Performing assets
(NPA) to net advances and Efficiency.
Total investments to Total assets: This ratio is used as a tool to measure the percentage of total assets locked up in investments which indicates the extent of deployment of assets in investment other than advances. This ratio indicates the extent of deployment of assets in investment other than advances. On one side, investments of the banks in government securities, bullion and other investments help banks to earn income with low risk. On the other side, a higher level of investment in these channels may also indicate poor credit off-take or conservative lending resulting in lower income. This narrow risk approach results into lower efficiency of the banks. Hence the following is hypothesized:
H4- There is a significant negative relationship between Total investments to Total
3.5.3. Management Efficiency
Management Efficiency is the capability of the management to deploy its resources, aggressively to maximize the income, utilize the facilities in the bank productively and reduce costs etc. (Purohit & Mazumdar, 2003). Managing the operating expenses is also an important dimension of management efficiency of banks. The same is analyzed by the following ratios:
Total expenses to Total income: It provides information on the efficiency of the management regarding expenses relative to the revenue it generates. A high ratio implies a less efficient management (Pasiouras & Kosimidou, 2007). This variable is expected to have negative impact on the efficiency of the banks. Hence, the following hypothesis is formulated:
H5- There is a significant negative relationship between Total expenses to Total
income and Efficiency.
Operating expenses to Total expenses: This ratio is expected to be negatively associated with profitability. Poor management of expenses is one of the main contributor to poor profitability performance. The decrease in expenses will improve the efficiency. So, the following is hypothesis:
H6- There is a significant negative relationship between Operating expenses to Total
expenses and Efficiency.
3.5.4. Earning Quality
Higher the earnings and profitability of a bank, higher is its ability to support present and future operations. More specifically, this determines the capacity to absorb losses by building an adequate capital base, finance its expansion and pay adequate dividends to its shareholders. Earnings quality refers to the profitability and growth potential of earnings, the same is measured as:
Return on Assets (ROA): Profit to average assets indicates the efficiency of banks in utilizing their assets in generating profits. ROA gives an idea as to how efficiently management uses company assets to generate profits. A higher ratio indicates better income generating capacity of the assets and better efficiency of management. Ketkar and Ketkar (2008) proposed that there is positive relation with return on assets and efficiency scores. Hence the following hypothesis is checked:
H7- There is a significant positive relationship between Return on Assets and
Efficiency.
better earnings given the total assets. This leads to the formulation of following hypothesis:
H8- There is a significant positive relationship between Spread to total assets and
Efficiency.
3.5.5. Liquidity Management
Liquidity refers to the ability of the bank to fulfil its obligations timely. The effect of liquidity on efficiency is somewhat ambiguous. As Dang (2011) reported that level of liquidity is positively related with bank profitability and efficiency while Elsiefy (2013) found that liquidity had a negative influence on the profitability of Islamic Banks . Said and Tumin (2011) found no relationship of liquidity levels with the performance of banks in case of both China and Malaysia. In the present study the liquidity of banks has been measured through the following ratios:
Government Securities (G-Secs) to total Investments: The risk taking ability and appetite of a bank is also reflected in the proportion of its investments made in G-Secs. Government Securities are the most liquid and offer lowest returns, being almost risk free. A higher proportion of bank’s investment made in G-Secs indicates that banks' investments have lower risk which provides lower return. This leads to the following hypothesis:
H9- There is a significant negative relationship between Government Securities to
total investments and Efficiency.
Liquid Assets to total Assets: Banks with a larger volume of liquid assets are perceived to be safe, since these assets would allow banks to meet unexpected withdrawals. Liquid Assets include cash in hand balance with the RBI, balance with other banks (both in India and abroad), and money at call and short notice. This ratio indicates the overall liquidity position of the bank. Liquid assets are associated with lower return and a negative relationship is expected between the liquidity and profitability (Molyeneux, 1992). Idris et al. (2011) also suggested that lesser the funds tied up in liquid assets the higher the profitability which in turn shows bank to be efficient. Seelanatha (2007) also suggested a negative relation between liquidity and efficiency. Thus, the following hypothesis is framed:
H10- There is a significant negative relationship between Liquid Assets to total
assets and Efficiency.
3.5.6. Size
Athanasoglouet al., 2008; Sufian, 2009). Akharinet al. (1997); Bourke (1989); Eichengreen & Gibson (2001); Bikker & Hu (2002) and Goddard et al. (2004) suggested that the effect of size may be positive up to certain limit but beyond that point the effect of size could be negative. Hence, it can be hypothesized that:
H11a- There is a significant positive relationship between Size and Efficiency.
H11b- There is a significant negative relationship between Size and Efficiency.
Table 2 shows a synoptic view of these variables and their expected relationship with efficiency.
Table 2. Description and Expected sign of the explanatory variables
Framework Explanatory Variable Symbol Description Expected
Sign
Capital Adequacy
Capital Adequacy ratio CAR Tier I + Tier II to Risk
Weighted Assets +
Debt equity Ratio DE Debt to total equity -
Assets Quality
NPA to net advances NPA Net NPA to Net Advances -
Total investments to total
assets TITA
Total Investments to Total
Assets -
Management Efficiency
Total expenses to total
income TETI
Total expenses to total
income -
Operating expenses to total
expenses OETE
Operating expenses to total
expenses -
Earning Quality
Return on Assets ROA Profit after tax to total
assets +
Spread to total assets STA Spread to total assets +
Liquidity
Government Securities to
total Investments GSTI
Government Securities to total Investments - Liquid Assets to total Assets LATA Cash and Cash equivalents
to total assets -
Bank Size Size LNTA Natural log of total Assets
of the banks +/-
4.
Empirical findings and discussion
4.1.
Efficiency of public sector banks in India
Table 3. Efficiency of Public Sector Banks
Efficiency of Public Sector Banks Reformatory era from 1990-91 to 2000-01
Year
Technical Efficiency (CRS DEA)
Pure Technical
Efficiency (VRS DEA) Scale Efficiency
Ratio Growth
Rate Ratio
Growth
Rate Ratio
Growth Rate
1990-91 0.995 0.998 0.997
1991-92 0.970 -2.51 0.986 -1.20 0.983 -1.40
1992-93 0.983 1.34 0.988 0.20 0.995 1.22
1993-94 0.979 -0.41 0.987 -0.10 0.992 -0.30
1994-95 0.992 1.33 0.994 0.71 0.998 0.60
1995-96 0.980 -1.21 0.986 -0.80 0.994 -0.40
1996-97 0.982 0.20 0.987 0.10 0.995 0.10
1997-98 0.984 0.20 0.991 0.41 0.993 -0.20
1998-99 0.973 -1.12 0.984 -0.71 0.988 -0.50
1999-2000 0.957 -1.64 0.983 -0.10 0.973 -1.52
2000-01 0.949 -0.84 0.982 -0.10 0.966 -0.72
Mean 0.977 0.988 0.989
S.D. 0.014 0.005 0.010
C.V 1.419 0.487 1.055
Efficiency of Public Sector Banks Post Reformatory era from 2001-02 to 2011-12
2001-02 0.957 0.982 0.974
2002-03 0.980 2.40 0.992 1.02 0.988 1.44
2003-04 0.992 1.22 0.998 0.60 0.994 0.61
2004-05 0.992 0.00 0.994 -0.40 0.998 0.40
2005-06 0.995 0.30 0.997 0.30 0.998 0.00
2006-07 0.993 -0.20 0.999 0.20 0.993 -0.50
2007-08 0.997 0.40 0.999 0.00 0.998 0.50
2008-09 0.996 -0.10 0.998 -0.10 0.998 0.00
2009-10 0.990 -0.60 0.995 -0.30 0.995 -0.30
2010-11 0.994 0.40 0.997 0.20 0.997 0.20
2011-12 0.959 -3.52 0.978 -1.91 0.980 -1.71
Mean 0.986 0.994 0.992
S.D. 0.015 0.007 0.008
C.V 1.473 0.714 0.823
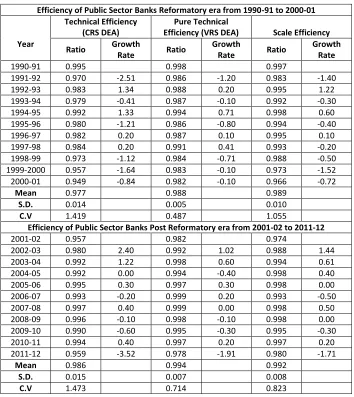
of introduction of reforms but afterwards followed an inconsistent pattern and in fact reached to the lowest efficiency in 2000-01.
As seen in Table 3 during post reformatory era, the efficiency of Public sector banks was 0.957 in 2001-02 which increased to 0.959 in 2011-12. PSBs exhibited less variability in performance after 2001-02 as Technical efficiency (CRS) was nearly 1 in almost all the years. The growth rate also exhibited the positive trend for majority years. Same pattern was observed in the Pure Technical Efficiency (VRS) and Scale efficiency. Estimates of Technical Efficiency (VRS) vary from low of 0.978 to high of 0.999 and those of Scale Efficiency vary from low of 0.974 to high of 0.998 in the post reformatory era.
The overall mean efficiency estimates in reformatory era are 0.977, 0.988 and 0.989 for TE, PTE and SE efficiency respectively the results indicate that the level of inefficiency is 0.023, 0.012 and 0.011 for TE, PTE and SE respectively. These scores indicate that the banks can still reduce input resources and produce the same output levels. PSBs in India have improved their mean technical efficiency (CRS) to 0.986 in Post reformatory era which comprises of increased pure technical efficiency of 0.994 and increased scale efficiency of 0.992. The results indicate the level of inefficiency is 0.014, 0.006, and 0.008 TE, PTE and SE in post reformatory era. PSBs exhibit higher mean of the efficiency parameters and lower inefficiency in post reformatory era than reformatory era. This shows that PSBs are improving their efficiency. PSBs inefficiency is attributed to Pure Technical Inefficiency in reformatory era whereas the same is accredited to scale inefficiency in the post reformatory era.
Certain differences have been found during the reformatory era and post reformatory era in the efficiency of Public sector banks. In order to see whether the differences between them are significant or not following hypotheses have been taken:
HCRS0: There is no difference in performance between reformatory era and post
reformatory era in Technical Efficiency (CRS DEA).
HVRS0: There is no difference in performance between reformatory era and post
reformatory in Pure Technical Efficiency (VRS DEA).
HSE0: There is no difference in performance between reformatory era and post
reformatory in Scale Efficiency.
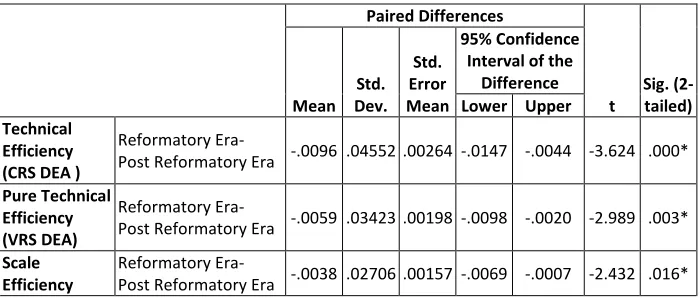
To test these hypotheses paired t –test has been applied. Table 4 provides the results of Paired sample t test.
The results in Table 4 show that there is strong evidence that t value = -3.624 is significant for Technical Efficiency (CRS DEA) at 1% level (0.000) of significance. Hence, HCRS0is rejected. The result also shows that there is strong evidence that t
t value = -2.432 is significant at 1% level (0.016) of significance for Scale efficiency. Hence, HSE0is also rejected. There is significant difference in performance in
reformatory era and post reformatory in all the Efficiency parameters as shown by t test.
Table 4. Paired Samples Test
Paired Differences
t
Sig. (2-tailed) Mean
Std. Dev.
Std. Error Mean
95% Confidence Interval of the
Difference Lower Upper Technical
Efficiency (CRS DEA )
Reformatory Era-
Post Reformatory Era -.0096 .04552 .00264 -.0147 -.0044 -3.624 .000*
Pure Technical Efficiency (VRS DEA)
Reformatory Era-
Post Reformatory Era -.0059 .03423 .00198 -.0098 -.0020 -2.989 .003*
Scale Efficiency
Reformatory Era-
Post Reformatory Era -.0038 .02706 .00157 -.0069 -.0007 -2.432 .016* * depicts significant at 1% level of significance
The lower efficiency of PSBs in the reformatory era seems to be due to the inception phase of the reforms for which PSBs were perhaps unprepared. The series of banking reform measures including entry deregulation, branch de-licensing, dismantling of administrated interest rate structure, a reduction in CRR and SLR and adoption of prudential norms etc came as astonishment to PSBs. Also, Public Sector Banks were slow in technological up gradation and suffered from management inefficiencies. Moreover, the liberal entry of private and foreign banks reduced the share of inputs of PSBs. Furthermore, PSBs were compulsorily bound to lend the proportion of funds to priority sector which caused decline in their outputs as well. They were mandatorily required to open branches in rural and semi-urban areas which provided limited opportunities to generate earning assets that resulted in creation of lesser outputs with the same inputs and hence resulted in deterioration in their efficiency.
sector banks were significantly better than private banks in respect of technical efficiency. Our results are similar to the findings of Ataullahet al., (2004) and Ataullah and Le (2006) who concluded that public sector banks were relatively more efficient in generating loans and advances. Kumar and Gualti (2008) also supports through his study that public sector banks were on average more efficient and our findings also commensurate with Kumbhakarand Sarkar (2003) who concluded that after 1995-96 PSBs exhibited more improvement in efficiency. However, our results are contradictory to Ketkar and Ketkar (2008), Wanniarachchigeand Suzuki (2011) and Chakrabarti and Chawla (2005) who recommended that Public sector banks are behind the new private and foreign banks. While all these studies compared the efficiency performance of Public sector Banks with Private sector and Foreign Sector Banks which do not confirm the public sector banks performance in reality.
4.2.
Determinants of Banking Efficiency
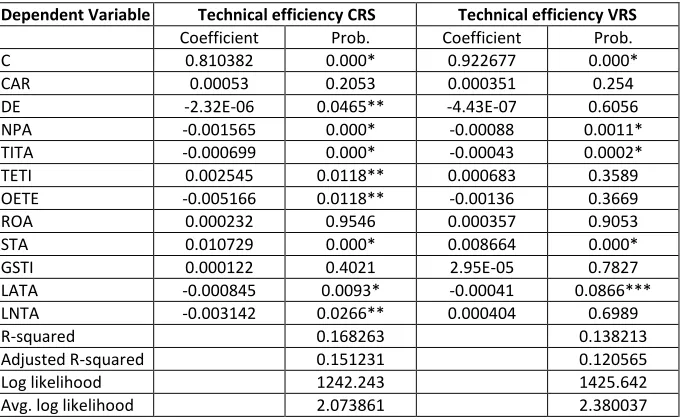
Furthermore, to test the statistical association of the efficiency estimates with variables based on CAMEL framework, and to determine their influence on the efficiency scores, second- stage of DEA method as suggested by Coelli, Prasada, O'Donnell, and Battese (2005) is used. After solving for DEA in the first-stage, the efficiency scores are then regressed by using Panel Data Tobit regression. In Panel Data Tobit regression all efficiency scores i.e. Technical efficiency (CRS) and Technical efficiency (VRS) are used as dependent variables. The results are shown in Table 5.
Table 5. Results of PANEL DATA TOBIT Regression
Dependent Variable Technical efficiency CRS Technical efficiency VRS
Coefficient Prob. Coefficient Prob.
C 0.810382 0.000* 0.922677 0.000*
CAR 0.00053 0.2053 0.000351 0.254
DE -2.32E-06 0.0465** -4.43E-07 0.6056
NPA -0.001565 0.000* -0.00088 0.0011*
TITA -0.000699 0.000* -0.00043 0.0002*
TETI 0.002545 0.0118** 0.000683 0.3589
OETE -0.005166 0.0118** -0.00136 0.3669
ROA 0.000232 0.9546 0.000357 0.9053
STA 0.010729 0.000* 0.008664 0.000*
GSTI 0.000122 0.4021 2.95E-05 0.7827
LATA -0.000845 0.0093* -0.00041 0.0866***
LNTA -0.003142 0.0266** 0.000404 0.6989
R-squared 0.168263 0.138213
Adjusted R-squared 0.151231 0.120565
Log likelihood 1242.243 1425.642
Avg. log likelihood 2.073861 2.380037
The results of Panel Data Tobit regression reveal that Debt to equity ratio (DE) has negative impact on the technical efficiency CRS of the banks at 5% level of significance. Hence, H2 is accepted. As expected, Non-performing Assets to Net
Advances (NPA) and Total Investments to Total Assets (TITA) has negative impact on all the technical efficiency parameters which is statistically significant at 1% level of significance. Hence, H3 and H4 are accepted. Operating expenses to total
expenses (OETE) has negative impact on both the technical efficiency parameters but statistically significant at 5% level of significance for the technical efficiency CRS. Hence, H6 is accepted. Spread to total assets (STA) has positive and significant
impact on the technical efficiency CRS and VRS at 1% level of significance. Hence, H8 is accepted. As expected, Liquid assets to total assets (LATA) has negative impact
on the Technical efficiency CRS statistically significant at 1% level and at 5% level of significance for Technical efficiency VRS. Hence, H10 is accepted. Size (LNTA) has
negative and significant impact on Technical efficiency CRS statistically significant at 5% level. Hence, H11b is accepted. Total expense to Total Income (TETI) is expected
to have negative impact but it turned out be reversed. Hence, H5is rejected. It is
due to the reason that more highly qualified and professional management require higher remuneration and as a result TETI has highly significant and positive impact on the efficiency. Molyneux et al. (1992) also observed a positive relationship of cost to income suggesting that high profits earned by firms may be appropriated in the form of higher payroll expenditure paid to more productive human capital.
However, Capital adequacy ratio (CAR), Government Securities to total investments (GSTI) and Return on Assets (ROA) have positive impact on the technical efficiency of banks but it is statistically insignificant.
5.
Conclusion and Summary
quality, functional quality and guarantee quality assurance to the customers. Thus, it is recommended that PSBs need to use their inputs to the fullest extent to produce the quality outputs to become fully efficient.
For future research scope, the work can further be extended by taking public, private and foreign sector banks together. Various industry specific and macro- economic indicators along with bank specific variables can be taken for checking its impact on efficiency.
References
Ahmed, T. (2008) Efficiency Analysis of Commercial Banks in Pakistan, Thesis submitted to Department of Development Economics, University of Agriculture, Faisalabad, Pakistan. Ariff, M., & Can, L. (2008) Cost and profit efficiency of Chinese banks: A non-parametric analysis, China Economic Review, 19(2): 260–273.
http://dx.doi.org/10.1016/j.chieco.2007.04.001
Asimakopoulos, I. G., Brissimis, S. N. and Delis, M. (2008) The efficiency of the Greek Banking System and its Determinants, Economic Bulletin, 30(5): 7-27.
Ataullah, A. and Hang, L. (2006) Economic reforms and bank efficiency in developing countries: the case of the Indian banking industry, Applied Financial Economics, 16 (9): 653-663. http://dx.doi.org/10.1080/09603100500407440
Ataullah, A., Cockerill, T, and Hang, L (2007) Financial Liberalization and Bank Efficiency: A comparative analysis of India and Pakistan, Applied Economics, 36 (17): 1915-1924. http://dx.doi.org/10.1080/000368404200068638
Athanasoglou, P. P., S. N. Brissimis and M. D. Delis, (2005) Bank-Specific, Industry- Specific and Macroeconomic Determinants of Bank Profitability. Available at http://mpra.ub.uni-muenchen.de/32026/ (accessed on 20th June 2012).
Athanasoglou, P. P., S. N. Brissimis and M. D. Delis, (2008) Bank-Specific, Industry- Specific and Macroeconomic Determinants of Bank Profitability, Journal of International Financial
Markets, Institutions and Money, 18(2): 121-136.
http://dx.doi.org/10.1016/j.intfin.2006.07.001
Bala, N. and Kumar, S (2011) How efficient are the Public sector Banks in India? : An Empirical Investigation. Sri Krishna International Research & Educational Consortium, 1(3): 39-62.
Barros, C.P., and Mascarenhas, M.J., (2005) Technical and allocative efficiency in a chain of small hotels, International Journal of Hospitality Management, 24(3): 415–436. http://dx.doi.org/10.1016/j.ijhm.2004.08.007
Berger, A. N and Humphrey, D (1997) Efficiency of Financial Institutions: International survey and Directions for Future Research, European Journal of Operational Research, 98(2): 175-212. http://dx.doi.org/10.1016/S0377-2217(96)00342-6
Berger, A.N., (1995) The relationship between capital and earnings in Banking, Journal of Money Credit Bank, 27: 432–456. http://dx.doi.org/10.2307/2077877
Bhattacharyya, A, Lovell, C, A, and Sahay, P, (1992) The Impact of Liberalization on the productive efficiency of Indian Banks, European Journal of Operational Research, 98: 332-345.http://dx.doi.org/10.1016/S0377-2217(96)00351-7
Bikker, J.A. and Hu, H. (2002) Cyclical Patterns in Profits, Provisioning and Lending of Banks and Procyclicality of the New Basel Capital Requirements, BNL Quarterly Review, 221:143-175.
Bonin, J.P., Hasan, I., and Wachtel, P., (2005) Bank performance, efficiency and ownership in Transition Countries, Journal of Banking & Finance, 29(1): 31-53. http://dx.doi.org/10.1016/j.jbankfin.2004.06.015
Bourke, P., (1989) Concentration and other Determinants of Bank Profitability in Europe, Journal of Banking and Finance, 13(1): 65-80. http://dx.doi.org/10.1016/0378-4266(89)90020-4
Boyd, J. and Runkle, D. (1993) Size and Performance of Banking Firms: Testing the Predictions theory, Journal of Monetary Economics, 31(1): 47-67. http://dx.doi.org/10.1016/0304-3932(93)90016-9
Burki, A. and Niazi, G.S. K. (2006) Impact of Financial Reforms on Efficiency of State-owned, Private and Foreign Banks in Pakistan, Center for Management and Economic research Working Paper, 6-49
Casu, B., and Molyneux, P., (2003) A comparative study of efficiency in European banking, Applied Economics, 35(17): 1865-1876. http://dx.doi.org/10.1080/0003684032000158109 Chakrabarti, R and Chawla, G, (2005) Bank Efficiency in India since the Reforms an Assessment, Money and Finance, 31-48.
Chansarn, S. (2008) The relative efficiency of Commercial Banks in Thailand: DEA Approach, International Research Journal of Finance and Economics, 18: 53-68.
Charnes, A., Cooper, W.W., and Rhodes, E., (1978) Measuring the Efficiency of Decision Making Units, European Journal of Operational Research, 2(4): 429-444. http://dx.doi.org/10.1016/0377-2217(78)90138-8
Chatterjee, B., and Sinha, R.P., (2006) Cost efficiency and commercial bank lending: some empirical results, The Indian Economic Journal, 54(1): 145-165.
Chauhan, P. and Pal, V. (2009), relative Efficiency of Indian Commercial Banks, The Indian Journal of Commerce, Vol., 62 (4):1-17
Chhikara, K and Bhatia, D (2012), Measurement of Efficiency of Foreign Banks in India through Data Envelopment Analysis (DEA), International Journal of Management Sciences, 1(3), 40-50
Coelli, T, Rao, D, and Battese, G (1998) An Introduction to Efficiency and Productivity Analysis, USA: Kluwer Academic Publishers. http://dx.doi.org/10.1007/978-1-4615-5493-6 Dang, U. (2011) The CAMEL Rating System in Banking Supervision: a Case Study of Arcada University of Applied Sciences, International Business.
Das, A. (1997) Measurement of productive efficiency and its decomposition in Indian banking firms, Asian Economic Review, 39(3): 422-439.
Das, A., (1997) Technical, Allocative and Scale Efficiency of Public Sector Banks in India, Reserve Bank of India Occasional Papers, 18: 279-301.
Das, A., Nag, A. and Ray, S.C. (2005) Liberalization, Ownership and Efficiency in Indian Banking A Nonparametric Analysis, Economic and Political Weekly, 1190-1197.
Dash and Charles (2009) A Study of Technical Efficiency of Banks in India. Available at http://papers.ssrn.com/sol3/papers.cfm?abstract_id=1417376 (accessed on 19th may, 2012). Debasish, S. S., (2006) Efficiency performance in Indian banking-use of data envelopment
analysis, Global Business Review, 7(2): 325-333.
http://dx.doi.org/10.1177/097215090600700209
Diamond, D. W., and R. G. Rajan, (2000) A theory of bank capital, Journal of Finance, 55: 2431-2465. http://dx.doi.org/10.1111/0022-1082.00296
Egesa, K. (2010) Financial Sector Liberalization and Productivity Change in Ugandas Commercial Banking Sector. The African Economic Research Consortium, Kenya
Eichengreen, B. and H.D. Gibson (2001) Greek banking at the dawn of the new millennium. CERP Discussion Paper 2791, London.
Elsiefy E. (2013) Determinants of profitability of commercial banks in Qatar: Comparative overview between domestic conventional and Islamic banks during the period 2006-2011 , International Journal of Economics and Management Sciences, 2(11): 108—142.
Farrell, M.J. (1957) The Measurement of Productivity and Efficiency, Journal of the Royal Statistical Society (Series A- General), 120 (2): 253-81.
Favero, C. A. and Papi, L. (1995) Technical Efficiency and Scale Efficiency in the Italian Banking Sector: A Non-parametric Approach, Applied Economics, 27(4): 385-96. http://dx.doi.org/10.1080/00036849500000123
Goddard, J., Molyneux, P. & J.O.S. Wilson (2004) Dynamics of Growth and Profitability in Banking, Journal of Money, Credit and Banking, 36(6): 1069-1090. http://dx.doi.org/10.1353/mcb.2005.0015
Gulati, R (2011) Estimation of technical, pure technical and scale efficiencies of Indian banks: An analysis from cross-sectional perspective, in The 13th Annual Conference on Money and Finance in the Indian Economy, Indira Gandhi Institute of Development Research, Mumbai. Gupta, O. K., Doshit, Y., and Chinubhai, A. (2008) Dynamics of Productive Efficiency of Indian Banks, International Journal of Operations Research, 5(2): 78-90
Halkos, G.E., and Salamouris, D.S., (2004) Efficiency measurement of the Greek commercial banks with the use of financial ratios: a data envelopment analysis approach, Management Accounting Research, 15(2): 201–224. http://dx.doi.org/10.1016/j.mar.2004.02.001
Hauner, D., and Peiris, S.J., (2005) Bank efficiency and competition in low income countries: the case of Uganda, IMF Working Paper No. WP/05/240, Available at: www.imf.org/external/pubs/ft/wp/2005/wp05240.pdf (accessed on 15th June, 2012). Idris, A. R., Asari, F. F., Taufik, N.A. A., Salim, N.J., Mustaffa, R. AndJusoff, K. (2011) Determinants of Islamic Banking Institutions Profitability in Malaysia. World Applied Sciences Journal, 12 (Special Issue on Bolstering Economic Sustainability)
Karimzadeh, M (2012) Efficiency Analysis by using the Data Envelopment Analysis Model: Evidence from Indian Banks, International Journal of Latest trends in Finance& Economics Sciences, 2(3): 228-237.
Kaur, P., and Kaur, G. (2010) Impact of Mergers on the Cost Efficiency of Indian Commercial Banks, Eurasian Journal of Business and Economics, 3(5): 27-50
Kester, W.C. (1986) Capital and ownership structure: a comparison of United States and Japanese manufacturing corporations, Financial Management, 15: 5‐16. http://dx.doi.org/10.2307/3665273
Ketkar, K.W. and Ketkar, S. L. (2008) Performance and Profitability of Indian Banks in the Post Liberalization Period. Paper presented at The 2008 World Congress on National Accounts and Economic Performance Measures for Nations, Washington DC
Khanam, D. and Nghiem, H. S. (2004) Efficiency of Banks in Bangladesh: A non-parametric
Approach, Available at
http://www.researchgate.net/publication/43501324_The_efficiency_of_commercial_banks_ in_Bangladesh__a_non-parametric_analysis/file/79e414ffcdf37e65c9.pdf (accessed on 3rd June 2012).
Khatri, D., (2004) Performance of Indian banks: stochastic frontier approach, Available at: http://ssrn.com/abstract=639801 (accessed on 30th June 2012).
Kumar S. and Gulati, R. (2008) An Examination of Technical, Pure Technical, and Scale Efficiencies in Indian Public Sector Banks using Data Envelopment Analysis, Eurasian Journal of Business and Economics, 1 (2): 33-69.
Kumar, S, (2012) Banking reforms and the evolution of cost efficiency in Indian public sector banks, Economic Change and Restructuring, 46 (2): 143-182.
Kumar, S., and Verma, S., (2003) Technical efficiency, benchmarks and targets: a case study of Indian public sector banks, Prajnan: Journal of Social and Management Sciences, 31(4): 275-300.
Kumbhakar, S.C., and Sarkar, S., (2003) Deregulation, ownership and productivity growth in the banking industry: Evidence from India, Journal of Money, Credit, and Banking, 35: 403-424. http://dx.doi.org/10.1353/mcb.2003.0020
Lovell, C. A. K. (1993) Production Frontier and Productive Efficiency in H O Fried, C A K Lovell and S S Schmidt (edited) The Measurement of Productive Efficiency –Techniques and Applications, London: Oxford university Press.
Mahesh, H. P., and Rajeev, M., (2006) Liberalization and productive efficiency of Indian commercial banks: a stochastic frontier analysis, MPRA Paper No. 827. http://mpra.ub.uni-muenchen.de/827/1/MPRA_paper_827.pdf (accessed on 3rd July 2012).
Mittal, R.K. and Dhingra, S. (2007) Assessing the impact of computerization on productivity and profitability of Indian banks: an application of data envelopment analysis, Delhi Business Review, 8(1): 63- 73.
Molyneux, P. & J. Thornton (1992) Determinants of European Bank Profitability: A Note, Journal of Banking and Finance, 16(6): 1173-1178. http://dx.doi.org/10.1016/0378-4266(92)90065-8
Mukherjee, A., Nath, P. and Pal, M. N. (2002) Performance benchmarking and strategic homogeneity of Indian banks, International Journal of Bank Marketing, 20(3): 122-139. http://dx.doi.org/10.1108/02652320210430965
Naceur S., B and Goaied M (2001) The determinants of the Tunisian deposit banks performance, Applied Financial Economics, 11(3): 317-319. http://dx.doi.org/10.1080/096031001300138717
Naceur, S. B. (2003) The Determinants of the Tunisian Banking Industry Profitability: Panel Evidence, UniversiteLibre de Tunis Working Papers.
Niazi, G. (2003) Measuring Cost Efficiency and Prodctivity Change of Commercial Banks in Pakistan, 1991-2000, Thesis submitted to Department of Administrative Sciences, Quaid-I-Azam University, Islamabad, Pakistan.
Nigmonov, A (2010) Bank Performance and Efficiency in Uzbekistan, Eurasian Journal of Business and Economics, 3(5):1-25.
Nyawo, M. (2014) Technical Efficiency of Commercial Banks in Zimbabwe during a crisis Period: A Non-parametric Approach. Available at SSRN: http://ssrn.com/abstract=2490373. http://dx.doi.org/10.2139/ssrn.2490373
Pandey, I. M. (2013) Financial Management. 10thEdition Reprints in 2013. India: Vikas Publishing House Pvt. Ltd.
Pasiouras, F. AndKosimidou, K. (2007) Factor Influencing the Profitability of Domestic and Foreign Commercial banks in the European Union. Research in International Business and Finance, 21: 222-237. http://dx.doi.org/10.1016/j.ribaf.2006.03.007
Purohit, K. K. and Mazumdar, B. C. (2003) Post-Martem of Financial Performance and Prediction of Future Earning Capability of a Bank: An Application of CAMEL Rating and Balanced Scorecard. Indian Journal of Accounting, 34(1): 8-16.
Rammohan, T.T. and Ray, C. (2004) Comparing Performance of Public and Private Sector Banks: A Revenue Maximization Efficiency Approach. Economic and Political Weekly, 39(12):1271-1275.
Raphael, G (2013), Bank-specific, industry-specific and macroeconomic determinants of bank efficiency in Tanzania: A two stage Analysis, European Journal of Business and Management, 5(2).
Rajan, R.G. and Zingales, L. (1995) What do we know about capital structure? Some evidence from international data, Journal of Finance, 50:1421‐60. http://dx.doi.org/10.1111/j.1540-6261.1995.tb05184.x
Resende, M. (2000) Regulatory regimes and efficiency in US local telephony, Oxford Economic Papers, 52(3): 447-470.
Saha, A, and Ravisankar, T,S, (2000) Rating of Indian commercial banks: A DEA approach. European Journal of Operational Research, 124: 187-203. http://dx.doi.org/10.1016/S0377-2217(99)00167-8
Sanchez, I. M. G. (2009) Technical and Scale Efficiency in Spanish urban Transport: Estimating with data envelopment Analysis. Available at http://dx.doc.org/10.11552009/721279 (accessed on 11th November, 2011).
Sangmi, M. D. and Nazir, T. (2010) Analyzing Financial Performance of Commercial Banks in India: Application of CAMEL Model, Pakistan Journal of Commerce and Social Sciences, 4(1): 40-55
Sansui, N. , Kusari, S, Wahab, N amdHamzah, M (2007) Technical Efficiency of Malaysian and Indonesia Commercial Banks: A data envelopment analysis (DEA) Approach, Available at http://www.academia.edu/1540511/Technical_Efficiency_of_Malaysian_and_Indonesian_C ommercial_Banks_A_Data_Envelopment_Analysis_DEA_Approach (accessed on 20 October, 2013).
Sathye, M, (2003) Efficiency of Banks in a Developing Economy: The Case of India. European Journal of Operational Research, 148(3): 662-671. http://dx.doi.org/10.1016/S0377-2217(02)00471-X
Sathye, M. (2001) X-efficiency in Australian banking: An empirical investigation, Journal of Banking and Finance, 25(3): 613-630. http://dx.doi.org/10.1016/S0378-4266(00)00156-4 Saxonhouse, G. R. (1976) Estimated Parameters as Dependent Variables. American Economic Review, 66(1): 178-84.
Seelanatha, S.L. (2007) Efficiency, Productivity Change and market Structure of the Banking Industry in Sri Lanka. Dissertation submitted to Faculty of Business, University of Southern Queensland, Australia.
Seiford, L.M., and Thrall, R.M., (1990) Recent developments in DEA: the mathematical programming approach to frontier analysis, Journal of Econometrics, 46(1-2): 7-38. http://dx.doi.org/10.1016/0304-4076(90)90045-U
Sensarma, R. (2006) Are foreign banks always the best? Comparison of state-owned, private and foreign banks in India, Economic Modelling, 23(4): 717–735. http://dx.doi.org/10.1016/j.econmod.2006.04.002
Shanmugam, K.R., and Das, A., (2004) Efficiency of Indian commercial banks during the reform period, Applied Financial Economics, 14(9): 681–686. http://dx.doi.org/10.1080/0960310042000233458
Sharma, A. K., Sharma, D., and Barua, M. K., (2012) Efficiency and Productivity of Indian Banks: An Application of Data Envelopment Analysis and Panel Data Tobit Regression in National Conference on Emerging Challenges for Sustainable Business 2012.
Srivastava, A., and Jain, V., (2006) Efficiency of banks in India: A DEA approach, Review of Professional Management, 4(2): 31-38.
Staub, R. B., De Sauza, G. and Tabak, B.M. (2010) Evolution of bank Efficiency in Brazil: A DEA approach, European Journal of Operational Research, 202: 204-213. http://dx.doi.org/10.1016/j.ejor.2009.04.025
Sufian, F (2009), Determinants of Bank efficiency during unstable macroeconomic environment: Empirical Evidence from Malaysia, Research in International Business and Finance, 23(1): 54-77. http://dx.doi.org/10.1016/j.ribaf.2008.07.002
Tobin, J. (1958) Estimation of relationships for limited dependent variables. Econometrica, 26 (1): 24–36. http://dx.doi.org/10.2307/1907382
Uddin, S.M. and Suzuki, Y. (2011) Financial Reform, Ownership and Performance in Banking Industry: The Case of Bangladesh, International Journal of Business and Management, 6(7): 28-39. http://dx.doi.org/10.5539/ijbm.v6n7p28
Varadi, V. K., Mavaluri, P. K., and Boppana, N., (2009) Measurement of Efficiency of Banks in India, MPRA Paper No. 17350, posted 17, September 2009.
Vujcic, B and Jemric, I (2002) Efficiency of Banks in Transition: A DEA Approach. Working Paper, Croatian National bank.
Wanniarachchige, M. K., & Suzuki, Y. (2011) Performance dynamics of Indian Commercial Banks: Does ownership matter? Paper presented at The Clute Institute International Academic Conferences, Maui, Hawaii.
Yang, Z. (2009) Bank Branch Operating Efficiency: A DEA Approach, Proceedings of the International Multi Conference of Engineers and Computer Scientists IMECS 2(18 – 20), Hong Kong.
Yue, P, (1992) Data Envelopment Analysis and Commercial Bank Performance: A Primer with Applications to Missouri Banks, Federal Reserve Bank of St. Louis Review, 74(1): 31-45. Zeitun, R, and Benjelloun, H, (2013) The Efficiency of Banks and the Financial Crisis in a Developing Economy: The Case of Jordan, Journal of Finance, Accounting and Management, 4(1): 1-20.