Biocompatible Solutions and Long-Term Changes in Peritoneal Solute Transport
Emma H Elphick1, Lucy Teece1, James A. Chess2, Jun-Young Do3, Yong-Lim Kim4, H. Bahl Lee5, Sara N. Davison6, Nicholas Topley7 Simon J. Davies1 and Mark Lambie1
1 Institute of Applied Clinical Sciences, Keele University, UK; 2 Morriston Hospital, Swansea, UK; 3 Division of Nephrology, Yeungnam University Hospital, Daegu, South Korea; 4
Kyungpook National University Hospital; 5 Hyonam Kidney Laboratory, Soon Chun Hyang University, Seoul, South Korea; 6 University of Alberta; 7 Cardiff University School of Medicine, Heath Park, Cardiff, United Kingdom.
Word Count: Abstract 301, Main Text 3179
Running Head: Solute Transport and biocompatibility in PD
Corresponding Author: Dr. Mark Lambie
Address: Renal Unit, Royal Stoke University Hospital, Stoke on Trent. ST4 6QG.
Telephone: 01782 676346
Abstract
Background and objectives
The inflammation-driven increase in peritoneal solute transport rate (PSTR) that occurs during long-term peritoneal dialysis (PD) is associated with higher mortality, hospitalization and encapsulating peritoneal sclerosis. As biocompatible solutions were developed to mitigate these effects, we examined the association with their use and longitudinal PSTR.
Design, setting, participants, and measurements
We analysed subjects from the multinational prospective Global Fluid Study with ≥three PSTR measurements more than two months from the start of PD. Follow up was for 7.5 years (median of 2.3 IQR 1.8-3.6) in biocompatible solutions and 12.8 years (median 3.2 IQR 1.9-4.3) for standard solutions. Using a random intercept/slopes multilevel model we examined the association of patients using biocompatible solutions and PSTR over time adjusting for centre effects, dialysate dextrose concentration, baseline dialysate interleukin-6 concentration, icodextrin use, residual kidney function and peritonitis.
Results
an associated increase in PSTR of 0.033 (95% CI 0.015, 0.052) per episode, whereas in patients using biocompatible solutions there was no change in this parameter (-0.014, 95% CI -0.033, 0.003).
Conclusions
Introduction
Over time peritoneal dialysis (PD) can cause progressive injury to the peritoneal membrane. Local inflammation, with an increase in membrane vascularity, is the likely driver of this, evidenced by faster peritoneal solute transport rate (PSTR).1,2Faster PSTR is strongly
associated with the likelihood of poor outcomes including technique failure and mortality. 3
Encapsulating peritoneal sclerosis is a rare but serious complication also associated with higher PSTR.4 Mechanisms leading to this increase are multifactorial but may include conventional (bioincompatible) dialysis solutions, cumulative glucose (or glucose degradation product) exposure and episodic peritonitis.5
Animal model data suggests that biocompatible solutions are better able to preserve membrane integrity in vivo after exposure to PD solutions6 and data on peritoneal
morphology suggests fewer adverse changes with biocompatible solutions .7 an early cross-over study in patients suggested that biocompatible solutions may increase PSTR,8 but more recent meta-analyses 9,10 have failed to demonstrate a consistent effect. As shown in the Balance in Australia and New Zealand peritoneal dialysis patients BalANZ® study, 11 differences may vary over time, however the greatest clinical concern is over long-term changes in PSTR, which no randomised trials have directly addressed.
Methods
Study design
The Global Fluid Study was an international multi-centre prospective observational cohort study, detailed by Lambie et al.12 The study included 10 centres from the UK, Canada and South Korea enrolling patients from June 2002 to December 2008, censored at centre specific dates during December 2010. Any patient on PD capable of informed consent was eligible.
Data was collected on a purpose-built access database (PDDB). Ethical approval was obtained from the multi-centre research ethics committee for Wales, from Kyungpook National University Hospital ethics committee and from University of Alberta ethics
committee. The study adhered to the Declaration of Helsinki. Written informed consent was obtained from all patients.
Comorbidity data utilised the validated Stoke Comorbidity Index13. Data collected on PD regime included type of PD, use of icodextrin, brand of solution and dose. PSTR was measured as the 4-hour dialysate/plasma creatinine ratio with 2.5% or 4.25% dextrose approximately every 6 months. Daily dialysate dextrose concentration was calculated as the average of the dextrose concentrations in all bags used in a 24-hour period e.g. a regime of 2 bags of 2 liters at 1.5% dextrose, one bag of 2 liters at 2.5% dextrose, and one bag of 1.5 liters of 7.5% icodextrin has a daily dialysate dextrose concentration = (4x1.5 + 2x2.5 + 1.5x0)/8 = 1.38%).
immune assays for Interleukin-6 IL-6 levels used the commercially available pro-inflammatory i 4-plex (meso-scale discovery, Gaithersburg, Maryland, USA). Baseline dialysate and peritoneal IL-6 were used for this analysis, log transformed due to their log-normal distribution.
Patients were included if they had had three or more PSTR measurements beyond the first 2 months on PD, with the first measurement less than twelve months from the start of PD, and remained on either biocompatible solutions or standard solutions during follow up. Measurements over 7 years after the start of PD were removed due to low patient numbers and no biocompatible solutions patients having measurements past 7 years. 2 centres were not included as one lacked longitudinal follow up data and another did not use
biocompatible solutions
Statistical analysis
Results
Patient characteristics
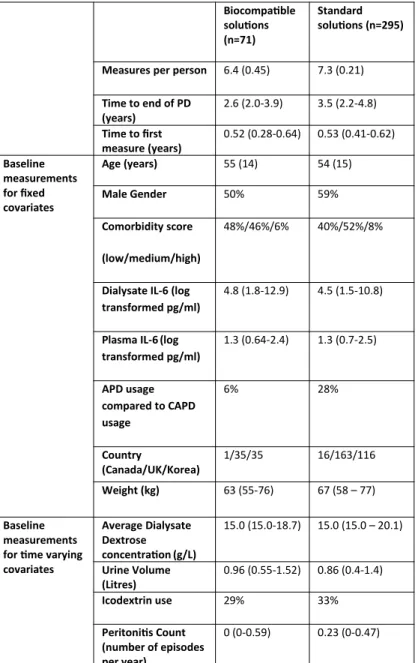
366 patients with 2290 measurements were included in the final analysis (Figure 1). Of the 71 patients in the biocompatible solutions -only group, 58 (82%) used Baxter Physioneal, 8 (11%) used Fresenius Staysafe® balance and 5 (7%) used Gambrosol-Trio. Of the 295 patients in the standard solutions-only group, 245 used Baxter Dianeal, 50 used Fresenius Staysafe® and one used Boryung Peresis. Patients using biocompatible solutions were less likely to be on APD and had a shorter duration on PD due to the small number of prevalent patients using biocompatible solutions. (Table 1). Follow up was for 7.5 years (median of 2.3 IQR 1.8-3.6) in biocompatible solutions and 12.8 years (median 3.2 IQR 1.9-4.3) for standard solutions. There was no apparent difference in time to treatment failure between
biocompatible solutions and standard solutions (cox proportional hazards regression hr 1.18, 95% CI 0.67 to 2.06). Drop-out caused by death, transplantation or treatment failure in the biocompatible solutions and standard groups were 50% (n=25) and 61% (n=138)
respectively after 3.5 years. 124 patients recorded using both biocompatible solutions and standard solutions at different time points were not included in the analysis. Baseline characteristics in this group compared to patients included in the final analysis were not clinically significantly different for age, gender comorbidity score and urine volume but were clinically significantly different with regards to time on PD and modality of PD. (Table 1)
Peritoneal transport over time
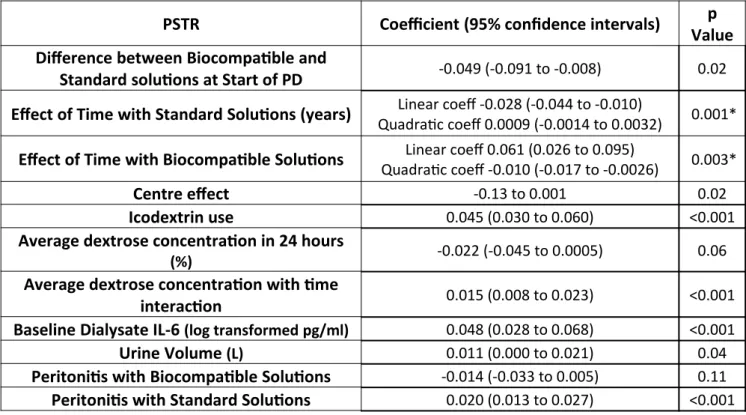
approximately level until an increase between 3.5 (0.721) and 7 years (0.741) of treatment (Figure 2) when adjusted for other known determinants of PSTR. With biocompatible solutions, PSTR was lower at baseline with a steeper initial rise in PSTR. By two years therapy PSTR was similar for both solutions (adjusted PSTR standard solutions 0.724 95% CI 0.709 to 0.738, biocompatible solutions 0.722 (95% CI 0.689 to 0.751). There was, however, no further increase in PSTR in patients using biocompatible solutions between years 2 and 4 of treatment. Supplementary Figure 1 shows adjusted change over time overlying individual changes over time.
Including measurements from the start of PD rather than 2 months after the start made no apparent difference (Supplementary Table 2). Both linear and quadratic time functions were included to allow non-linear changes, and these, as well as random effects for them
(allowing the trajectory to vary between individuals in a non-linear way) remained significant within the model. (Table 2) A sensitivity analysis retaining all variables without backwards selection made little difference (Supplementary Table 5).
Dialysate IL-6
Higher baseline dialysate IL-6 concentrations were associated with a faster PSTR for the duration of follow up (Table 2). Plasma IL-6 levels had no significant association with PSTR (change in PSTR with one log10 increase in plasma IL-6 concentration =0.009, 95% CI -0.049 to 0.069).
Peritoneal fluid dextrose and icodextrin
use also increased with PD duration (31% of patients in the first 6 months rising to 55% after 3.5 years) and it was associated with a faster solute transport in the fully adjusted multilevel model (table 2).
In the fully adjusted model, icodextrin use had no association with the trajectory of PSTR over time, but the daily dextrose concentration did (Figure 3), with little difference in PSTR at the start and increasing difference with duration of PD. A 1.93% daily dextrose
concentration (75th centile, “high glucose”) had an adjusted PSTR of 0.727 (95% CI 0.712 to 0.741) at 2 years and 0.811 (95% CI 0.775 to 0.846) after 6 years on PD. A 1.33% daily dextrose concentration (25th centile, “low glucose”) had an adjusted PSTR of 0.720 (95% CI 0.705 to 0.736) at 2 years and 0.713 (95% CI 0.676 to 0.749) at 6 years.
Sensitivity analysis included substituting daily mass of dextrose (g/day) for daily dextrose concentration resulted in a worse fit for the model (AIC 335.9 and 333.5, BIC 3186.7 and -3174.4 for concentration and mass respectively, more negative values representing an improved fit). Biocompatible solution usage had similar effects on PSTR in patients not using Icodextrin (Supplementary Table 3). There was no interaction between Icodextrin usage and biocompatible solutions usage.
Residual kidney function
unit of kidney clearance =0.0001, 95% CI -0.0001 to 0.0004). There was no significant
interaction with biocompatibility. Biocompatible solutions use was not associated with urine volume in a separate multilevel model (biocompatible solutions coefficient 120 95% CI -39 to 280).
Peritonitis
One or more episodes of peritonitis occurred in 198 of the patients studied, 29 biocompatible solutions (41%) and 169 standard solutions (57%). The most common organism in both groups was coagulase negative staphylococcus (biocompatible solutions 24% standard solutions 28%), and culture negative peritonitis/no organism reported was seen in 31% and 38% (biocompatible solutions and standard solutions respectively). A post peritonitis rise in PSTR was seen in standard solutions with no significant effect of peritonitis on PSTR in biocompatible solutions (table 2). In a Cox model there was no difference in time to first peritonitis episode between biocompatible and standard solutions, when adjusted for centre, glucose exposure, icodextrin and dialysate IL-6 (HR 1.54 95% CI 0.94 to 2.52). There were no significant differences in outcome of 1st peritonitis episode between groups (Supplementary Table 4).
Effect of time varying covariates
Changes in variance over time
Discussion
In the primary longitudinal analysis of this large multi-national cohort study, we tested the hypothesis that biocompatible solutions use would be associated with stable short to medium term membrane function. This hypothesis proved false as PSTR, although starting slower in patients using biocompatible solutions, rises to similar levels seen in standard solutions after two years treatment. After 2 years, there was a potentially beneficial effect of biocompatible solutions on PSTR, with abrogation of the increases in PSTR observed in patients using standard solutions. In addition, the increases in PSTR associated with
peritonitis episodes were absent in patients using biocompatible solutions. The magnitude of these effects was less than the impact of using higher dialysate dextrose concentrations.
For standard solutions, when adjusted for peritonitis, daily glucose exposure and urine volume, there was no evidence of an increase in PSTR over the first two years of treatment. This finding contrasts with previous studies finding either a reduction in PSTR between one and four months of treatment, 14 or a significant increase in PSTR between one month and
determinants of the early variability in solute transport and variation in peritonitis, residual kidney function and dialysate dextrose concentration.
The unadjusted model showed a clear overall increase in PSTR over time (Supplementary Table 1), mostly accounted for by peritonitis, glucose exposure and residual kidney function. This finding is in keeping with previous cohort studies describing membrane injury,
explained by changes in peritonitis, glucose exposure and residual kidney function. 1,3,16,17
As found previously 17,18 these results show that increasing daily glucose exposure is associated with long-term increases in PSTR. This could be a result of glucose-driven
pathophysiological changes in the membrane and/or this could be a treatment response to increasing membrane permeability driven by other clinical factors e.g. peritonitis.
The largest randomised study examining the effect of biocompatible solutions on membrane function is the balANZ study, demonstrating that initial PSTR was faster with biocompatible solutions compared to standard solutions. Over two years the PSTR remained stable in biocompatible solutions treated patients whereas it increased in patients treated with standard solutions.11 in contrast, in this observational cohort we found a slower PSTR in biocompatible solutions at the beginning of therapy but differences disappeared after two years treatment. Between two to four years of treatment, average PSTR remained stable in the biocompatible solutions group but increased in the standard solutions group. One possible explanation for these observed differences could be differences in the
brands of biocompatible solutions, with the majority on Physioneal using a
bicarbonate/lactate buffer. BalANZ exclusively used the lactate-buffered balance with a pH of 7.0. Unfortunately, we did not have sufficient numbers using the different manufacturers solutions for a meaningful comparison. Although the data may be viewed as inconsistent, taken together these studies unequivocally demonstrate differences in PSTR changes in patients using standard and biocompatible solutions. Whilst the impact of these differences on clinical outcome remain to be robustly determined, stabilisation of solute transport would generally be regarded as clinically beneficial. 19,20
We observed that patients using icodextrin had an overall faster PSTR which may be the result of indication bias. As opposed to dialysate glucose, there was no deterioration over time in PSTR with icodextrin.
In keeping with previous research demonstrating a robust association between
intra-peritoneal interleukin 6 (IL-6) production and faster PSTR, 12,21,22 baseline dialysate IL-6 levels
were associated with faster PSTR for the duration of follow up, whilst plasma IL-6 had no effect. Whilst IL-6 has many immunomodulatory effects 23,24 recent observations linking IL-6 signalling to peritoneal VEGF production provide a mechanism by which IL-6, not itself vasoactive, might alter angiogenesis and vascular permeability in the peritoneal membrane. 25
Long-term rises in PSTR occur in patients with severe peritonitis or clusters of peritonitis episodes, 1 and the increased power of this study extended this, showing a small but measurable long-term rise in PSTR after a single episode for patients on standard solutions. This is consistent with another report suggesting that the first episode of peritonitis results in PSTR changes. 27
Whilst we did find a significant change in solute transport over time with biocompatible solutions, the association between peritonitis and a faster PSTR disappeared in patients using biocompatible solutions. One potential explanation for this protective effect could be reduced severity of peritonitis with biocompatible solutions, as suggested in the BalANZ study. 16
The strengths of the current study lie in the large size ensuring adequate power, good generalisability with different centres in different countries and the robust and validated statistical approach. The limitations of our analysis include the observational nature of the study, meaning that causality cannot be proven although there were few clinically
standard solutions but the estimated effects had narrow confidence intervals. There were too few patients to test whether effects differed by manufacturer.
In conclusion, the use of biocompatible solutions (in this case irrespective of manufacturer) was associated with alterations in solute transport rates at different phases of PD
Disclosures
Acknowledgements
The authors would like to acknowledge the support of Anna-Clare Smith, Kathryn Craig, Maureen Fallon, and Charlotte James in the coordination of the GLOBAL study and the following clinical staff in the centers in coordination of sample and clinical data collection: Hilary Huxtable, SRN (Renal Unit, Morriston Hospital, Swansea, United Kingdom); Dr. Paul Williams, Gill Gilbert, RGN (Hons) (Ipswich Hospital NHS Trust); Catherine Jones, RGN, and Jane Hollis, RGN (Hons) (Cambridge University Hospitals, NHS Foundation Trust); Jung-Ju Seo (Kyungpook National University Hospital, Daegu, South Korea); Kei-Lim Shin (Yeungnam University Hospital, Daegu, South Korea); Sung Hee Chung (Hyonam Kidney Laboratory, Soon Chun Hyang University, Seoul, South Korea); Dr. Marc Dorval, Joanne Leblanc-Chiasson, Rachel Belliveau, and Régina Arsenault (research assistant) (Dr. Georges-L.-Dumont Hospital, Moncton, New Brunswick, Canada); Kathy Yetzer and Donna Hackman (Division of Nephrology and Immunology, Department of Medicine, University of Alberta, Edmonton, Canada); and the nursing team on the PD Unit at the University Hospital of Wales, Cardiff, United Kingdom.
References
1. Davies SJ, Bryan J, Phillips L, et al. Longitudinal changes in peritoneal kinetics: the effects of
peritoneal dialysis and peritonitis. Nephrol Dial Transplant 1996; 11: 498-506.
2. Flessner MF. Inflammation from sterile dialysis solutions and the longevity of the peritoneal
barrier. Clin Nephrology 2007;68: 341-348.
3. Brimble KS, Walker M, Margetts PJ, et al. Meta-analysis: peritoneal membrane transport,
mortality, and technique failure in peritoneal dialysis. J Am Soc Nephrol 2006;17: 2591-2598.
4. Lambie ML, John B, Mushahar L, et al. The peritoneal osmotic conductance is low well before
the diagnosis of encapsulating peritoneal sclerosis is made. Kidney Int 2010; 78: 611-618.
5. Devuyst O, Margetts PJ, Topley N. The pathophysiology of the peritoneal membrane. Journal
Of The American Society Of Nephrology: JASN 2010; 21: 1077-1085.
6. Mortier S, Faict D, Schalkwijk CG, et al. Long-term exposure to new peritoneal dialysis
solutions: Effects on the peritoneal membrane. Kidney Int 2004; 66: 1257-1265.
7. Haas S, Schmitt CP, Arbeiter K, et al. Improved acidosis correction and recovery of
mesothelial cell mass with neutral-pH bicarbonate dialysis solution among children undergoing
automated peritoneal dialysis. J Am Soc Nephrol 2003; 14: 2632-2638.
8. Williams JD, Topley N, Craig KJ, et al. The Euro-Balance Trial: the effect of a new
biocompatible peritoneal dialysis fluid (balance) on the peritoneal membrane. Kidney Int 2004; 66:
408-418.
9. Cho Y, Johnson DW. Does the use of neutral pH, low glucose degradation product peritoneal
10. Yohanna S, Alkatheeri AMA, Brimble SK, et al. Effect of Neutral-pH, Low-Glucose
Degradation Product Peritoneal Dialysis Solutions on Residual Renal Function, Urine Volume, and
Ultrafiltration: A Systematic Review and Meta-Analysis. Clin J Am Soc Nephrol 2015; 10: 1380-1388.
11. Johnson DW, Brown FG, Clarke M, et al. The effect of low glucose degradation product,
neutral pH versus standard peritoneal dialysis solutions on peritoneal membrane function: the
balANZ trial. Nephrol Dial Transplant 2012; 27: 4445-4453.
12. Lambie M, Chess J, Donovan KL, et al. Independent effects of systemic and local peritoneal
inflammation on membrane function and survival of PD patients: results from the GLOBAL Fluid
Study. J Am Soc Nephrol 2013; 24: 2071–2080.
13. Davies SJ, Phillips L, Naish PF, et al. Quantifying comorbidity in peritoneal dialysis patients
and its relationship to other predictors of survival. Nephrol, Dial, Transplant 2002; 17:
1085-1092.
14. Struijk DG, Krediet RT, Koomen GC, et al. A prospective study of peritoneal transport in CAPD
patients. Kidney Int 1994; 45: 1739-1744.
15. Johnson DW, Mudge D, Blizzard S, et al. A comparison of peritoneal equilibration tests
performed 1 and 4 weeks after PD commencement. Perit Dial Int 2004; 24:460-5
16. Johnson DW, Brown FG, Clarke M, et al. The effects of biocompatible compared with
standard peritoneal dialysis solutions on peritonitis microbiology, treatment, and outcomes: the
balANZ trial. Perit Dial Int 2012; 32: 497-506.
17. Davies SJ, Phillips L, Naish PF, et al. Peritoneal glucose exposure and changes in membrane
solute transport with time on peritoneal dialysis. J Am Soc Nephrol 2001; 12: 1046-1051.
18. Williams JD, Craig KJ, Topley N, et al. Morphologic changes in the peritoneal membrane of
19. Mehrotra R, Devuyst O, Davies SJ, et al. The Current State of Peritoneal Dialysis. J Am Soc
Nephrol: JASN 2016; 27: 3238-3252.
20. Davies SJ, Phillips L, Russell GI. Peritoneal solute transport predicts survival on CAPD
independently of residual renal function. Nephrol Dial Transplant 1998; 13: 962-968.
21. Pecoits-Filho R, Carvalho MJ, Stenvinkel P, et al. Systemic and intraperitoneal interleukin-6
system during the first year of peritoneal dialysis. Perit Dial Int 2006; 26: 53-63.
22. Oh K-H, Jung JY, Yoon MO, et al. Intra-peritoneal interleukin-6 system is a potent
determinant of the baseline peritoneal solute transport in incident peritoneal dialysis patients.
Nephrol Dial Transplant 2010; 25: 1639-1646.
23. Jones SA, Fraser DJ, Fielding CA, et al. Interleukin-6 in renal disease and therapy. Nephrol
Dial Transplant 2015; 30: 564-574.
24. Jones SA, Horiuchi S, Topley N, et al. The soluble interleukin 6 receptor: mechanisms of
production and implications in disease. FASEB J 2001; 15: 43-58.
25. Catar R, Witowski J, Zhu N, et al. IL-6 Trans-Signaling Links Inflammation with Angiogenesis in
the Peritoneal Membrane. J Am Soc Nephrol 2017; 28: 1188-1199.
26. Davies SJ. Longitudinal relationship between solute transport and ultrafiltration capacity in
peritoneal dialysis patients. Kidney Int 2004; 66: 2437-2445.
27. van Diepen AT, van Esch S, Struijk DG, et al. The first peritonitis episode alters the natural
course of peritoneal membrane characteristics in peritoneal dialysis patients. Perit Dial Int 2014; 35:
Tables and Figures
Table 1. Baseline characteristics for patients using biocompatible or standard solutions.
Characteristics for patients excluded as using both biocompatible and standard solutions
included in Supplementary Table 1
Biocompatible solutions (n=71)
Standard solutions (n=295)
Measures per person 6.4 (0.45) 7.3 (0.21)
Time to end of PD (years)
2.6 (2.0-3.9) 3.5 (2.2-4.8)
Time to first measure (years)
0.52 (0.28-0.64) 0.53 (0.41-0.62)
Baseline measurements for fixed covariates
Age (years) 55 (14) 54 (15)
Male Gender 50% 59%
Comorbidity score
(low/medium/high)
48%/46%/6% 40%/52%/8%
Dialysate IL-6 (log transformed pg/ml)
4.8 (1.8-12.9) 4.5 (1.5-10.8)
Plasma IL-6(log transformed pg/ml)
1.3 (0.64-2.4) 1.3 (0.7-2.5)
APD usage compared to CAPD usage
6% 28%
Country
(Canada/UK/Korea)
1/35/35 16/163/116
Weight (kg) 63 (55-76) 67 (58 – 77)
Baseline measurements for time varying covariates
Average Dialysate Dextrose concentration(g/L)
15.0 (15.0-18.7) 15.0 (15.0 – 20.1)
Urine Volume (Litres)
0.96 (0.55-1.52) 0.86 (0.4-1.4)
Icodextrin use 29% 33%
Peritonitis Count (number of episodes per year)
0 (0-0.59) 0.23 (0-0.47)
Table 2. Predictors of changes in solute transport over time
PSTR Coefficient (95% confidence intervals) p
Value Difference between Biocompatible and
Standard solutions at Start of PD -0.049 (-0.091 to -0.008) 0.02 Effect of Time with Standard Solutions (years) Linear coeff -0.028 (-0.044 to -0.010)
Quadratic coeff 0.0009 (-0.0014 to 0.0032) 0.001*
Effect of Time with Biocompatible Solutions Linear coeff 0.061 (0.026 to 0.095)
Quadratic coeff -0.010 (-0.017 to -0.0026) 0.003*
Centre effect -0.13 to 0.001 0.02
Icodextrin use 0.045 (0.030 to 0.060) <0.001
Average dextrose concentration in 24 hours
(%) -0.022 (-0.045 to 0.0005) 0.06
Average dextrose concentration with time
interaction 0.015 (0.008 to 0.023) <0.001
Baseline Dialysate IL-6 (log transformed pg/ml) 0.048 (0.028 to 0.068) <0.001
Urine Volume (L) 0.011 (0.000 to 0.021) 0.04
Peritonitis with Biocompatible Solutions -0.014 (-0.033 to 0.005) 0.11 Peritonitis with Standard Solutions 0.020 (0.013 to 0.027) <0.001 Multilevel multivariable model demonstrating the effect of covariates on PSTR. Coefficients
Figures and Legends
Figure 1. Flow diagram showing inclusion of participants in analysis
n –number of patients, m – number of measurements
Figure 2. Change in solute transport for standard (A) and biocompatible (B) solutions with
comparison of average change (C) for both solutions
Solid grey and black lines represent the adjusted PSTR for standard and biocompatible solutions respectively with dotted lines for 95% CI. Standard solutions remain stable then demonstrated a slight rise. Biocompatible solutions have a slower PSTR at baseline but a steeper increase in PSTR over time, this stabilises at 2 years. PSTR values are adjusted for centre, Icodextrin use, daily dextrose concentration, baseline dialysate IL-6, peritonitis and urine volume. There were 43 (60%) and 219 (60%) patients in the biocompatible and bioincompatible groups respectively at 2 years follow up and 11 (15%) and 96 (33%) at 4 years. Modelling of biocompatible solutions was stopped at 4 years due to the low patient numbers beyond this.
Figure 3. Changes in solute transport for standard solutions by dialysate dextrose
concentration
Trajectory over time for low (1.33%, 25th centile), medium (1.5%, 50th centile) and high (1.93 %, 75th centile) daily dextrose concentration. High dextrose concentration is associated with an increase in PSTR over time compared to low or medium concentrations. This effect of dialysate dextrose concentration on the trajectory of PSTR has strong evidence (p<0.001) in the model.
Unadjusted PSTR (D/P Cr) and 95% Confidence Intervals over time by solution type A – Standard Solutions, and B – Biocompatible Solutions. C Effect of constant average vs. time varying actual values on sample patient selected using random number generator.
Figure 5. Changing variance of PSTR with time on peritoneal dialysis