A procedure for identifying possible products in the Assembly-Disassembly-Organisation-Reassembly (ADOR) synthesis of zeolites
Susan E. Henkelis,1 Michal Mazur,1,2 Cameron M. Rice,1 Giulia P. M. Bignami,1 Paul S. Wheatley,1 Sharon E. Ashbrook,1 Jiří Čejka,2,3 and Russell E. Morris1,2*
1 School of Chemistry and EaStCHEM, University of St. Andrews, North Haugh, St. Andrews, Fife, KY16 9ST, United Kingdom. 2 Department of Physical and Macromolecular Chemistry Faculty of Sciences, Charles University, Hlavova 8, 128 43
Prague 2, Czech Republic 3J. Heyrovský Institute of Physical Chemistry, Academy of Sciences of the Czech Republic, v.v.i., Dolejškova 3, 182 23 Prague 8, Czech Republic
INTRODUCTION
[image:2.595.37.288.305.733.2]Zeolites are an important class of microporous solids that are widely used in industry. They are one of the most important families of heterogeneous catalysts in use today,1,2 but are also used in a wide variety of other applications from ion exchange and water softening, through to medical applications. The Assembly-Disassembly-Organization-Reassembly (ADOR) process3–9 is a new method for preparing members of this important class of compound. This differs from traditional zeolite synthetic processes, which generally involve reversible crystallization under hydrothermal conditions,10 followed by an irreversible condensation to form the final framework.11 The consequence of this is that materials with unexpected energetic properties can be prepared using ADOR that are unlikely to be possible using the traditional methods.3
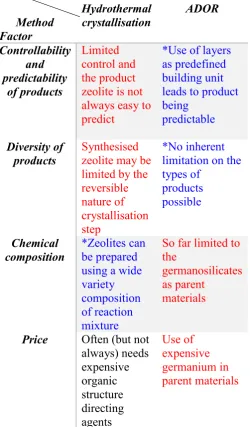
Table 1. Differences in preparation of high silica zeolites. Advantages are colour coded blue. Limitations are colour coded red. Advantages are marked with an asterisk.
Method Factor Hydrothermal crystallisation ADOR Controllability and predictability of products Limited control and the product zeolite is not always easy to predict
*Use of layers as predefined building unit leads to product being
predictable
Diversity of products
Synthesised zeolite may be limited by the reversible nature of crystallisation step
*No inherent limitation on the types of products possible Chemical composition *Zeolites can be prepared using a wide variety composition of reaction mixture
So far limited to the
germanosilicates as parent
materials
Price Often (but not
This opens up the possibility of preparing materials with different structures than those currently possible, which in turn may lead to new applications. There are many advantages and limitations to using both traditional hydrothermal synthesis and the ADOR process. Just a few of these have been highlighted below in Table 1.
A key feature required for the success of the ADOR method is the structure and chemistry of the parent zeolite that is assembled in the first step of the process, usually following previous literature methods. Research so far has concentrated on parents that have silica-rich layers linked by germanium-rich cubic units, termed double four rings (d4rs).12–16 Generally, to be successful in the ADOR process, these d4r units must contain enough Ge to break the connections between the layers as the Ge is hydrolysed, allowing the parent zeolite to be disassembled.17,18 The specific location of the Ge within the d4r units is often difficult to determine without highly specialised diffraction experiments.17 There are several known zeolite topologies that have the features necessary for successful application in the ADOR process. These include UTL,3,6,7 ITH,19 ITR,19 IWR,19 IWW,20 UOV21,22 and the recently discovered SAZ-123 (note that a description of how the nomenclature of zeolites is derived is found below). There are several characterisation techniques that have been used to probe the ADOR mechanism and the daughter zeolites produced, including powder X-ray diffraction (PXRD) and the subsequent Rietveld refinement,24,25 in situ and ex situ Pair Distribution Function (PDF) analysis,24,26 solid-state NMR spectroscopy25,27 and high resolution electron microscopy.5,16
The ADOR process is extremely flexible, and starting from only one parent zeolite with the UTL framework topology a family of six new zeolites, named IPC-2 (OKO), IPC-4 (PCR), IPC-6 (*PCS), IPC-7, IPC-9 and IPC-10, can be prepared.3,6,7 Previously reported by Wheatley et al.,5 a study showed the pH dependence of hydrolysis and subsequent rearrangement. It was found that the rate of the initial hydrolysis (disassembly) does not depend greatly on the pH of the hydrolysis medium. Unlike the hydrolysis however, the rearrangement process is influenced by the acidity of the reaction media. When HCl of < 0.1 M is used, IPC-4 (PCR) is formed preferentially after reassembly; increasing the molarity shows a steady increase in inter-layer spacing, and materials such as IPC-6 (*PCS) can be formed. When the acidity is high enough, all reactions formed IPC-2 (OKO). 5 Time is also an important variable in the reaction outcome.
Such diversity of outcomes points to a complex mechanism that must be understood in detail if the full potential of the process is to be realised. The different outcomes depend on the conditions used, and it is therefore very easy to miss prospective products by not surveying the potential conditions over a sufficient range. To avoid this possibility, we have developed a standard protocol through which a wide range of conditions are tested. Here we present this protocol using zeolite UTL as an archetypal parent zeolite.
Design and overview of the procedure
chemical weakness within to produce a layered species (Disassembly); an organization (rearrangement/re-intercalation) step where the layers are brought into the correct orientation for reconnection (Organization); formation of new Si-O-Si bonds between the layers to produce new daughter zeolites after subsequent calcination (Reassembly).7
The procedure presented here concentrates on identifying the intermediates that result from the D and O stages in the process, as it is these stages that really control the nature of the final product. There are three main variables that have to be controlled: time, temperature, and acidity of the disassembly medium. If all possible outcomes from the ADOR process are to be recognized it is important that sufficient parameter space is sampled. On the other hand, we want to make sure that the protocol is efficient in terms of time. By considering this balance, we have designed a protocol that uses four different disassembly media (water, 0.1 M HCl, 1.5 M HCl, and 6M HCl) and temperatures that range between 20 and 100 °C. It is also important to develop a simple method to systematically monitor the progress of the ADOR process as it proceeds. As the samples taken during the course of the reaction are crystalline (or semi-crystalline) PXRD is an appropriate tool to study samples that are recovered from the reaction as it progresses. In particular, the d spacing at which the 200 reflection appears in the XRD pattern gives an excellent indication of the interlayer spacing in the material. The d200 value can then be plotted against time for each of the chosen conditions (temperature and acidity) to yield plots that are instructive in determining how the reaction is proceeding, and allowing us to identify the various steps in the process. Other techniques, such as solid-state NMR spectroscopy and high-resolution transmission electron microscopy (HRTEM) can then be used as required to further characterize different samples.
The starting point for the protocol developed here uses water as the disassembly (hydrolysis) medium and the reaction is completed under reflux. The equipment is assembled as shown in Figure 2 and as described in detail below. A three-neck round-bottom flask is charged with the hydrolysis medium, and the system brought to the required temperature. The parent zeolite is added to the system and samples of the solid material in the reaction are taken at specified time intervals. These samples are analysed using PXRD. The conditions used for the procedure can then be altered as required to find all possible products as demonstrated below.
Extensions
While this protocol uses only Ge-UTL as the parent zeolite, it is designed so that any parent zeolite can be substituted in its place. This will be particularly useful as new parent zeolites are discovered, as the protocol will provide evidence rapidly as to whether the ADOR process can be successfully applied or not.
Given the knowledge of the ADOR process at the present time it is likely that this protocol will provide detailed information on the disassembly stage of the process, as this generally happens quickly and at low temperature. However, for parent zeolites other than UTL the reintercalation/rearrangement step might not occur at a rate that can be probed by this protocol on a sensible timescale. If higher temperatures are required then a new experimental set up, using hydrothermal equipment, may be necessary.
Terminology
Unlike many organic or inorganic compounds, zeolites and zeo-types cannot be named by classic naming methods. Instead, the material is named for the establishment where it was first produced and then given a 3-letter code once accepted into the International Zeolite Association (IZA) database. For example, IPC-4 was named as the Institute of Physical Chemistry zeolite 4, and then, upon acceptance by the IZA database, was given the code PCR. The archetype parent zeolite, UTL, discussed in this protocol was produced by 2 groups in 2004. It was given the name IM-12 (Institut Français du Pétrole/Mulhouse-12)28 by Paillaud et al. and ITQ-15 (Instituto de Tecnología Química-15)29 by Corma et al. and assigned the IZA code UTL. The addition of an asterisk to the IZA code (such as in *PCS) indicates that there is some disorder in the characterised material. Further information on nomenclature can be found on the IZA website, www.iza-online.org.
To differentiate between the final products that are produced after the reassembly (R) step from the precursors that are formed only after the disassembly (D) and organisation (O) steps, the latter are given an extra P in their names. For example, IPC-2P is the precursor that is formed after the D and O steps (Figure 1); after the reassembly step this will form the fully connected zeolite IPC-2.
Precursors formed before final reassembly step
Calcined final zeolite
IZA Code for final zeolite
Structure between silicate layers of calcined zeolite
IPC-1P IPC-4 PCR Direct oxygen linkages
IPC-2P IPC-2 OKO Single-four-rings (s4r)
IPC-6P IPC-6 *PCS Alternate layers of direct oxygen linkages and s4r
MATERIALS
As far as meaningful, please check that you have inserted relevant suppliers and catalog numbers. REAGENTS
CAUTION Hydrochloric acid used in the hydrolysis is corrosive. Consult the material safety data sheets for each item. All suitable personal protection equipment (PPE) should be worn: safety glasses, appropriate gloves and laboratory coat. All experimental work should be carried out in a fume hood.
Hydrochloric acid; 12, 6, 1.5, 0.1 M (Fisher, 37%, LOT: 1713904, Code: H/1200/PB17)
De-ionised water
Ge-UTL (see refs. 3 + 19)
EQUIPMENT
Three-necked round-bottom flask, 250 mL
Weighing balance (Sartorius)
Water condenser
Stirrer bar
Glass pipettes
Watch glass (x 5)
Thermometer
Powder funnel
Glass funnel
Ceramic Buchner funnel
Buchner flask, 100 mL
Filter seal vac-ring, neoprene rubber
Filter paper
Glass vials
Measuring cylinder
Drying oven
Weighing paper
Mortar and pestle
Borosilicate capillaries, 0.5 mm
Forceps
Spatula
Carbolite 2416 Tube Furnace for calcination
STOE STADIP operated in capillary Debye-Scherrer mode, operating Cu Kα1 radiation
Bruker Avance III spectrometer, equipped with a 9.4 T wide-bore superconducting magnet (solid-state NMR spectroscopy)
Jeol JEM 2011 (HRTEM)
PROCEDURE
Preparation of parent zeolite (using Ge-UTL as an example) TIMING 12 days
NOTE Any suitable parent zeolite can be substituted for Ge-UTL. Synthetic procedures from previous literature can be used for known zeolites.
1. Prepare parent Ge-UTL with molar composition 0.8 SiO2: 0.4 GeO2: 0.4 ROH: 30 H2O according to well-known literature procedure.3,26
TROUBLESHOOTING
ramp (downhill) of 2 °C min–1 until room temperature is reached. To prevent accidental disassembly by moisture in the air the sample can be stored in. a desiccator to keep it dry.
<PAUSE POINT> The sample can be stored in a desiccator for up to….xxx days?
TROUBLESHOOTING
Set-up of hydrolysis apparatus
TIMING 1 hr
3. Equip the three-necked round-bottom flask with the condenser and attach to the water.
4. Place the three-necked round-bottom flask in heating mantle with stirrer bar.
5. Add 120 mL water into the three-necked flask. Heat the water to 100 °C and stir at a speed of 600 rpm.
CRITICAL to ensure that the liquid in the experiment remains at the required temperature the heating mantle may need to be set at a higher temperature. Check that the temperature of the liquid is at 100 °C throughout the experiment.
6. Set up the filtration apparatus by way of Buchner flask, funnel and ring. Attach the flask to the water vacuum pump.
7. Prepare pipettes, pipette teats, glass vials, and capillaries for each aliquot taken (ca. 30). Name each vial by the time the sample is taken.
CRITICAL STEP Prepare all of this glassware before moving on to step 8, because….
8. Weigh out 600 mg of Ge-UTL and grind to a fine powder in the pestle and mortar. The crystallite
size at the end of this process is, on average, about 10 m 10 m 3 m as measured by
scanning electron microscopy.
Hydrolysis procedure
TIMING 8hr
9. Add the ground Ge-UTL to the three-necked round-bottom flask with stirring and start the timer.
11.Repeat step 10 every 1 min up to the 5 min mark.
12.After the 5 min mark continue to take samples every 5 min up to 1 hr. Filter each sample taken for 4 min and dry at 80 °C for 5 min.
TROUBLESHOOTING
13.After 1 hr, continue to take samples every 30 min up to 8 hr (or when the reaction has come to completion). Filter each sample for 5 min and dry in the drying oven at 80 °C for 5 min.
14.Follow steps 10 – 13. After each subsequent drying of a sample, remove from the oven and grind in
mortar and pestle until fine.
15.Pack the hydrolysed material in 0.5 mm borosilicate capillaries until half full.
PAUSE POINT Vials containing the capillaries can be sealed with a screw cap and placed in a vacuum desiccator for up to 2 weeks.
TROUBLESHOOTING
General procedure for zeolite characterisation
16.We have included procedures for collecting PXRD (option A), solid-state NMR spectroscopy (option B) and TEM (option C). Procedures include the characterisation of PXRD (option D).
(A) Procedure for collecting PXRD data TIMING 1
hr per sample
(i) Pack the hydrolysed material in a 0.5 mm capillary. Using forceps to vibrate the material down the capillary.
(ii) Collect PSRD data using a STOE STADIP powder X-ray diffractometer operated in
Debye-Scherrer mode, using a scintillation position-sensitive linear detector, operating CuKα1
radiation, place the capillary in the holder and centre into the middle of the beam using a
microscope. Scan the diffraction pattern for 55 min between 3° and 40° 2Θ with a step size
of 0.2°
(B) Procedure for preparing and collecting samples for solid-state NMR spectroscopy TIMING 24 hr per sample
(ii) Pack samples into 4 mm ZrO2 rotors and rotate at a MAS rate of 10 kHz. Weigh rotors before and after packing to determine the mass of zeolite used in the acquisition.
(iii) Using a radiofrequency (rf) field strength of ∼83 kHz, with a recycle interval of 120 s, collect magic angle spinning (MAS) spectra.
(iv) Determine the Q3:Q4 ratio using DMFit (or other suitable program),30 with errors estimated from multiple fits.
The commercial probe used does not display a 29Si background signal hence no correction has to be made to the absolute Q3:Q4 ratios plotted to reflect this.
(v) Show the chemical shifts relative to TMS (using secondary references of Q8M8
((OSi(OMe)3) = 11.5 ppm) for 29Si and L-alanine (C3H7NO2 ( (NH2) = 8.5 ppm) for 1H).
(C) Procedure for preparing and collecting samples for TEM TIMING 1 hr per sample
(i) Grind the powder sample in mortar with pestle.
CAUTION Germanosilicates are extremely sensitive to the electron beam, care must be taken during the sample preparation and imaging. To avoid sorption of water, samples must be dried in an oven and stored in a vacuum desiccator.
(ii) Add acetone to ground powder, grind again to obtain a well dispersed suspension of zeolite crystals in acetone.
(iii) Using a pipette, place one drop of suspension on the copper/holey carbon TEM grid. (iv) Calibrate the microscope using standard gold film method.
(v) Image the samples of silicates using HRTEM method. Use minimum electron beam intensity due to instability of samples. Use spot size 3 and gun lens 3. In our lab, high-resolution transmission electron microscopy (HRTEM) is performed using a Jeol JEM-2011 electron microscope. If you are using this equipment, set the accelerating voltage of 200 kV.
<CRITICAL STEP> Make sure to spread the beam to reduce the intensity, keeping the beam intensity below 2 pA cm-2.
(vi) Recorde the HRTEM images. In our lab we use a 9 Gatan 794 CCD camera. Calibrate the camera length, sample position and magnification using standard gold film methods.
(D) Procedure for analysing PXRD data
(i) Locate the 200 reflection in the PXRD pattern and measure its position as accurately as possible (this is usually best achieved using the fitting program that comes as part of the standard diffractometer software, but could be performed using other software packages equally successfully). The 200 reflection is normally the most intense peak in the pattern, but this can be confirmed by calculating the positions of the reflections using the expected unit cells.
CRITICAL STEP The 200 peak is chosen here, because it corresponds to the interlayer spacing for UTL. For other parent zeolites, the orientation of the reported unit cell may mean that the interlayer distance is defined using a different reflection. The appropriate reflection must be chosen in this stage otherwise results may be incorrect.
CRITICAL STEP The 200 peak may be relatively wide during the hydrolysis step due to a mixture of interlayer connectivity in the material, which means the the measurement may be difficult and the error associated with measuring the position of such peaks should be taken into account.
(ii) Calculate d-spacing of the 200 peak using the Bragg equation (if your fitting software does not do this automatically for you). This gives the d200 peak in Å, and is a direct probe of the layer spacing in the material.
(iii) Plot d200 against time for all data sets. If the 200 reflection moves significantly during the process then this is an important indicator of whether the parent material is susceptible to the ADOR process. The movement of the peak gives an indication of the types of intermediate that are accessible under the conditions of study; this should be usedto monitor (a) the effect of temperature and (b) the effect of pH.
TIMING
Step 1-2: 12 days
Steps 3-8: 1 hr
Steps 9-11: 5 min
Step 12: 55 min
Step 13: 7 hr
TROUBLESHOOTING
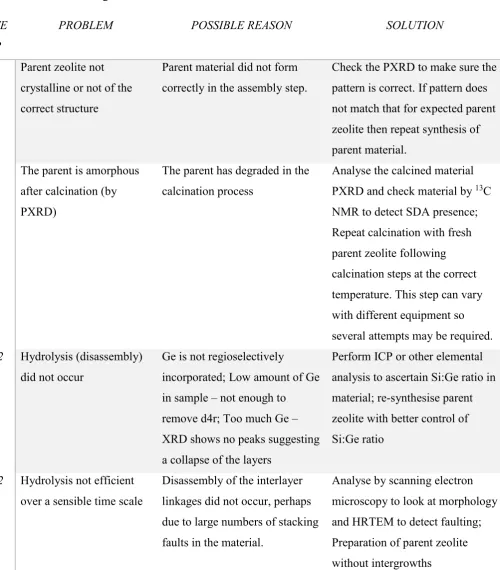
[image:12.595.51.552.188.759.2]Trouble shooting guidelines can be found in Table 3.
Table 3. Troubleshooting Table STE
P
PROBLEM POSSIBLE REASON SOLUTION
1 Parent zeolite not crystalline or not of the correct structure
Parent material did not form correctly in the assembly step.
Check the PXRD to make sure the pattern is correct. If pattern does not match that for expected parent zeolite then repeat synthesis of parent material.
2 The parent is amorphous after calcination (by PXRD)
The parent has degraded in the calcination process
Analyse the calcined material PXRD and check material by 13C NMR to detect SDA presence; Repeat calcination with fresh parent zeolite following calcination steps at the correct temperature. This step can vary with different equipment so several attempts may be required. 12 Hydrolysis (disassembly)
did not occur
Ge is not regioselectively
incorporated; Low amount of Ge in sample – not enough to remove d4r; Too much Ge – XRD shows no peaks suggesting a collapse of the layers
Perform ICP or other elemental analysis to ascertain Si:Ge ratio in material; re-synthesise parent zeolite with better control of Si:Ge ratio
12 Hydrolysis not efficient over a sensible time scale
Disassembly of the interlayer linkages did not occur, perhaps due to large numbers of stacking faults in the material.
15 No evidence of separate rearrangement steps in the reaction profile.
The D and O steps may be overlapping dependent on hydrolysis media used. The induction step has not occurred as the material has not fully hydrolysed before starting to rearrange; this could be a real effect dependent on the parent zeolite used
Take samples over a longer timeframe to determine whether rearrangement will occur or whether the layered material is the only daughter zeolite formed
ANTICIPATED RESULTS
Reaction in water at 100 ºC As described above, samples of the solid in the reaction are taken at regular intervals from the reaction and PXRD patterns measured for each sample. Figure 3 shows selected PXRD patterns, and the inset shows how the position of the 200 reflection varies with time during the reaction. The patterns chosen correspond to the three main intermediates in the ADOR process for Ge-UTL: 1P, IPC-2P and IPC-6P. Figure 4 shows a plot of the time dependency of the d-spacing of the 200 reflection for all the samples. The plot shows that the parent Ge-UTL zeolite (d200 = 14.48 Å) is quickly disassembled (hydrolysis and removal of the Ge-rich d4r units) leading to a contraction of the interlayer distance. After approximately 30 minutes the value of d200 levels off at 10.5 Å, which corresponds to the IPC-1P intermediate (Figure 1) where all the d4r units have been removed from between the layers. At first sight one might imagine that the reaction might have concluded at this time. However, the importance of following the procedure for a significant time is obvious as at longer times further changes occur. There is an induction period, during which IPC-1P is the only product identified in the reaction. After 120 minutes (under these conditions) the d200 value increases once again until it plateaus at a value of ~11.75 Å, which corresponds to IPC-2P (Figure 1), where some extra silicon has been incorporated back into the interlayer space through a reintercalation/reorganisation reaction. Following this protocol also allows one to identify the time at the mid-point in the reintercalation process. This is the intermediate IPC-6P, which is the material where half of the layers have undergone the intercalation and half have not. This is a very unusual structure that is fully described in reference 18.
The Avrami-Erofeev model22 can be employed to model the solid-state kinetics for the hydrolysis (D) and
rearrangement (O) steps. To do this the extent of reaction, α is plotted against time, and the
all temperatures to gain further insight in to the reaction kinetics; however, such analysis is beyond the scope of this protocol.
Solid-state NMR spectroscopy and TEM
The products of the hydrolysis and rearrangement steps for Ge-UTL at 100 ºC were further analysed by solid-state NMR spectroscopy and TEM. Samples were taken when major structural changes had taken place: 1 hr (IPC-1P), 4 & 8 hr (both IPC-2P). Using 29Si MAS NMR spectroscopy, the change in both Q4 (Si(OSi)4) and Q3 (Si(OSi)3(OH)) species can be monitored over time (Figure 6). The growth of the Q3 peak after 1 hr, suggests the formation of silanol (Si-OH) groups in the layered species, IPC-1P. After 1 hr the Q3 peak reduces in intensity as they rearrange to Q4 sites in accordance with Figure 1.
After an initial hydrolysis at 1 hr, the ratio of Q3:Q4 sites is 1:2.3, thus close to the ideal ratio of 1:2.5 for IPC-1P. The Q3:Q4 ratio continues to decrease as the rearrangement process occurs, leading to a ratio of 1:4.8 upon formation of IPC-2P at 4 hr (ideal IPC-2P Q3:Q4 = 1:7). Due to the relative difference between actual and ideal ratios, we can conclude that some silanol groups remain as defects throughout the material. TEM images for the two most important samples (1 hr, and 4 hr) highlighted by XRD were recorded. These materials are highly unstable during radiation. However, the TEM images highlight some loss of crystallinity from parent Ge-UTL over the course of 1 min (Fig. 7. ESI) and a clear drop in d spacing can be seen over the first hr (IPC-1P), before this increases again to form IPC-2P. The results corroborate those from the XRD data.
The Effect of Temperature
The hydrolysis and rearrangement mechanisms of Ge-UTL through the ADOR process were investigated over a period of 8 hr using water as the hydrolysis medium at six different temperatures (100, 92, 85, 81, 77 and 70 ºC). Figure 7 shows the change in d spacing with time for all these temperatures. The initial hydrolysis occurs rapidly over the course of 1 hr and several features can immediately be identified. First, it is clear that the initial Disassembly is fast under all conditions. Indeed, it is so fast that the errors associated in accurate measurement of the time are likely to be significant, and limit any quantitative conclusions that can be elucidated from the data for this process (at least using this protocol). Second, the duration of the induction period varies greatly with temperature; as the temperature of the reaction is lowered the induction period increases in length. Third, the rate of the reintercalation/reorganisation step increases with temperature. Clearly, there is the possibly of quantifying reaction rates and apparent activation energies using these data, but this is beyond the scope of this protocol paper. However, the data does give excellent qualitative information that helps to show which particular set of conditions might be the optimum for the preparation of the desired product, IPC-1P, IPC-6P or IPC-2P.
The hydrolysis and rearrangement mechanisms of Ge-UTL were further investigated by varying the concentration of hydrochloric acid (6, 1.5 and 0.1 M). The temperature was kept constant at 20 ºC to ensure only the effect of acid strength was monitored (Figure 8).
The reactions undertaken in strong acid (6 M) were rapid, with both the hydrolysis and rearrangement occurring almost simultaneously. In other words, the induction period is reduced to zero and the disassembly never has time to complete before rearrangement occurs and only IPC-2P is formed under these conditions. In 1.5 and 0.1 M HCl, the reaction is much slower and a full hydrolysis to IPC-1P can be seen, much more similar to that seen in water.
Extension of the protocol to other parent zeolites and subsequent troubleshooting
The above protocol has been designed with UTL as the parent zeolite topology and will allow researchers to synthesise the previously prepared materials listed above. However, perhaps the most important aspect of the protocol is the framework it provides for the testing of potential new parent zeolites. When a researcher has a parent material with the structural features that may make it appropriate as a starting point for the ADOR process, following the above protocol will provide solid evidence for whether the material is suitable or not. In the ideal circumstance one would know the crystal structure of any parent before embarking on a study using this protocol. However, even if one does not yet know the detailed structure, noting that a major PXRD diffraction peak changes position during the protocol may well indicate that the parent has promise and may provide helpful clues as to the possible structure of the parent.
Substituting a new parent zeolite for the UTL in the protocol is the simplest approach, but there are clearly potential pitfalls to this and the process is unlikely to work in exactly the same manner for all parent zeolites. Nevertheless, by examining how the protocol differs can provide valuable information on the parent zeolite as well as any ADOR intermediates that may be formed. There are a few steps where we anticipate that some troubleshooting intervention or optimisation would be required in order to get meaningful results.
If the disassembly step appears to work successfully, tit might still be necessary to consider optimising the reaction conditions. At low acidity, all the interlayer species are removed from UTL but after an induction period atomic species are reintroduced between the layers (Figure 7), the length of the induction period depending on the conditions. However, at high acidity the removal of the species from between the layers may never be fully completed (Figure 8) before rearrangement leads to the formation of a stable precursor, usually analogous to IPC-2P. In other words, under concentrated acid conditions the rearrangement process becomes so fast that the induction period becomes zero and full disassembly to the layered IPC-1P precursor does not have time to occur before the reorganisation to IPC-2P takes place. With different parents this type of behaviour may occur at different conditions and so researchers should really test a good sample of conditions to make sure they do not miss potential ADOR products.
A question often asked is about the universality of the ADOR process. In our experience to date, all germanosilicate zeolites that have the requisite compositional and structural features can be disassembled, organised and reassembled into new zeolites. In that sense the ADOR process is perfectly universal given the limitations on chemistry and topology described. However, the key is to identify the right conditions – and this is where this protocol will find its most enduring impact.
Acknowledgements
The authors would like to thank the EPSRC (grants: EP/K025112/1; EP/K005499/1; EP/K503162/1; EP/N509759/1) for funding opportunities. R.E.M., J.C. and M.M. would like to acknowledge OP VVV "Excellent Research Teams", project No. CZ.02.1.01/0.0/0.0/15_003/0000417 - CUCAM. S.E.A. would like to thank the Royal Society and the Wolfson Foundation for a merit award. J.C. acknowledges the Czech Science Foundation (P106/12/G015). We thank Oscar Morris for the animation of the process that is available as ESI.
Author Contributions S.E.H completed the development of the protocol and collected the synthesis data. M.M. completed the electron microscopy, C.M.R., G.P.M.B. and S.E.A. collected the solid-state NMR data. P.S.W., J.Č. and R.E.M. initiated the project. All authors have checked the protocol and contributed to the writing of the paper.
Competing Interests
There are no competing interests in this work.
Additional Information
All correspondance should be addressed to R.E.M.
Data Availability Data supporting this publication is available from the University of St Andrews
https://doi.org/10.17630/057e6e1d-cd0d-4f5c-b062-53a71f62d619 or from the corresponding author upon request.
FIGURES
Figure 1. A schematic diagram highlighting the four steps of the ADOR process. Initial d4r-containing parent zeolite UTL is broken down through hydrolysis, to make the layered intermediate IPC-1P. These layers are organised before the Si-O-Si bonds are reformed through calcination to form a reassembled material with a different structure from the original assembled parent. [I really like this figure. The only problem for me, is that I really struggle to read white text on any background colour. Could the boxes have coloured borders with black text on a white background inside?]
Figure 2. The experimental setup for the protocol. A three-neck round-bottom flask is fitted with a condenser and a thermometer (or thermocouple). The final neck is used to add the parent zeolite to the reaction mixture and to sample small amounts of product using a pipette. A Buchner funnel and flask is available for immediate filtration of the samples ready for PXRD and other characterisation methods.
Figure 3. Selected PXRD patterns collected at 1 hour, 2 hrs 30 min and 8 hours after the ADOR reaction has started (water as the hydrolysis medium, 100 °C). The inset shows how the position of the 200 reflection shifts with time. The colour coding is the same as that used in Figure 4.
samples whose full PXRD patterns are shown in Figure 3. The precision in the measurement of the PXRD d spacing is within the symbols on the diagram.
Figure 5. Extent of reaction, α, plotted against time. (a) Plot for the hydrolysis (D; left) and, (b) rearrangement (O; right) steps for the 100 ˚C reaction in water. Each plot was fitted with the Avrami-Erofeev model to find the Avrami exponent, n and the rate constant, k. In these examples, for the D step n = 0.36 and k = 1.36 min-1 and for the O step n = 3 and k = 0.0085 min-1.
Figure 6. 29Si (9.4 T, 10 kHz MAS) NMR spectra of calcined Ge-UTL parent zeolite, and subsequent hydrolysis after 1 hr, 4 hr and 8 hr. The change in intensity of Q4 (Si(OSi)4) and Q3 (Si(OSi)3(OH)) species is monitored over this time period.
Figure 7. Hydrolysis of Ge-UTL in water over a time period of 8 hr showing the d spacing, d200 for 100 °C (black), 92 °C (green), 85 °C (red), 81 °C (cyan), 77 °C (orange) and 70 °C (blue). After 1 hour at all temperatures Ge-UTL is hydrolysed to IPC-1P, which then rearranges to IPC-2P after an induction period that varies with temperature. The precision in the measurement of the PXRD d spacing is within the symbols on the diagram and highlighted by black error bars.
Figure 8. Hydrolysis (disassembly) of Ge-UTL over a time period of 8 hr showing the d200 spacing for reactions with 6 M (pink), 1.5 M (blue), and 0.1 M (green) hydrochloric acid at 20 °C. There is a significant difference between the reaction in 6 M HCl than for the others. This can be explained by understanding that increased acidity promotes the rate of the rearrangement reaction to such a degree that when 6M HCl is used the disassembly never reaches IPC-1P as the rearrangement to IPC-2P is complete before the dentercalation of all the d4r units from between the layers has finished. This indicates that pH can also be used to control the outcome of the ADOR process.
1. Sartbaeva, A. & Wells, S. A. Framework flexibility and rational design of new zeolites for catalysis. Appl. Petrochemical Res. 2, 69–72 (2012).
2. Martínez, C. & Corma, A. Inorganic molecular sieves: Preparation, modification and industrial application in catalytic processes. Coord. Chem. Rev. 255, 1558–1580 (2011).
3. Mazur, M. et al. Synthesis of ‘unfeasible’ zeolites. Nat. Chem. 8, 58–62 (2015).
4. Mazur, M., Chlubná-Eliášová, P., Roth, W. J. & Čejka, J. Intercalation chemistry of layered zeolite precursor IPC-1P. Catal. Today 227, 37–44 (2014).
5. Wheatley, P. S. et al. Zeolites with continuously tuneable porosity. Angew. Chemie - Int. Ed. 53, 13210–13214 (2014).
6. Roth, W. J. et al. Postsynthesis Transformation of Three-Dimensional Framework into a Lamellar Zeolite with Modifiable Architecture. J. Am. Chem. Soc. 133, 6130–6133 (2011).
7. Roth, W. J. et al. A family of zeolites with controlled pore size prepared using a top-down method. Nat. Chem. 5, 628–633 (2013).
8. Morris, R. E. & Čejka, J. Exploiting chemically selective weakness in solids as a route to new porous materials. Nat. Chem. 7, 381–388 (2015).
9. Eliášová, P. et al. The ADOR mechanism for the synthesis of new zeolites. Chem. Soc. Rev. 44, 7177–206 (2015).
10. Cundy, C. S. & Cox, P. A. The Hydrothermal Synthesis of Zeolites: History and Development from the Earliest Days to the Present Time. Chem. Rev. 103, 663–701 (2003).
11. Davis, M. E. & Lobo, R. F. Zeolite and Molecular Sieve Synthesis. Chem. Mater 4, 156–768 (1992).
12. Gutiérrez-Sevillano, J. J. et al. Critical Role of Dynamic Flexibility in Ge-Containing Zeolites: Impact on Diffusion. Chem. - A Eur. J. 22, 10036–10043 (2016).
13. Paillaud, J.-L., Harbuzaru, B., Patarin, J. & Bats, N. Extra-large-pore zeolites with two-dimensional channels formed by 14 and 12 rings. Science 304, 990–2 (2004).
14. Millini, R., Bellussi, G., Smeets, S., Xiaodong, Z. & Strohmaier, K. Zeolites in Catalysis Properties and Applications. RSC Catalysis Series 28, 4, (2017).
16. Johnson, G. M., Tripathi, A. & Parise, J. B. Novel Routes for the Preparation of a Range of Germanium Containing Zeolites. Chem. Mater. 11, 10–12 (1999).
17. Verheyen, E. et al. Design of zeolite by inverse sigma transformation. Nat. Mater. 11, 1059–1064 (2012).
18. Blasco, T. et al. Preferential location of Ge in the double four-membered ring units of ITQ-7 zolite. J. Phys. Chem. B 106, 2634–2642 (2002).
19. Shamzhy, M. et al. Germanosilicate Precursors of ADORable Zeolites Obtained by Disassembly of ITH, ITR, and IWR Zeolites. Chem. Mater. 26, 5789–5798 (2014).
20. Chlubná-Eliášová, P. et al. The Assembly-Disassembly-Organization-Reassembly Mechanism for 3D-2D-3D Transformation of Germanosilicate IWW Zeolite. Angew. Chemie 126, 7168–7172 (2014).
21. Kasneryk, V. et al. Consecutive interlayer disassembly–reassembly during alumination of UOV zeolites: insight into the mechanism. J. Mater. Chem. A 5, 22576–22587 (2017).
22. Kasneryk, V. et al. Expansion of the ADOR Strategy for the Synthesis of Zeolites: The Synthesis of IPC-12 from Zeolite UOV. Angew. Chemie Int. Ed. 56, 4324–4327 (2017).
23. Firth, D. S. et al. Assembly-Disassembly-Organization-Reassembly Synthesis of Zeolites Based on cfi-Type Layers. Chem. Mater. 29, 5605–5611 (2017).
24. Morris, S. A. et al. Combined PDF and Rietveld studies of ADORable zeolites and the disordered intermediate IPC-1P. Dalton Trans. 45, 14124–14130 (2016).
25. Morris, S. A. et al. In situ solid-state NMR and XRD studies of the ADOR process and the unusual structure of zeolite IPC-6. Nat. Chem. 9, 1–7 (2017)
26. Henkelis, S. E. et al. Monitoring the assembly–disassembly–organisation–reassembly process of germanosilicate UTL through in situ pair distribution function analysis. J. Mater. Chem. A (2018). doi:10.1039/C8TA04320E
27. Bignami, G. P. M. et al. Synthesis, Isotopic Enrichment, and Solid-State NMR Characterization of Zeolites Derived from the Assembly, Disassembly, Organization, Reassembly Process. J. Am. Chem. Soc. 139, 5140–5148 (2017).
28. Paillaud, J.-L., Harbuzaru, B., Patarin, J. & Bats, N. Extra-large-pore zeolites with two-dimensional channels formed by 14 and 12 rings. Science 304, 990–2 (2004).
channels, and its catalytic implications. Chem. Commun. 0, 1356–1357 (2004).