University of Pennsylvania
ScholarlyCommons
Publicly Accessible Penn Dissertations
Summer 8-13-2010
Morphology of Ion-Containing Polymers:
Correlations Between Structure, Dynamics, and
Ion Conduction
Wenqin Wang
University of Pennsylvania, [email protected]
Follow this and additional works at:http://repository.upenn.edu/edissertations
Part of thePolymer and Organic Materials Commons, and thePolymer Chemistry Commons
This paper is posted at ScholarlyCommons.http://repository.upenn.edu/edissertations/231 Recommended Citation
Wang, Wenqin, "Morphology of Ion-Containing Polymers: Correlations Between Structure, Dynamics, and Ion Conduction" (2010). Publicly Accessible Penn Dissertations. 231.
Morphology of Ion-Containing Polymers: Correlations Between
Structure, Dynamics, and Ion Conduction
Abstract
Ion-containing polymers are of intense interest for applications in energy storage and conversion devices. The conductivities of these polymers are determined by both the ion mobility and the total number of mobile charge carriers, which in turn depend on the chemical structure and morphology. To rationally design ion-containing polymers with high conductivity, a comprehensive understanding of their multi-scale structure is essential.
The morphologies of several ion-containing polymers have been explored as a function of material chemistry and external stimuli by X-ray scattering, scanning transmission electron microscopy, and various types of spectroscopy. The fundamental structure-property relationships in ion-containing polymers are discussed. Two classes of ion-containing polymers with very different aggregation behaviors have been studied. The first class is the polystyrene-based ionomers, where there are unfavorable interactions between the polymer matrix and ionic groups. The ionic functional groups in these hydrocarbon-based ionomers self-assemble into ionic aggregates, due to the strong electrostatic interactions in the low dielectric constant matrix and the lack of any solvation interactions between ions and hydrocarbons. The effects of acid content, neutralization level, and cation type on the size, number density, and composition of ionic aggregates were explored. The
morphological findings provide a framework for interpreting the dielectric relaxation behaviors of the same ionomers, so as to establish correlations between structure and dynamics.
The second class is poly(alkyl oxide)-based ionomers. The ionic groups have favorable interactions with the polymer matrix in poly(ethylene oxide) (PEO)-based polyester ionomers or urethane groups in
poly(tetramethylene oxide)-based polyurethane ionomers. The states of ions are highly dependent on the PEO length, cation size and temperature in PEO-based ionomers. Decreasing cation size from Cs to Li results in a transition of ionic states from isolated ion pairs to aggregated ion pairs. As the temperature increases, these ionomers exhibit greater microphase separation of the ionic groups due to the decreased ability of PEO to solvate the ions. These findings combine to greatly advance our understanding of the interplay between morphology and ion conduction in single-ion conductors.
Degree Type Dissertation
Degree Name
Doctor of Philosophy (PhD)
Graduate Group
Materials Science & Engineering
Keywords
Ion-Containing Polymers, Morphology, X-ray Scattering, Structure-Property Relationship, Polystyrene-based Ionomers, Poly(ethylene oxide)
Subject Categories
MORPHOLOGY OF ION-CONTAINING POLYMERS:
CORRELATIONS BETWEEN STRUCTURE, DYNAMICS,
AND ION CONDUCTION
Wenqin Wang
A DISSERTATION
in
MATERIALS SCIENCE AND ENGINEERING
Presented to the Faculties of the University of Pennsylvania
in Partial Fulfillment of the Requirement for the Degree of Doctor of Philosophy
2010
Supervisor of Dissertation
Karen I. Winey, Professor, Materials Science and Engineering
Graduate Group Chairperson
Russell J. Composto, Professor, Materials Science and Engineering
Dissertation Committee
Ralph H. Colby, Professor, Materials Science and Engineering
MORPHOLOGY OF ION-CONTAINING POLYMERS:
CORRELATIONS BETWEEN STRUCTURE, DYNAMICS,
AND ION CONDUCTION
COPYRIGHT
2010
Acknowledgements
First, I would like to thank my advisor, Professor Karen I. Winey, for all the
guidance and support during my Ph.D. career. Throughout the years, Karen has greatly
broadened my scope on research and trained me to be a better scientist in many different
aspects. I especially appreciate her encouragement for collaboration and inspiring me to
be a successful team player. Moreover, Karen has patiently shaped me into a much better
communicator, in both writing and presentation.
I would also like to thank my thesis committee, Professor Ralph H. Colby,
Professor Russell J. Composto, and Professor Paul Heiney for their critical review of my
research proposal and progress report, detailed guidance, and valuable comments. I
especially appreciate Professor Colby’s thought provoking discussions and suggestions.
Professor Composto has given extremely helpful guidance on both writing and science.
Professor Heiney trained me on the X-ray scattering, one of the main tools for my thesis
work, and shared me his expertise in this area. I would also like to thank Professor
Cherie Kagen for serving as my committee member during my research proposal. I thank
Professor Shu Yang for sharing many instruments in her lab, including vacuum line,
FTIR spectrometer, and GPC.
I am grateful for the opportunities to collaborate with many wonderful professors,
postdocs, and students from different universities. I would like to thank Professor
Shulamith Schlick and Andrew J. Perkowski from University of Detroit Mercy for their
expertise in electron spin resonance spectroscopy (NSF project), Professor Timothy E.
ion-containing polymers (MURI project), Professor Joe Eladb, Dr. Hong Chen, Dr.
YueSheng Ye, and Liang Gwee from Drexel University for help with ion conductivity
and aqueous GPC measurements. I especially would like to thank many collaborators
and friends from the Pennsylvania State University, including Professor Colby, again,
Professor Janna K. Maranas, Professor Karl T. Mueller, Professor James Runt, Dr.
Shichen Dou, Wenjuan Liu, Gregory Tudryn, Dan King, Alicia Castagna, Kan-Ju Lin,
Kokonad Sinha, David Roach, Amanda McDermott, Shih-Wa Wang, U Hyeok Choi, and
etc. for their excellent collaborations on the DOE project and many other scientific
discussions.
I would like to give special thanks to the staffs at Penn for always being so
friendly and helpful. I would like to thank Irene Clements, Vicky Lee, Pat Overend,
Reymond Shao, and Fred Helmig for their assistance with all kinds of requests I brought
up. I would like to thank Dr. Douglas Yates for his expertise in electron microscopy
techniques and training me on the STEM, Dr. Lolita Rotkina for training me on the SEM,
and Steve Szewczyk for the training on DSC.
Furthermore, I was lucky enough to be surrounded and helped by many friends at
Penn. First, I would like to thank my labmates Dr. Nicholas Benetatos, Dr. Nancy Zhou,
and Dr. Chris Chan for introducing me to ionomers and teaching me many different
experimental techniques, Dr. Minfang Mu for sharing both fun and pains in our daily
work, Dr. Sadie White for the helpful suggestions and encouragements on research and
great baking recipes, Tsung-Ta Chan for the collaboration on the dynamic mechanical
analysis, Dr. Michelle Seitz for lots of excellent scientific and writing suggestions, David
O’Reilly for the good scientific discussions and making our current office full of fun, and
Matt Bramson for all the hard work on the sulfonate polystyrene project. Second, I thank
Dr. Chen Xu, Dr. Maria McConnell, Dr. Ying Zhang, Dr. Jamie Ford, Dr. Yongan Xu, Dr.
Liang Qi, Dr. Yu Liu, Dr. Jay Park, Xuelian Zhu, Jun Chen, Sangah Gam, Mike Hore,
Chris Rodd, Wei Liu, Zheng Liu, Jie Li, and many others in MSE department for the
friendship and generous help. I especially would like to thank Dr. Mihai Peterca for
training me on the Linkam oven for X-ray scattering. Finally, I would like to thank many
other good friends, including Tingting Sha, Gang Song, Yi Feng, Qian Liu, Mengmeng
Liu, Zhuowei Bao, Ye Xing, and etc. for making my Ph.D. life at Penn so colorful.
Last but also the most importantly, I would like to thank my family. My parents
have implanted in me the passion for knowledge since childhood. I am grateful for their
endless love and continuous support in my career pursuit for so many years. I thank my
brother, Changbo Wang, for always being there for me whenever I need help. I
especially thank Qihui Ken Zhu, a very special person in my life, for inspiring me with
his dedication, pursuance, and passion for both work and life. This thesis is dedicated to
ABSTRACT
MORPHOLOGY OF ION-CONTAINING POLYMERS: CORRELATIONS
BETWEEN STRUCTURE, DYNAMICS, AND ION CONDUCTION
Wenqin Wang
Supervisor: Karen I. Winey
Ion-containing polymers are of intense interest for applications in energy storage
and conversion devices. The conductivities of these polymers are determined by both the
ion mobility and the total number of mobile charge carriers, which in turn depend on the
chemical structure and morphology. To rationally design ion-containing polymers with
high conductivity, a comprehensive understanding of their multi-scale structure is
essential.
The morphologies of several ion-containing polymers have been explored as a
function of material chemistry and external stimuli by X-ray scattering, scanning
transmission electron microscopy, and various types of spectroscopy. The fundamental
structure-property relationships in ion-containing polymers are discussed. Two classes of
ion-containing polymers with very different aggregation behaviors have been studied.
The first class is the polystyrene-based ionomers, where there are unfavorable
interactions between the polymer matrix and ionic groups. The ionic functional groups in
these hydrocarbon-based ionomers self-assemble into ionic aggregates, due to the strong
electrostatic interactions in the low dielectric constant matrix and the lack of any
solvation interactions between ions and hydrocarbons. The effects of acid content,
aggregates were explored. The morphological findings provide a framework for
interpreting the dielectric relaxation behaviors of the same ionomers, so as to establish
correlations between structure and dynamics.
The second class is poly(alkyl oxide)-based ionomers. The ionic groups have
favorable interactions with the polymer matrix in poly(ethylene oxide) (PEO)-based
polyester ionomers or urethane groups in poly(tetramethylene oxide)-based polyurethane
ionomers. The states of ions are highly dependent on the PEO length, cation size and
temperature in PEO-based ionomers. Decreasing cation size from Cs to Li results in a
transition of ionic states from isolated ion pairs to aggregated ion pairs. As the
temperature increases, these ionomers exhibit greater microphase separation of the ionic
groups due to the decreased ability of PEO to solvate the ions. These findings combine
to greatly advance our understanding of the interplay between morphology and ion
Table of Contents
Acknowledgements ... iii
Abstract... vi
Table of Contents ... viii
List of Schemes... xii
List of Tables ... xiii
List of Figures... xv
1. Introduction... 1
1.1 Background of Ionomer Morphology ... 1
1.2 Quantitative Reconciliation of HAADF STEM and X-ray Scattering Data... 5
1.3 Ion-Conducting Polymers for Rechargeable Batteries ... 11
1.4 Outline and Contribution ... 13
1.5 References... 17
2. Local Structure and Composition of the Ionic Aggregates in Cu(II)-neutralized Poly (styrene-co-methacrylic acid) Ionomers... 22
2.1 Introduction... 22
2.2 Experimental Section... 24
2.2.1 Materials and Sample Preparation ... 24
2.2.2 X-ray Scattering... 25
2.2.3 Scanning Transmission Electron Microscopy (STEM) ... 26
2.2.4 Electron Spin Resonance (ESR) ... 26
2.3 Results and Discussion ... 27
2.3.2 Local Ionomer Morphology... 34
2.4 Conclusion ... 40
2.5 References... 41
3. Morphology of Sulfonated Polystyrene Ionomers: Correlation of Structure with Dynamics... 44
3.1 Introduction... 44
3.2 Experimental Section... 46
3.2.1 Materials and Sample Preparation ... 46
3.2.2 Thermal Analysis ... 48
3.2.3 Fourier Transform Infrared Spectroscopy (FTIR) ... 48
3.2.4 X-ray Scattering... 50
3.2.5 Scanning Transmission Electron Microscopy (STEM) ... 50
3.2.6 Broadband Dielectric Relaxation Spectroscopy (DRS)... 51
3.3 Results and Discussion ... 51
3.3.1 Structure and Dynamics of SPS Acid Copolymers... 51
3.3.2 Structure and Dynamics of Zn-neutralized SPS Ionomers ... 59
3.4 Conclusion ... 74
3.5 References... 75
4. Multi-Length Scale Morphology of Poly(ethylene oxide)-Based Sulfonate Ionomers with Alkali Cations at Room Temperature ... 78
4.1 Introduction... 78
4.2 Experimental Section... 80
4.2.2 Thermal Analysis ... 81
4.2.3 X-ray Scattering... 81
4.2.4 Ab Initio Calculations ... 83
4.3 Results and Discussion ... 83
4.4 Conclusion ... 99
4.5 References... 101
5. Thermally Reversible Formation of Ionic Aggregates in Poly(Ethylene Oxide)-Based Sulfonate Ionomers... 105
5.1 Introduction... 105
5.2 Experimental Section... 109
5.2.1 Materials ... 109
5.2.2 X-ray Scattering... 110
5.3 Results and Discussion ... 112
5.4 Conclusion ... 124
5.5 Reference ... 125
6. Morphology of Segmented Poly(tetramethylene oxide)-Based Polyurethanes Containing Phosphonium Salts... 129
6.1 Introduction... 129
6.2 Experimental... 131
6.2.1 Synthesis ... 131
6.2.2 Molecular Structure Characterization... 133
6.2.3 Thermal and Mechanical Analysis... 133
6.3 Results and Discussion ... 135
6.3.1 Synthesis ... 135
6.3.2 Thermal Properties... 136
6.3.3 Dynamic Mechanical Behavior... 138
6.3.4 Morphology... 139
6.3.5 Tensile Properties... 148
6.4 Conclusion ... 150
6.5 References... 152
7. Conclusions and Future Work... 157
7.1 Conclusions... 157
7.2 Future Work ... 161
7.1.1 Size and Shape of Ionic Aggregates in PEO-based Ionomers ... 161
7.1.2 Origin of Dielectric Relaxations in Ionomers... 162
7.1.3 Effect of Water Content on the Morphology of Ionomers... 164
7.3 References... 166
Appendix A: Supporting Information for Chapter 2 ... 168
Appendix B: Supporting Information for Chapter 3 ... 169
Appendix C: Supporting Information for Chapter 5 ... 172
List of Schemes
Scheme 3.1 Sulfonated polystyrene ionomers with different sulfonation levels (x = 0.035,
0.067, 0.095) and neutralized to different levels (y = 0, 25%, 50%, 75%, and 100%) with
a metal cation (M =Na, Cs, or Zn)... 46
Scheme 4.1 PEO-based sulfonated polyester ionomers with well-defined PEO spacer (Mn
= 400, 600, 1100, 3300 g/mol, and m = 9, 13, 25, 75). M represents the cation (M = Li,
Na, or Cs) associated with the sulfonate group... 80
Scheme 5.1 PEOx-yM ionomers with well-defined PEO spacer (x = 400, 600, 1100 g/mol,
and m = 9, 13, 25). M represents the cation (M = Li, Na, or Cs) associated with the
sulfonate group and y represents percent of randomly charged phthalates (0, 17%, 49%
and 100%). ... 109
Scheme 6.1 Synthesis of phosphonium-containing polyurethanes (PTMO-HMDI-P+).136
List of Tables
Table 1.1 Materials, Preparation Methods, and Morphologies Observed in STEM Studies
of Ion-Containing Polymers... 4
Table 2.1 Diameters of ionic aggregates obtained from STEM imaging and X-ray
scattering... 28
Table 2.2 Magnetic parameters for the Cu(II) complexes detected by ESR in the STEM
ionomers... 36
Table 3.1 Sulfonation levels determined by elementary analysis and Glass transition
temperatures (Tg) determined by DSC for all the materials studied... 49
Table 3.2 VFT Fitting Parameters and Glass Transition Temperatures for PS and SPS
acid copolymers. ... 59
Table 3.3 Diameters of ionic aggregates obtained from STEM imaging and X-ray
scattering... 63
Table 4.1 Number average molecular weights (Mn) determined by 1H NMR, and glass
transition temperature (Tg), melting temperature (Tm), and percent crystallinity
Table 4.2 Observed crystalline peaks in PEG oligomers and PEO-based ionomers in
Figure 4.1 and the corresponding PEO crystal reflections a... 86
Table 4.3 PEO crystallite thickness (t) and lamellar spacing (L) from calculation and
X-ray scattering experiment... 89
Table 4.4 Ab initio calculations of interatomic spacings at 0 K in vacuum for
benzenesulfonate with alkali cations (M = Li+, Na+, K+ or Cs+). ... 97
Table D.1 Ionene ditertiary amine monomer: dihalide monomer molar ratios and
List of Figures
Figure 1.1 (a) HAADF STEM image of P(S-MAA)-Cu shows a dense, uniform
distribution of Cu-rich features. (b) Scattering intensity as a function of scattering vector,
q, for P(S-MAA)-Cu along with the best-fit model (solid). The model includes the
Yarusso-Cooper model for interparticle scattering from spherical ionic aggregates (grey),
two Lorentzian functions (dotted), and an additive constant. (Modified from reference 39).
... 7
Figure 1.2 (a) 3-D real-space volume (25 x 25 x 25 nm3) randomly populated with hard
spheres (R1 = 0.5 nm, RCA= 0.75 nm, and Vp= 5 nm3/particle). (b) 2D projection (c)
Values of N3D/N2D (●) as a function of thickness and line of best fit (dotted) plotted on a
logarithmic scale. Linear slope (m=0.09) indicates a power law relationship between
N3D/N2D and the specimen thickness for the specific parameters of this simulation.
(Modified from reference 40) ... 9
Figure 2.1 HAADF STEM image of SMAA0.133-50Cu shows a uniform distribution of
spherical ionic aggregates. ... 28
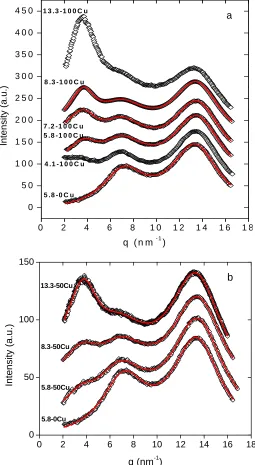
Figure 2.2 X-ray scattering intensity (a.u.) as a function of q with background scattering
subtracted for different acid contents (4.1-13.3 mol%) neutralized with Cu(II) acetate
along with the best-fit multi-function model given in Eqn (1) (solid line): a) 100%
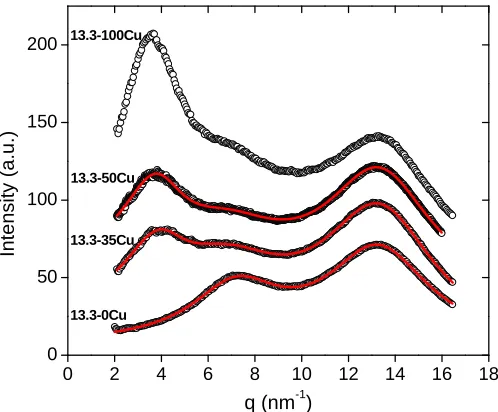
Figure 2.3 X-ray scattering intensity (a.u.) as a function of q with background scattering
subtracted for SMAA0.133 neutralized with Cu(II) acetate to different levels (0-100%)
along with the best-fit multi-function model given in Eqn (1) (solid line)... 31
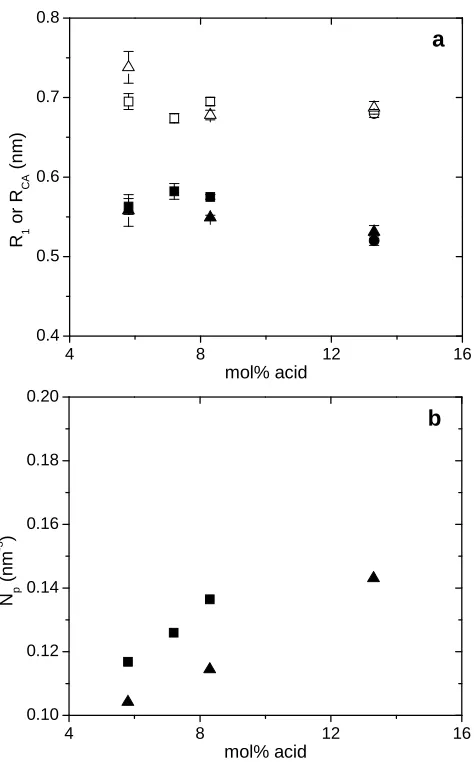
Figure 2.4 a) R1 (filled) and RCA (open) determined by X-ray scattering as a function of
acid content for different levels of neutralization with Cu(II) acetate: □,■ 100%; ∆,▲
50%; ○,● 35%. The error bar represents the error of the fitting parameter generated by
a least-square fit. b) The number density of the ionic aggregate (Np) as a function of acid
content from X-ray scattering results: ■ 100% neutralization; ▲ 50% neutralization... 32
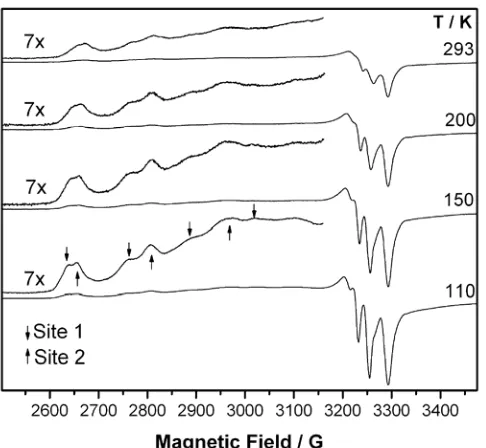
Figure 2.5 X-band ESR spectra of SMAA0.083-50Cu as a function of temperature.
Vertically expanded portions are shown for all spectra. Downward and upward arrows
indicate, respectively, the parallel hyperfine quartet for site 1 and site 2... 35
Figure 2.6 a) X-band ESR spectra at 110 K of SMAA-50Cu containing 5.8, 8.3, and 13.3
mol% acid. b) X-band ESR spectra at 110 K of SMAA0.058-50Cu after hot pressing.
Vertically expanded portions are shown for all spectra. Note the arrows (downward,
upward, and dotted) that indicate the positions of the parallel hyperfine signals for sites
1-3, and the improved resolution in the spectrum of the hot-pressed sample... 37
Figure 3.1 FTIR spectra of polystyrene (PS) and SPSx acid copolymers at sulfonation
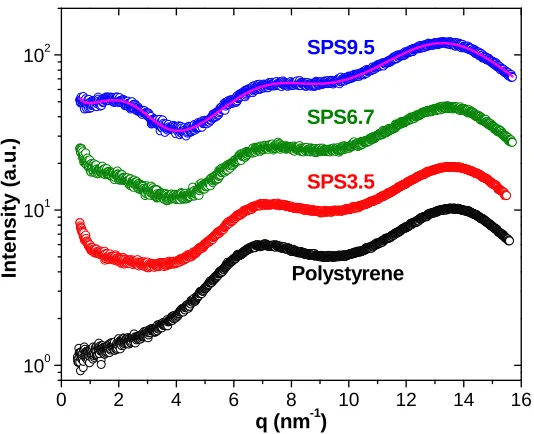
Figure 3.2 X-ray scattering intensity vs. scattering vector q for polystyrene and SPSx
acid copolymers at sulfonation levels: x% = 3.5%, 6.7%, 9.5%. The purple line is the
best fit of the scattering data from SPS9.5 using Eq. 3.1. The scattering data were
vertically shifted for clarity... 54
Figure 3.3 (a) dielectric loss and (b) derivation spectra at Tg + 50 oC for polystyrene and
SPS acid copolymers with different sulfonation levels. ... 56
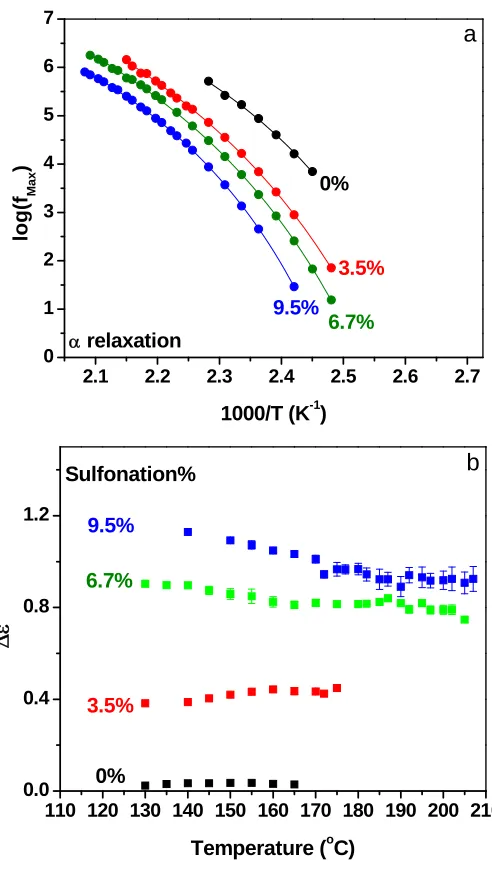
Figure 3.4 (a) relaxation frequency of the α process as a function of inverse temperature
and (b) dielectric strength as a function of temperature for poly polystyrene and SPS acid
copolymers with different sulfonation levels. Lines in (a) indicate fits of the VFT
equation (Eq. 3.7) to the data. ... 58
Figure 3.5 FTIR spectra of SPS9.5-yZn at different neutralization levels: 0%, 25%, 50%,
75%, and 100%. The spectra were vertically shifted for clarity... 60
Figure 3.6 HAADF STEM images of SPS6.66-100%Zn (top) and SPS9.45-100%Zn
(bottom) show a uniform distribution of spherical ionic aggregates. ... 61
Figure 3.7 X-ray scattering intensity vs. scattering vector q for a) SPS3.5-yZn; b)
SPS6.7-yZn; c) polystyrene and SPS9.5-yZn. The lines are the best fit of the scattering
Figure 3.8 a) R1 (■) and RCA (●) determined by X-ray scattering as a function of
neutralization level for SPSx-yZn. b) The number density of the ionic aggregate (Np) as
neutralization level for SPSx-yZn. ... 65
Figure 3.9 Occupancy rate determined by N(cation, Np)/N(cation, R1) as a function of
neutralization level for SPSx-yZn. ... 66
Figure 3.10 Schematic view of the morphological change with neutralization level for
SPS9.5-yZn. The blue circle represents aggregates of SO3H and Zn(SO3)2. The diameter
of the blue circle is 2R1, which is independent of neutralization level. As the
neutralization level increases, the blue color gets dark, representing increasing ionic
density inside the aggregates. The red corona represents the layer of hydrocarbon around
aggregates which defines the radius of closest approach, RCA. RCA increases with
increasing neutralization level. ... 68
Figure 3.11 Derivative spectra at Tg+65 oC for SPS9.5-100%M, M=H, Na, Cs, or Zn. . 69
Figure 3.12 (a) derivative loss, (b) relaxation strength of α process, (c) normalized
derivative loss (by ε"D max and fmax ), and (d) relaxation strength of α2 process for
Figure 3.13 Volume fraction of ionic aggregates (VA%), restricted region surrounding the
aggregates (VR%), and polystyrene matrix (1-VA%-VR%) as a function of neutralization
level for SPS9.5-yZn... 72
Figure 4.1 Comparison of crystal reflection peaks from semicrystalline PEO-based
ionomers and the PEG9900 oligomer at room temperature. The X-ray scattering peaks
labeled by letters correspond to crystalline PEO reflections; see details in Table 4.2. .... 85
Figure 4.2 X-ray scattering intensity as a function of scattering vector q from PEOx
-100%M ionomers with different PEO spacer lengths (x) and cations (M) at room
temperature. The scattering peaks labeled L and numbers (1,2,3) correspond to the
lamellar spacing (L) and the crystallite thickness (texpt), respectively; see Table 4.3. ... 88
Figure 4.3 Schematic of the semicrystalline morphology of PEO-based ionomers
showing crystalline lamellae-lamellae spacing (L) and well-defined crystallites of
thickness (t)... 90
Figure 4.4 X-ray scattering intensity as a function of scattering vector q plotted in
log-linear scale for PEG oligomers with different molecular weights at room temperature.
The numbers correspond to higher order scattering from the crystallite thickness (texpt),
Figure 4.5 a) Wide-angle X-ray scattering intensity at room temperature from
PEO600-100%M (M = Li, Na, Cs) and PEO600-0% normalized by sample thickness, collection
time, and percent of transmission. b) Difference intensity of PEO600-100%M after
subtracting scattering intensity of PEO600-0% from PEO600-100%M. ... 94
Figure 4.6 Simulation results for an ion pair and a quadrupole equilibrated at 0 K in
vacuum using ab initio calculations... 95
Figure 5.1 X-ray scattering data of PEO600-0% as a function of temperature. The
scattering data at higher temperatures were vertically shifted for clarity. The amorphous
peak shifts to lower angle as temperature is raised, due to the thermal expansion. The
identical patterns at 27 oC before (black, 25-I) and after (grey, 25-II) heating indicate the
changes in scattering are thermally reversible... 112
Figure 5.2 X-ray scattering data of PEO600-100%Li as a function of temperature. The
scattering data at higher temperatures were vertically shifted for clarity. The intensity of
the ionomer peak at q = 2-3 nm-1 increases with temperature. The identical patterns at
25oC before (black, 25-I) and after (grey, 25-II) heating indicate the morphology changes
are thermally reversible... 113
Figure 5.3 X-ray scattering data of PEO600-100%Na as a function of temperature. The
scattering data at higher temperatures were vertically shifted for clarity. An ionomer
peak gradually appears at q = 2-3 nm-1 as the temperature increases, indicating an
patterns at 25oC before (black, 25-I) and after (grey, 25-II) heating indicate the
morphology changes are thermally reversible. ... 115
Figure 5.4 X-ray scattering data of PEO600-100%Cs as a function of temperature. The
scattering data at higher temperatures were vertically shifted for clarity. An ionomer
peak gradually appears at q = 2-3 nm-1 as the temperature increases, suggesting
reorganization of ionic groups into ionic aggregates. The identical patterns at 25oC
before (black, 25-I) and after (grey, 25-II) heating indicate the morphology changes are
thermally reversible. ... 117
Figure 5.5 Correlation distance (d = 2π/q*) of ionomer peaks and amorphous peaks in
PEO600-100%M (M = Li, Na, and Cs) as a function of temperature. ... 118
Figure 5.6 a) X-ray scattering data of PEOx-100%Na (x = 400, 600, and 1100 g/mol) at
150 oC. The ionomer peak position (q ~ 2-3 nm-1) in PEOx-100%Na at 150oC shifts to
higher scattering wavevector as x decreases because the ion content increases. b) The
average inter-aggregate spacing (d) obtained from the ionomer peak position (d=2π/q*) at
150 oC in PEOx-100%M (M = Li: ●, Na: ■, and Cs: ▲) follows a power law
dependence on the ion content. The lines are the best fit of the data with the allometric
function. ... 120
Figure 5.7 X-ray scattering data of PEO600-17%Li (a) and PEO600-49%Na (b) as a
Figure 6.1 DSC traces for HMDI-P+ (dashed lines and arrows), and
PTMO-HMDI-BD (solid lines and arrows). Conditions: 5 °C/min, 2nd heat. ... 137
Figure 6.2 DMA curves demonstrating the transitions of the phosphonium-containing
(dashed line) and noncharged polyurethanes (solid line). Conditions: 3 °C/min, 1 Hz,
film tension mode. ... 139
Figure 6.3 X-ray scattering intensity vs. scattering vector (q) plotted in log-log scale for
unstretched PTMO oligomer and unstretched PTMO-based polyurethane films containing
different chain extenders... 140
Figure 6.4 a) HAADF STEM image of phosphonium polyurethane showed bright,
spherical ion-rich regions dispersed in the dark, hydrocarbon-rich matrix. b) Fitting the
intensity profile across an isolated ionic aggregate with a Gaussian function provided the
diameter of a STEM feature... 143
Figure 6.5 Spot EDS intensities taken from phosphonium polyurethane ultrathin films
during STEM imaging with a stationary 0.7 nm probe placed on bright and dark regions
in the specimen. The quantity of Br and P is greater in the bright ion-rich domains. ... 144
Figure 6.6 2-D X-ray scattering patterns of the stretched PTMO-HMDI-BD films at
600% strain (a) Wide-angle pattern shows two equatorial scattering peaks at angular
positions of 14 nm-1 and 17 nm-1 that correspond to PTMO crystallization. (b) Same
reflections at 6 nm-1 that correspond to intramolecular scattering from hard segment. (c)
Small-angle pattern shows meridional reflections at ~0.35 nm-1 that correspond to
interparticle scattering from microphase-separated hard domains. The blue arrow
indicates the stretching direction. (d) Chemical structure of the urethane segment in
PTMO-HMDI-BD... 146
Figure 6.7 FT-IR spectroscopy of NH (left) and C=O (right) region of PTMO-HMDI-BD
and PTMO-HMDI-P+... 148
Figure 6.8 Comparison of the stress-strain behavior of linear, segmented, ion-containing
polyurethane elastomer compared to the noncharged polyurethane: (A)
PTMO-HMDI-BD (B) PTMO-HMDI-P+... 149
Figure A.1 X-band ESR spectra of SMAA-100Cu as a function of temperature.
Vertically expanded portions are shown. The mol % acid is 4.1 (A), 5.8 (B). 8.3 (C), and
13.3 (D)... 168
Figure B.1 X-ray scattering intensity vs. scattering vector q of SPSx-yNa with different
sulfonation levels (x = 3.5%, 6.7%, and 9.5%): a) y = 50%; b) y = 100%. The scattering
data were vertically shifted for clarity. ... 169
Figure B.2 X-ray scattering intensity vs. scattering vector q of SPSx-yCs with different
sulfonation levels (x = 3.5%, 6.7%, and 9.5%): a) y = 50%; b) y = 100%. The scattering
Figure B.3 a) R1 and RCA determined by X-ray scattering as a function of sulfonation for
different cations: ○,● Na; Δ,▲ Cs at 50% (open symbols) and 100% (close symbols)
neutralization levels. b) The number density of the ionic aggregate (Np) as a function of
sulfonation... 171
Figure C.1 Ultra-small angle and small angle X-ray scattering data of PEO600-0% as a
function of temperature... 173
Figure C.2 Ultra-small angle and small angle X-ray scattering data of PEO600-100%Na
as a function of temperature. An ionomer peak (q ~ 3 nm-1) appears at 100 oC... 173
Figure C.3 a) X-ray scattering data of PEO400-100%Li as a function of temperature.
The intensity of the ionomer peak increases with temperature. b) The morphology is
thermally reversible, as shown by the identical scattering patterns before and after heating.
... 174
Figure C.4 a) X-ray scattering data of PEO1100-100%Li as a function of temperature.
The intensity of the ionomer peak increases with temperature. b) The morphology is
thermally reversible, as shown by the identical scattering patterns before and after heating.
While PEO1100-100%Li can be semicrystalline at room temperature, depending on the
thermal history, this sample is amorphous... 175
Figure C.5 a) X-ray scattering data of PEO400-100%Na as a function of temperature. An
of ionic groups into aggregates. b) The morphology is thermally reversible, as shown by
the identical scattering patterns before and after heating... 176
Figure C.6 a) X-ray scattering data of PEO1100-100%Na as a function of temperature.
An ionomer peak gradually appears as the temperature increases, suggesting
reorganization of ionic groups into ionic aggregates. b) The morphology is thermally
reversible, as shown by the identical scattering patterns before and after heating. While
PEO1100-100%Na can be semicrystalline at room temperature, depending on the thermal
history, this sample is amorphous... 177
Figure C.7 a) X-ray scattering data of PEO400-100%Cs as a function of temperature. An
ionomer peak gradually appears as the temperature increases, suggesting reorganization
of ionic groups into ionic aggregates. b) The morphology is thermally reversible, as
shown by the identical scattering patterns before and after heating. ... 178
Figure C.8 a) X-ray scattering data of PEO1100-100%Cs as a function of temperature.
The scattering data at higher temperatures are vertically shifted for clarity. An ionomer
peak gradually appears as the temperature increases, suggesting reorganization of ionic
groups into ionic aggregates. b) The morphology is thermally reversible, as shown by the
identical scattering patterns before and after heating. PEO1100-100%Cs can be
semicrystalline at room temperature, depending on the thermal history; this sample shows
Figure D.1 X-ray scattering profiles of the 1:1 12,12-ionene. a) Scattering intensity vs.
scattering vector q for stretched and unstretched 12,12-ammonium ionenes films; b)
Wide-angle X-ray scattering pattern of stretched ionene film; c) Wide-angle X-ray
Chapter 1
Introduction
1.1 Background of Ionomer Morphology
Ionomers are a unique class of copolymers containing a small fraction of ionic
functional groups, which are typically pendant to a hydrophobic polymer backbone.1 The
strong electrostatic interactions between the ionic groups in the low-dielectric matrix
drive the self-assembly of ionic groups into aggregates. These nanoscale aggregates act
as physical crosslinks to enable remarkable improvement in the chemical and physical
properties of ionomers relative to traditional homopolymers. As a result, ionomers have
found application in a variety of industrially important applications ranging from
chemical resistant coatings and high performance thermoplastics to selectively permeable
ion-transport membranes.
In order to realize rational design and engineering of ionomers for specific
applications, a comprehensive understanding of the multi-scale morphology is essential.
Various spectroscopic techniques, including Fourier transform infrared (FTIR),2-6 nuclear
magnetic resonance (NMR),7-9 electron spin resonance (ESR),10-12 and extended X-ray
absorption fine structure (EXAFS),13-17 have been employed to probe the structure of
ionomers on sub-nanometer length scales.18 While these studies have provided detailed
information regarding the local chemical environment, they cannot provide an adequate
description of the robust macroscopic properties. X-ray scattering is a powerful tool for
aggregates manifests itself in the appearance of a broad, isotropic scattering peak in the
angular region between 1-5 nm-1, which is typically accompanied by a small-angle
upturn.1, 23
Several models have been proposed that provide reasonable fitting and
interpretation of the scattering data.24-26 The most widely accepted scattering model is
the modified hard-sphere scattering model proposed by Yarusso and Cooper.26 This
model suggests that the ionomer peak arises from the interparticle scattering between
monodisperse, spherical ionic aggregates arranged with liquid-like order in the polymer
matrix of lower electron density. Ding et al.27 later proposed a modified version of
Yarusso-Cooper model, a.k.a. Kinning-Thomas model,28, 29 wherein the Percus-Yevick
total correlation function30 that accounts for correlations between all particles in the
system was incorporated into the structural factor instead of the Fournet three-body
interference function.31 While both models fit the ionomer peak equally well,
Percus-Yevick total correlation function was shown to be more suitable for systems of high
packing fraction.28 However, neither model interprets the low-angle intensity upturn,
which is attributed to larger scale inhomogeneities resulting from parasitic scattering due
to voids or un-reacted neutralizing agent.26
The modified hard-sphere scattering model has been used to interpret the ionomer
peak in a wide array of scattering data and has determined the sizes and spacing between
ionic aggregates for a variety of systems including poly(styrene-ran-methacrylic acid)
(SMAA) ionomers,32 sulfonated polystyrene (SPS) ionomers,26, 33 and
poly(ethylene-ran-methacrylic acid) (EMAA)) ionomers.33 The model has shown that the size of the ionic
diameter for the P(S-SS) ionomers. However, none of these studies employ a second
model-independent technique, such as direct imaging, to verify the validity of the model.
Our group has devoted significant effort toward imaging the nanoscale
morphology of ionomers by employing scanning transmission electron microscopy
(STEM). STEM provides the capability of high resolution imaging as well as chemical
and structural characterization of nanometer domains though evaluation of electron
energy loss spectra (EELS), X-ray spectra, and electron diffraction patterns.34 More
importantly, high angle annular dark field (HAADF) STEM imaging mode has the
advantage that the intensity is roughly proportional to the square of the atomic number, Z,
of the scattering atom, which greatly enhances contrast between the cation-rich ionic
aggregates and polymer matrix, and avoids chemical staining. HAADF STEM has been
applied to ionomers with different polymer backbone structures, acid types, cations types,
and sample preparation conditions.35-43 HAADF STEM images reveal that the
morphologies of ion-containing polymers on the nanoscale are much more complicated
than previously anticipated from a single, broad scattering peak, and are highly dependent
Table 1.1 Materials, Preparation Methods, and Morphologies Observed in STEM Studies
of Ion-Containing Polymers.
Material [ref] Neutralization Method Isolation Method Aggregate Shape Aggregate Size Spatial Distribution
Melt Extruded Spheres ~ 2 nm Uniform
EMAA-Zn35, 44
Melt Extruded and re-crystallized Spheres ~ 2 nm Uniform
75%, 100%,
125% in Solution Precipitated and molded
Spheres and Vesicles
Varied Uniform SPS-Zn36
25% in Solution Precipitated and molded Spheres 4-10 nm Heterogeneous
SMAA-Cs38 Solution Freeze dried
and molded Vesicles 5-20 nm Uniform
Solution Precipitated Spheres and Rods
~ 4 nm
~ 4 × 11 nm Uniform PDMS-Zn41
Solution
Precipitated and
annealed Spheres ~ 4 nm Uniform
Solution Precipitated Spheres and Bundles of Rods
~ 4 nm
~ 4 × 60-100 nm
Uniform
Uniform PDMS-Ba41
Solution Precipitated and annealed
Spheres and Bundles of Rods
~ 4 nm
~ 20-30 nm
Uniform
Uniform
Melt Extruded N/A N/A Featureless
EMAA-Na37
Melt Extruded and re-crystallized Spheres Varied
Multiple coexisting morpholgies Solution Solvent cast Spheres ~ 3 nm Uniform
Solution Precipitated, annealed, and molded
Spheres ~ 4 nm Uniform SMAA-Zn45
Melt Extruded and annealed Spheres ~ 3 nm Uniform Solution Solvent cast Spheres ~ 1 nm Uniform SMAA-Cu42, 46, 47
Solution Precipitated and molded Spheres Varied size and shape Heterogeneous SPS-Zn or Ba29 Solution Solvent cast Spheres ~ 1-2 nm Uniform
SPS-Zn, Ba, Cs,
or Cu29 Solution Spin coat Spheres ~ 1-2 nm Uniform
1.2 Quantitative Reconciliation of HAADF STEM and X-ray Scattering Data
The study of ionomers using STEM as a direct imaging method has revealed
diverse morphologies of ionomers, which cannot be explained by X-ray scattering data
alone. Using a combination of X-ray scattering and HAADF STEM to study the exact
same materials provides the potential to verify the applicability of X-ray scattering model
and to establish the domain over which the X-ray scattering model provides an accurate
description of the system. Using this powerful combination along with the real-space
image modeling, our group has achieved quantitative reconciliation of STEM and X-ray
scattering data in SMAA ionomers and SPS ionomers.29, 46, 47
The combination of STEM and X-ray scattering was first applied to monodisperse
gold nanoparticles (1-2 nm in diameter) supported on polystyrene films of varying
thickness (20-90 nm).49 The radius of gold nanoparticles was measured by fitting a
Gaussian function to the intensity profile across the feature in the STEM image. The
form-factor scattering model was used to interpret the X-ray scattering data from a dilute
solution of the exact same gold nanoparticles. The diameter determined from STEM
imaging and X-ray scattering are in excellent agreement, thereby demonstrating that
STEM methods can be used to provide quantitative information of nanoscale objects in
the presence of amorphous polymer.
Our group then applied these STEM methods to examine the nanoscale
morphology of SMAA0.072-Cu ionomers (7.2 mol% acid).46 The ionomers were prepared
by solution neutralization with copper acetate and followed by solvent casting and
vacuum drying. Figure 1.1a shows the HAADF STEM image of a SMAA0.072-Cu thin
of spherical bright features, corresponding to the Cu-rich ionic aggregates. The size of
these ionic aggregates was determined by the same method described previously for gold
nanoparticles. X-ray scattering intensity as a function of scattering vector (q) shows three
peaks within q =1.6-16 nm-1, corresponding to the “ionomer peak” (3.7 nm-1),
polystyrene “polymerization” (7 nm-1) and “amorphous” peaks (13 nm-1), respectively,
Figure 1.1b.46 With confidence in the presence of spherical ionic aggregates, the
scattering data were concurrently fit with Yarusso-Cooper model26 for the ionomer peak,
two Lorentzian functions for the polystyrene peaks, and a constant to account for
instrumental background scattering. There are four fitting parameters for the
Yarusso-Cooper model: the ionic aggregate radius R1, the radius of closest approach RCA that
limits the spatial correlation between two aggregates, the average sample volume per
aggregate Vp, and the peak amplitude A. Note that Vp is the inverse number density of the
ionic aggregates (Vp = 1/Np). The size of the ionic aggregates obtained from STEM and
b
10 nm
a
Figure 1.1 (a) HAADF STEM image of SMAA-Cu shows a dense, uniform distribution
of Cu-rich features. (b) Scattering intensity as a function of scattering vector, q, for
SMAA-Cu along with the best-fit model (solid). The model includes the Yarusso-Cooper
model for interparticle scattering from spherical ionic aggregates (grey), two Lorentzian
functions (dotted), and an additive constant. (Modified from reference 46).
However, the number density of the ionic aggregates (Np) obtained from X-ray
scattering data is much larger than that directly observed in the HAADF STEM image.47
The size of the ionic aggregates is on the order of 1 nm, whereas the typical thickness of
specimen for STEM imaging is between 50-100 nm, thus the extensive overlap in the 2D
projection of 3D specimen could significantly reduce the actual number of aggregates
shown in the STEM image. In order to obtain a better interpretation of the morphology
observed in the STEM image, 3D real-space structural models were constructed based on
the parameters from scattering data and subsequently used to simulate the 2D
projections.47 Figure 1.2a illustrates a 3-D real-space volume of 25 x 25 x 25 nm3
randomly populated with hard spheres (R1 = 0.5 nm, RCA = 0.75 nm, and Vp = 5
with intensities corresponding to numbers of aggregates overlapping (Figure 1.2b). The
regions of highest cumulative overlap are shown as brightest red and represent ≥ 8
overlapping spheres. The scale of intensity was adjusted to be as close to the
experimental HAADF STEM situation as possible. During STEM imaging, the
adjustment of brightness and contrast will typically accentuate the highest intensity
regions at the expense of lower intensity area. As a result, for a densely populated system,
the regions of highest cumulative overlap are preferentially imaged. The number density
of particles observed in the 2D projection (N2D) is only ~5% of that present in the 3D
real-space volume of 25 nm thick (N3D). However, it should be noted that despite
extensive overlap, the size and shape of the high-intensity regions remain nominally
consistent with that of isolated spheres. Thus the extensive overlapping has minor effect
on the size of ionic aggregates, further confirming that the size of ionic aggregates
observed in HAADF STEM image are indicative of the material.
The real-space depiction of the specific nanoscale morphology of SMAA0.072-Cu
ionomers and the corresponding projections suggest that overlap in the STEM image of
ionomers is significant.47 The ratio of N
3D/N2D was plotted as a function of thickness and
fitted with a power law. The relationship between the N3D and N2D for SMAA0.072-Cu
was subsequently applied to the STEM data including the thickness of specimen
measured by EELS and N2D counted from STEM image. It is found the number density
of ionic aggregates from STEM is perfectly consistent with that determined from X-ray
Thickne
ss (nm)
8.0 nm
4.0 nm
0 nm
Distance (nm)
dis
tance (nm)
Dist ance
(nm )
Distance (nm)
Log (thickness) (nm)
Log (
N
3D
/ N
2D
)
Figure 1.2 (a) 3-D real-space volume (25 x 25 x 25 nm3) randomly populated with hard
spheres (R1 = 0.5 nm, RCA= 0.75 nm, and Vp= 5 nm3/particle). (b) 2D projection (c)
Values of N3D/N2D (●) as a function of thickness and line of best fit (dotted) plotted on a
logarithmic scale. Linear slope (m=0.09) indicates a power law relationship between
N3D/N2D and the specimen thickness for the specific parameters of this simulation.
The quantitative consistency of both size and number density of ionic aggregates
obtained from STEM and X-ray scattering of SMAA0.072-Cu confirm that the modified
hard sphere model provides an excellent description of the nanoscale morphology for this
ionomer. This systematic study was further applied to solution neutralized SPS0.019
ionomers neutralized to 125% with a variety of cations (Zn, Ba, Cs, Cu, Na, Mg), and
successfully reconciled the STEM and X-ray scattering data.29
Having confidence in the liquid-like modified hard sphere scattering model for
SPS and SMAA ionomers prepared by solvent casting, the fitting parameters from the
model can be employed to obtain information about the composition of ionic aggregates.
The composition of the ionic aggregates can be inferred from the comparison of the
number of cations per aggregates (N(cation)) calculated from the X-ray scattering fitting
parameters using two different methods. In the first method (N(cation, R1)), the volume
of the ionic aggregates based on the R1 is divided by the volume of an ionic group by
assuming a certain ionic coordination structure and 100% ionic groups occupation in the
aggregates. The second method (N(cation, Np)) uses the average composition of the acid
copolymer to determine the number of cations within a volume of Vp (1/Np). This
calculation assumes that all the ionic groups are in the ionic aggregates, thus it provides
an upper limit for the number of the ionic groups possible in the aggregates. For SPS0.019
neutralized to 125% with metal cations, the two methods give comparable values, which
indicates that the ionic aggregates are composed mainly of ionic groups.29 In contrast, for
the SMAA0.072-100%Cu ionomers, N(cation, Np), is an order of magnitude smaller than
an ionic aggregate of size R1.29, 47 The result implies that the ionic aggregate contains
non-ionic species in addition to the ionic groups in SMAA0.072-Cu ionomers.
1.3 Ion-Conducting Polymers for Rechargeable Batteries
Due to the growing environmental concerns and the increasing worldwide
demand for energy, ion-conducting polymers are of greater interest for various
electrochemical energy storage and conversion devices, such as rechargeable batteries
and fuel cells. Since the discovery of the complexes of alkali metal salts with
polyethylene oxide (PEO) and the corresponding ionic conductivity,50-52 there has been
intense research on the structures and ion-conduction mechanisms of PEO-based polymer
electrolytes for rechargeable batteries. Each cation forms multiple coordination bonds
with the oxygen atoms in PEO, enabling effective dissolution of a variety of alkali and
alkaline-earth salts. Compared to solvent-based liquid systems or ceramic electrolytes,
polymer electrolytes have several advantages, including good mechanical properties,
improved chemical and thermal stability, and ease of processing.53 The ionic
conductivity is determined by the effective number of conducting ions, the magnitude of
elementary charge and the ion mobility.54 Ion mobility in amorphous polymer
electrolytes has been found to be strongly coupled with the segmental motion of polymer
chain, and the temperature dependence of ion mobility and conductivity are often
discussed on the basis of the “free-volume model”.54, 55 Depending on the electrostatic
interactions between the ionic groups and the dielectric constant of the polymer matrix,
ions are able to form different association states, including single ions, ion pairs, triple
concentration, the dissociation energy of ion pairs should be low and the dielectric
constant of the polymer matrix should be high.56 For example, replacing the
conventional anion with the non-coordinating anion, e.g. perfluorosulphonimide (TFSI),
improved the ionic conductivity by an order of magnitude.57 This is because the
extensive charge delocalization in TFSI greatly reduces the binding energy of TFSI with
cation.
Much of the research on polymer electrolytes has been focused on polymer/salt
mixtures, such as mixtures of PEO with LiTFSI. Although these bi-ion conductors are
able to provide reasonable ionic conductivity, the conductivity is generally anion
dominated, with Li transference number to be of the order of 0.1-0.3.58 The transference
number refers to the fraction of the current carried by cation or anion.55 Bi-ion
conductors suffer from undesirable concentration polarization, in which anions build up
at the electrode/electrolyte interface due to their high mobility in the electrolyte and
exclusion from the electrode.58 The concentration polarization then degrades battery
performance. Single-ion conductors with anions fixed to the polymer backbone are of
increasing interest for applications in Li-ion batteries, since they can prevent
concentration polarization problem and achieve a cation transference number of 1.
However, the single-ion conductors studied so far have much lower conductivity than the
bi-ion conductors. In order to optimize the ion conduction in this class of materials, a
fundamental understanding of the structure and mechanism of ion transport is essential.
Recently, PEO-based sulfonate polyester and polyurethane ionomers have been
chosen as model single-ion conductors by several research groups to investigate their ion
based on the modeling of the electrode polarization, in which the ions buildup at
electrodes under low frequency electric field, are able to extract both ion mobility and
mobile ion concentration from the frequency dependence of complex dielectric loss
data.62 The ions in these ionomers mostly form bound states and, thus, do not contribute
to ion conduction.59-62 The temperature dependence of the conducting ion concentration
is Arrhenius,60-62 suggesting a thermally activated process. The ion mobility increases
with increasing temperature and is well described by the VFT equation, consistent with
the coupling of ion motion to segmental mobility.60-62 However, the detailed
morphologies of these ionomers are still not available, and might hold the key to
developing strategies to improve ion conductivity.
1.4 Outline and Contribution
This dissertation provides a fundamental understanding of the morphologies of
ionomers over multi-length scales and the correlations between the structure, dynamics,
and ion conduction. First, we extended our group’s previous study of strongly
segregating ionomers to systematically investigate the morphology of the ionomers as a
function of cation type, acid content and neutralization level. The size, shape, local
structure, and composition of the ionic aggregates and its correlation with dynamics were
examined in detail. Second, we investigated the multi-scale morphology and ion
association behavior of PEO-based single-ion conductors as a function of PEO spacer
length, cation size, and temperature. Last, the morphology of polyurethane ionomers
on the hydrogen bonding interactions. The following paragraphs summarize the main
content of each chapter.
Chapter 2 presents the morphologies of poly(styrene-ran-methacrylic acid)
(SMAA) copolymers neutralized with Cu2+, including the local structure and composition
of the ionic aggregates as a function of acid content and level of neutralization. X-ray
scattering and STEM were employed to obtain the size and number density of ionic
aggregates, and electron spin resonance (ESR) spectroscopy provided detailed
information regarding coordination structures of Cu2+. This is the first time STEM,
X-ray scattering and ESR have been combined to study the exact same materials, thereby
overcoming the inconsistency in sample preparation methods from separate studies. Our
findings about the composition and local structure of ionic aggregates provide valuable
insights for understanding of ion diffusion and polymer dynamics in these ionomers.
This chapter was published in Polymer: Wang, W.; Chan, T. T.; Perkowski, A. J.; Schlick,
S.; Winey, K. I. Polymer 2009, 50, (5), 1281-1287. Copyright © 2009 Elsevier Ltd.
Chapter 3 describes the structure and dynamics of SPS acid copolymers and
ionomers as a function of acid content and neutralization level. SPS acid copolymers
with three different sulfonation levels were prepared from polystyrene and neutralized to
different extents with Na, Cs, and Zn. HAADF STEM imaging verified the formation of
spherical ionic aggregates homogeneously distributed in the matrix. The
Kinning-Thomas model was used to interpret the ionomer peak from X-ray scattering, which
provided detailed information regarding the size, radius of closest approach, and number
density of the ionic aggregates. Dielectric relaxation spectroscopy probes the dipolar
electrode-electrolyte boundaries. Correlations between structure and dynamics in SPS acid
copolymer and SPS-Zn ionomers are established.
In Chapter 4, a series of Li, Na, and Cs-neutralized polyester ionomers with
well-defined PEO spacer lengths between sulfonated phthalates were investigated by X-ray
scattering at room temperature. The effects of the spacer lengths and cation type on the
multi-scale morphologies of ionomers were examined. We present the hierarchical
semi-crystalline structures in these PEO-based ionomers, including crystal structure, states of
ionic association, and higher-order crystalline lamellae. Detailed analysis of the
normalized X-ray scattering intensity from these ionomers reveals a variety of ionic states
that are highly dependent on the cation size. These findings compare favorably with ab
initio calculations, and advance our understanding of ion-conduction mechanism. This
chapter was published in Macromolecules: Wang, W.; Liu, W.; Tudryn, G. J.; Colby, R.
H.; Winey, K. I. Macromolecules 2010, 43 (9), 4223-4229. Copyright © 2010 American
Chemical Society.
In Chapter 5, we extend the study of PEO-based ionomers to explore the effect of
temperature on the ion association behaviors using variable-temperature X-ray scattering.
Thermally reversible microphase separation of the ionic groups was observed at elevated
temperature, resembling the lower critical solution temperature (LCST) behavior in
polymer blends. For these ionomers, the extent of microphase separation increases with
increasing temperature. We examine the position of the ionomer peak and amorphous
peak as a function of temperature and PEO spacer length, and employ two different
scattering models to interpret the ionomer peaks. To the best of our knowledge, this is
explanation for the microphase of ionic groups with temperature is proposed. Our
findings provide the foundations for understanding the dynamics and ion transport in
PEO-based ionomers.
In Chapter 6, we conduct a fundamental investigation of the morphology of novel
polyurethanes containing phosphonium bromide to elucidate the effect of ionic groups on
the hydrogen bonding interactions. In addition, polyurethanes containing 1,4-butanediol
chain extenders were also investigated for comparison with the morphologies of the
phosphonium ion-containing analogs. DSC was employed to study the effect of ionic
groups and hydrogen bonding interactions on the crystallinity of polyurethanes. Both
DSC and FT-IR spectroscopy showed that the presence of ionic groups greatly reduced
the hydrogen bonding interactions. HAADF STEM and energy dispersive X-ray
spectroscopy (EDS) in the STEM indicated that charged polyurethanes exhibited ionic
aggregates that were rich in P and Br. Detailed analysis of the X-ray scattering profiles
from stretched and unstretched polyurethane films elucidate the origins of different
scattering peaks and help to explain the strain hardening behavior observed in tensile
testing. This work represents our group’s effect toward understanding the structure of
novel ion-containing polymers for applications in electro-active devices. Part of this
chapter was published in Macromolecules: Williams, S. R.; Wang, W.; Winey, K. I.;
Long, T. E. Macromolecules 2008, 41 (23), 9072-9079. Copyright © 2008 American
Chemical Society.
1.5 References
1. Eisenberg, A.; Kim, J.-S., Introduction to Ionomers. John Wiley & Sons: New
York, 1998.
2. Brozoski, B. A.; Painter, P. C.; Coleman, M. M. Macromolecules 1984, 17, (8),
1591-1594.
3. Brozoski, B. A.; Coleman, M. M.; Painter, P. C. Macromolecules 1984, 17, (2),
230-234.
4. Coleman, M. M.; Lee, J. Y.; Painter, P. C. Macromolecules 1990, 23, (8),
2339-2345.
5. Earnest, T. R.; Macknight, W. J. Macromolecules 1980, 13, (4), 844-849.
6. Lu, M.; Runt, J.; Painter, P. Macromolecules 2009, 42, (17), 6581-6587.
7. O'Connell, E. M.; Root, T. W.; Cooper, S. L. Macromolecules 1994, 27, (20),
5803-5810.
8. O'Connell, E. M.; Root, T. W.; Cooper, S. L. Macromolecules 1995, 28, (11),
3995-3999.
9. O'Connell, E. M.; Peiffer, D. G.; Root, T. W.; Cooper, S. L. Macromolecules
1996, 29, (6), 2124-2130.
10. Kutsumizu, S.; Goto, M.; Yano, S. Macromolecules 2004, 37, (13), 4821-4829.
11. Kruczala, K.; Schlick, S. J. Phys. Chem. B 1999, 103, (11), 1934-1943.
12. Bednarek, J.; Schlick, S. J. Am. Chem. Soc. 1991, 113, (9), 3303-3309.
13. Grady, B. P.; Cooper, S. L. Macromolecules 1994, 27, (22), 6627-6634.
14. Ding, Y. S.; Yarusso, D. J.; Pan, H. K. D.; Cooper, S. L. J. Appl. Phys. 1984, 56,
15. Ding, Y. S.; Register, R. A.; Nagarajan, M. R.; Pan, H. K.; Cooper, S. L. J. Polym.
Sci., Part B: Polym. Phys. 1988, 26, (2), 289-300.
16. Grady, B. P.; Cooper, S. L. Macromolecules 1994, 27, (22), 6635-6641.
17. Grady, B. P.; Floyd, J. A.; Genetti, W. B.; Vanhoorne, P.; Register, R. A. Polymer
1999, 40, (2), 283-288.
18. Grady, B. P. Polym. Eng. Sci. 2008, 48, (6), 1029-1051.
19. Williams, C. E.; Russell, T. P.; Jerome, R.; Horrion, J. Macromolecules 1986, 19,
(11), 2877-2884.
20. Galambos, A. F.; Stockton, W. B.; Koberstein, J. T.; Sen, A.; Weiss, R. A.;
Russell, T. P. Macromolecules 1987, 20, (12), 3091-3094.
21. Lefelar, J. A.; Weiss, R. A. Macromolecules 1984, 17, (6), 1145-1148.
22. Tomita, H.; Register, R. A. Macromolecules 1993, 26, (11), 2791-2795.
23. Chu, B.; Hsiao, B. S. Chem. Rev. 2001, 101, (6), 1727-1761.
24. Marx, C. L.; Caulfield, D. F.; Cooper, S. L. Macromolecules 1973, 6, (3),
344-353.
25. Macknight, W. J.; Taggart, W. P.; Stein, R. S. J. Polym. Sci. Part C: Polym. Symp.
1974, 45, (1), 113-128.
26. Yarusso, D. J.; Cooper, S. L. Macromolecules 1983, 16, (12), 1871-1880.
27. Ding, Y. S.; Hubbard, S. R.; Hodgson, K. O.; Register, R. A.; Cooper, S. L.
Macromolecules 1988, 21, (6), 1698-1703.
28. Kinning, D. J.; Thomas, E. L. Macromolecules 1984, 17, (9), 1712-1718.
29. Zhou, N. C.; Chan, C. D.; Winey, K. I. Macromolecules 2008, 41, (16),
30. Percus, J. K.; Yevick, G. J. Phys. Rev. 1958, 110, (1), 1-13.
31. Fournet, G. Acta Crystallogr. 1951, 4, 293-301.
32. Tsujita, Y.; Yasuda, M.; Takei, M.; Kinoshita, T.; Takizawa, A.; Yoshimizu, H.
Macromolecules 2001, 34, (7), 2220-2224.
33. Yarusso, D. J.; Cooper, S. L. Polymer 1985, 26, (3), 371-378.
34. Liu, J. Y. J. Electron Microsc. 2005, 54, (3), 251-278.
35. Winey, K. I.; Laurer, J. H.; Kirkmeyer, B. P. Macromolecules 2000, 33, (2),
507-513.
36. Kirkmeyer, B. P.; Weiss, R. A.; Winey, K. I. J. Polym. Sci., Part B: Polym. Phys.
2001, 39, (5), 477-483.
37. Taubert, A.; Winey, K. I. Macromolecules 2002, 35, (19), 7419-7426.
38. Kirkmeyer, B. P.; Taubert, A.; Kim, J. S.; Winey, K. I. Macromolecules 2002, 35,
(7), 2648-2653.
39. Kirkmeyer, B. P.; Puetter, R. C.; Yahil, A.; Winey, K. I. J. Polym. Sci., Part B:
Polym. Phys. 2003, 41, (4), 319-326.
40. Benetatos, N. M.; Winey, K. I. J. Polym. Sci., Part B: Polym. Phys. 2005, 43, (24),
3549-3554.
41. Batra, A.; Cohen, C.; Kim, H.; Winey, K. I. Macromolecules 2006, 39, (4),
1630-1638.
42. Benetatos, N. M.; Winey, K. I. Macromolecules 2007, 40, (9), 3223-3228.
43. Taubert, A.; Wind, J. D.; Paul, D. R.; Koros, W. J.; Winey, K. I. Polymer 2003,
44, (6), 1881-1892.
45. Kirkmeyer, B. P. Morphologies in Styrenic Ionomers: Effects of Neutralization,
Processing and Cations. University of Pennsylvania, Philadelphia, 2003.
46. Benetatos, N. M.; Heiney, P. A.; Winey, K. I. Macromolecules 2006, 39, (16),
5174-5176.
47. Benetatos, N. M.; Chan, C. D.; Winey, K. I. Macromolecules 2007, 40, (4),
1081-1088.
48. Williams, S. R.; Wang, W.; Winey, K. I.; Long, T. E. Macromolecules 2008, 41,
(23), 9072-9079.
49. Benetatos, N. M.; Smith, B. W.; Heiney, P. A.; Winey, K. I. Macromolecules
2005, 38, (22), 9251-9257.
50. Fenton, D. E.; Parker, J. M.; Wright, P. V. Polymer 1973, 14, (11), 589-589.
51. Wright, P. V. British Polymer Journal 1975, 7, (5), 319-327.
52. Armand, M. B.; Chabagno, J. M.; Duclot, N. J., In Fast Ion Transport in Solids,
Vashishta, P.; Mundy, J. N.; Shenoy, G. K., Eds. North Holland, New York 1979; p 131.
53. Scrosati, B.; Vincent, C. A. MRS Bull. 2000, 25, (3), 28-30.
54. Meyer, W. H. Adv. Mater. 1998, 10, (6), 439-448.
55. Ratner, M. A.; Shriver, D. F. Chem. Rev. 1988, 88, (1), 109-124.
56. Ratner, M. A., In Polymer Electrolyte Reviews, MacCallum, J. R.; Vincent, C. A.,
Eds. Elsevier: New York, 1987; Vol. 1.
57. Tarascon, J. M.; Armand, M. Nature 2001, 414, (6861), 359-367.
58. Wright, P. V. MRS Bull. 2002, 27, (8), 597-602.
59. Dou, S. C.; Zhang, S. H.; Klein, R. J.; Runt, J.; Colby, R. H. Chem. Mater. 2006,
60. Fragiadakis, D.; Dou, S.; Colby, R. H.; Runt, J. J. Chem. Phys. 2009, 130, (6),
064907.
61. Fragiadakis, D.; Dou, S. C.; Colby, R. H.; Runt, J. Macromolecules 2008, 41, (15),
5723-5728.
62. Klein, R. J.; Zhang, S. H.; Dou, S.; Jones, B. H.; Colby, R. H.; Runt, J. J. Chem.
Chapter 2
Local Structure and Composition of the Ionic Aggregates in
Cu(II)-neutralized Poly (styrene-co-methacrylic acid) Ionomers
2.1 Introduction
Ionomers are copolymers containing a small fraction of ionic functional groups,
which are often pendant to the polymer backbone.1 Most of these ionic functional groups
and their counterions self-assemble into ionic aggregates, due to the strong electrostatic
interactions in the low dielectric constant media. These ionic aggregates act as physical
cross-links that confer remarkable physical and chemical properties to the ionomers.
Much research has been devoted to studying the sizes and spatial distribution of ionic
aggregates using X-ray scattering,2-5 neutron scattering,6-8 and scanning transmission
electron microscopy (STEM).9, 10 The appearance of a broad, isotropic scattering peak at
scattering vector q = 1-5 nm-1 indicates the existence of ionic aggregates, and STEM
enables direct imaging of the ion-rich aggregates. Winey’s group has recently applied
both STEM and X-ray scattering to investigate the size and number density of spherical
ionic aggregates in a poly(styrene-ran-methacrylic acid) (SMAA) copolymer neutralized
with Cu(II).11, 12 By accounting for the extensive overlap in the STEM image, the images
and the scattering data as interpreted by a liquid-like modified hard-sphere model are in
excellent agreement with respect to both aggregate size (R1) and aggregate number
density (Np). The successful reconciliation between STEM images and X-ray scattering