INTRODUCTION
Membrane separation technology has become an interesting technology for separation and purification of hydrocarbon mixtures. Separation of liquid mixtures through membrane technology can be carried out by using pervaporation (PV) process.
Per vaporation is a membrane based process in which separation of liquid mixtures is carried out through a dense membrane. The membrane used for pervaporation can be polymeric or inorganic membrane such as zeolite membranes. In pervaporation, a liquid mixture to be separated
www.orientjchem.org
CODEN: OJCHEG 2012, Vol. 28, No. (1): Pg. 123-129
Est. 1984
An International Open Free Access, Peer Reviewed Research Journal
Mathematical Modeling and CFD Simulation of
Hydrocarbon Purification Using Membrane Technology
AZAM MARJANI* and SAEED SHIRAZIAN
Islamic Azad University, Arak Branch, Department of Chemistry, Arak, Iran. *Corresponding author: E-mail: [email protected]
(Received: December 12, 2011; Accepted: January 25, 2012) ABSTRACT
Purification of hydrocarbon mixtures is studied in this work theoretically. The purification technology considered in this work is Pervaporation. Pervaporation (PV) is a membrane technology which utilizes a dense membrane for separation. The governing mechanism in separation using PV is solution-diffusion mechanism. To study the transport of species through PV membranes, a comprehensive mathematical model was developed. Separation of toluene and n-heptane in a PV batch was investigated in this work. Conservation equations including continuity, momentum, and heat transfer equations were solved using finite element method (FEM). The modeling results also presented temperature profile and Reynolds number in the membrane module. The simulation results revealed that the developed model could provide a general simulation of transport through PV membranes.
Key words: Mass transfer; Hydrocarbon purification; Numerical simulation; CFD; Membrane.
removal of organic components from aqueous solutions, and separation of organic/organic mixtures [4-10].
Modeling of pervaporation process is of vital impor tance. There are two methods for modeling of pervaporation. The first method is based on resistance-in-series model. In this model, the resistances in the feed boundary layer and the membrane phase are considered in series, while the resistance at the permeate side is neglected because of high vacuum applied [10-15].
The second method utilizes the conservation equations for components in liquid and membrane phases. In this method, conservation equations including continuity, energy and momentum equations are derived and solved simultaneously by suitable numerical method based on computational fluid dynamics (CFD) techniques. Some researchers have applied this method for simulation of membrane separation processes [15-20].
The main objective of this work is to develop and solve a comprehensive model for simulation of toluene/n-heptane mixtures separation by PV technique. Simulations are based on solving the conservation equations including mass, heat and momentum transfer of toluene and n-heptane in the feed side, the membrane and the permeate side.
Theory
The equation of continuity
The continuity equation is used for prediction of toluene and n-heptane in the PV membranes. It may be written as [19]:
...(1)
where ρ is the density of the fluid (kg/m3) and u is the velocity vector (m/s). The velocity distribution can be obtained from equation of motion.
The equation of momentum transfer
The Navier-Stokes equations are used to
investigate the velocity distribution in the membrane module. The Navier-Stokes equations are expressed as follows [19]:
...(2)
where h is the dynamic viscosity (kg/m.s), u is the velocity vector (m/s), r is density of the fluid (kg/m3), p is pressure (Pa) and F is the body force term (N). The feed flows in the z-direction of the membrane module, therefore z-velocity should be solved. The boundary conditions for the Navier-Stokes equations are listed in Table 1.
The equation of mass transfer
Equation 3 is the mass transfer equation. This equation is used to obtain the molar concentration of species in the membrane module. The equation is applied for feed, membrane, and permeate side of the module. It is written as [19]:
...(3)
where ci is the concentration of species i (mol/m3), D
i is its diffusion coefficient (m
2/s), u is the velocity vector (m/s), Ri is the reaction rate for species i (mol/m3.s) which is not considered in these calculations and δts is the time-scaling coefficient. The boundary conditions for mass transfer equation are listed in Table 1.
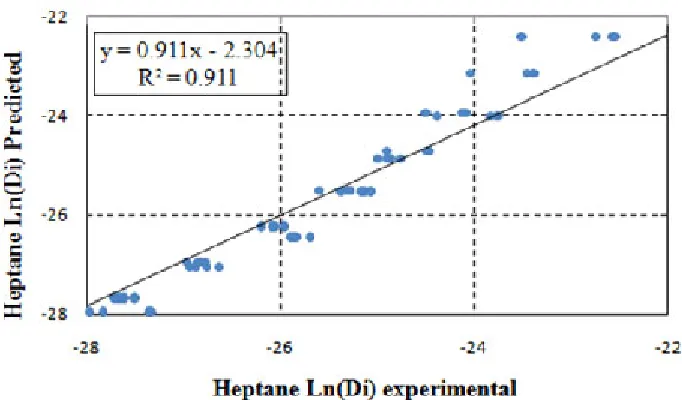
Two correlations in the form of Arrhenius are considered for prediction of diffusivities through the membrane. First correlation shows temperature dependency of diffusion coefficient (Equation 4) and the second one determines concentration dependency of diffusion coefficient (Equation 5) [19]:
...(5)
where Di(T) is the temperature-dependent diffusion coefficient for component i, D0 and D0i are the pre-exponential factor, ED is the activation energy of diffusion, R is the universal gas constant, T is temperature (K), Di(c) concentration-dependent diffusion coefficient for component i, BD the is plasticization parameter for diffusivity and c is the concentration of penetrant (mol/m3).
A simple correlation (Equation 6) which is the product of above correlations was derived to consider both dependencies.
...(6)
Figs. 1 and 2 show the results for prediction of diffusivities.
Fig. 1: Predicted Ln(Di) as a function of experimental Ln(Di) for toluene
The equation of heat transfer
An equation for heat transfer is needed to determine the temperature distribution of mixture in the membrane module. This equation includes both term of conduction and convection heat transfer [19]:
...(7)
The boundary conditions for the heat transfer equation are shown in Table 1.
Table 1: Boundary conditions for momentum, mass and heat transfer equations momentum mass transfer eq. (toluene) mass transfer eq. heat transfer eq. c (mol/m3), D (m2/s) (n-heptane) c (mol/m3), D (m2/s) transfer
eq. Initial u=0 feed side ctol= 1550 feed side chep= 5700 25 °C
value Dtol-hep= Dtol-hep= 7.95×
(t=0) 7.95× 10⁻⁹ 10-9
membrane ctol= 0 membrane side chep= 0
side Dtol-mem Dhep-mem
permeate ctol = 0 permeate side chep = 0
side D= 1.05× 10⁻⁵ D= 1.02× 10⁻⁵
outlet P=Pvacuum ctol-out chep-out convective flux
wall u=0 85 °C
axis ∂u/∂r=0 ∂ctol/∂r=0 ∂chep/∂r=0 ∂u/∂r=0
Numerical solution of the model equations The governing conservation equations including momentum, concentration (mass) and heat transfer equations with the boundary conditions were solved numerically using COMSOL Multiphysics software version 3.2. This software employs finite element method (FEM) in numerical solving of the model equations. The use of FEM method allows mass conservation in the domain; therefore “numerical loss” of mass in the computational domain is not a major concern. The FEM was combined with adaptive meshing and error control using numerical solver of UMFPACK. This solver is an implicit time-stepping scheme, which is well suited for solving stiff and non-stiff non-linear boundary value problems. An IBM-PC-Pentium 5 (CPU speed was 2600 MHz and 2 GB of RAM) was used to solve the set of equations. The computational time for solving the set of equations was about 495 seconds. It should be pointed out that the COMSOL mesh generator creates triangular meshes that are isotropic in size. A large number of elements were then created with scaling. This generated an anisotropic mesh with 6926 elements.
Adaptive mesh refinement in COMSOL, which generates the best and minimal meshes, was used to mesh the module geometry. In addition, because of higher gradient near the membrane surface, the finer meshes were used. Fig. 3 indicates the meshes generated by the COMSOL software.
Fig. 3: Magnified segments of the mesh used in the numerical simulation. There are 6926
RESULTS AND DISCUSSION
Temperature profile of mixture in the membrane module
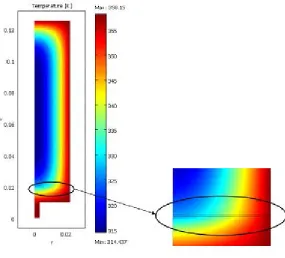
Temperature distribution of hydrocarbon mixture in the membrane module was obtained through solving heat and momentum transfer equations. The temperature distribution in the module after 900 s attaining nearly steady state condition is shown in Fig. 4. It should be pointed out that it needs more computational time for attaining steady state condition. As it can be seen, near the
module wall, temperature has the highest value. This is due to direct contact with heat source. On the other hand, temperature decreases in the middle of membrane module significantly. In the membrane zone, which is between the feed and the permeate side, the trend of temperature profile changes. This phenomenon could be due to phase conversion from liquid phase in the feed to vapor phase in the permeate. In addition, the conductive and convective heat transfer is faster in vapor phase rather than liquid phase; hence, the temperature profile exhibits different trends.
Fig. 4: Temperature profile established after 900 s
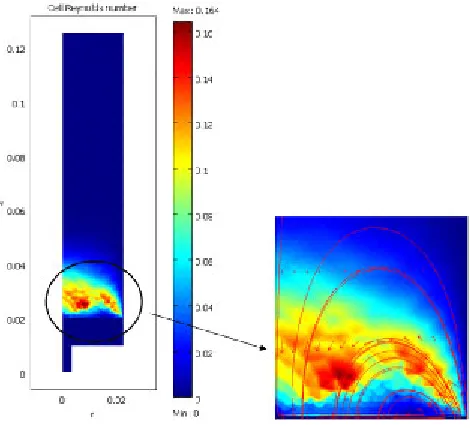
Momentum profile
As it was shown earlier, a temperature gradient is observed in the module. It was proved that temperature is the highest in the region near the wall. This temperature difference causes reduction of fluid density near the module wall and consequently the fluid movement upward. So, a slow displacement happens and the fluid moves in the module especially near the membrane surface. It means that temperature gradient leads to velocity gradient and by passing toluene through the
CONCLUSIONS
Separation of toluene from n-heptane by pervaporation process using a dense polymeric membrane was studied theoretically in this work. A comprehensive mathematical model was developed to predict transport of toluene and n-heptane through the membrane in a PV batch system. The model was based on numerical solution
Fig. 5: Cell Reynolds number established after 900 s
of the conser vation equations (continuity, momentum, and heat transfer) for the species in the membrane module. Temperature profile and Reynolds number in the module were presented. The modeling findings showed that the developed model can predict transport phenomena in the separation of hydrocarbon mixtures using pervaporation.
REFERENCES
1. Y.Ch. Wang, Ch.L. Li, J. Haung, Ch. Lin, K.R. Lee, D.J. Liaw, J.Y. Lai, Pervaporation of benzene/cyclohexane mixtures through aromatic polyamide membranes, J. Membr. Sci. 185: 193-200 (2001).
2. V.S. Cunha, M.L.L. Paredes, C.P. Borges, A.C. Habert, R. Nobrega, Removal of aromatics from multicomponent organic mixtures by pervaporation using polyurethane membranes: experimental and modeling, J. Membr. Sci. 206: 277-290 (2002).
3. M.Y. Teng, Ch.L. Li, K. R. Lee, J. Y. Lai, Permselectivities of 3,32 ,4,42 benzhydrol tetraacarboxylic dianhydride based polyimide membrane for pervaporation,
Desalination 193: 144-151 (2006).
4. J. Frahn, G. Malsch, H. Matuschewski, U. Schedler, H.H. Schwarz, Separation of aromatic/aliphatic hydrocarbons by photo-modified poly(acrylonitrile) membranes, J. Membr. Sci. 234: 55-65 (2004).
5. M. Yoshikawa, H. Shimada, H. Tsubouchi, Y. Kondo, Specialty polymeric membranes, 12. Pervaporation of benzene–cyclohexane mixtures through carbon graphite–nylon 6 composite membranes, J. Membr. Sci. 177: 49-53 (2000).
J. Membr. Sci. 241: 1-21 (2004).
7. P. Steltenpohl, M. Chlebovec, E., Graczova, Simulation of Toluene Extractive Distillation from a Mixture with Heptane, Chem. Pap. 59: 421-427 (2005).
8. P. Billard, Q.T. Nguyen, C. Leger, R. Clement, Diffusion of organic compounds through chemically asymmetric membranes made of semi-interpenetrating polymer networks, Sep. Purif. Technol. 14: 221-232 (1998). 9. M.A. Hughes, Y. Haoran, Liquid-Liquid
Equilibria for Separation of Toluene from Heptane by Benzyl Alcohol Tri( ethylene glycol) Mixtures, J. Chem. Eng. Data 35: 967-971 (1990).
10. G.W. Meindersma, T. van Schoonhoven, B. Kuzmanovic, A.B. de Haan, Extraction of toluene, o-xylene from heptane and benzyl alcohol from toluene with aqueous cyclodextrins, Chem. Eng. Process. 45: 175-183 (2006).
11. M. Mohsen-Nia, F.S. Mohammad Doulabi, Separation of aromatic hydrocarbons (toluene or benzene) from aliphatic hydrocarbon (n-heptane) by extraction with ethylene carbonate, J. Chem. Thermodyn. 42: 1281-1285 (2010).
12. J. Garcia, S. Garcia, J.S. Torrecilla, M. Oliet, F. Rodriguez, Separation of toluene and heptane by liquid–liquid extraction using z-methyl-N-butylpyridinium tetrafluoroborate isomers (z = 2, 3, or 4) at T = 313.2 K, J. Chem. Thermodyn. 42: 1004-1008 (2010). 13. J.P. Garcia Villaluenga, A. Tabe-Mohammadi,
A review on the separation of benzene/ cyclohexane mixtures by pervaporation
processes, J. Membr. Sci. 169: 159-174 (2000).
14. A.V. Koselev, V.V. Khopina, L.A. El’tekov, Adsorption of toluene-heptane mixtures on silica gels and carbon blacks, Russ. Chem. Bull. 7: 647-653 (1958).
15. Q. Huang, H. Vinh-Thang, A. Malekian, M. Eic, D.Trong-On, S. Kaliaguine, Adsorption of n-heptane, toluene and o-xylene on mesoporous UL-ZSM5 materials, Microporous Mesoporous Mater. 87: 224-234 (2006).
16. M. Matsumoto, Y. Inomoto, K. Kondo, Selective separation of aromatic hydrocarbons through supported liquid membranes based on ionic liquids, J. Membr. Sci. 246: 77-81 (2005).
17. M. Chakraborty, M. Bart , Highly selective and efficient transport of toluene in bulk ionic liquid membranes containing Ag+ as carrier, Fuel Process. Technol. 88: 43-49 (2007). 18. H. Schwarz, G.Malsch, Polyelectrolyte
membranes for aromatic–aliphatic hydrocarbon separation by pervaporation, J. Membr. Sci. 247: 143-152 (2005). 19. R.B. Bird, W. E. Stewart, E. N. Lightfoot,
Transport phenomena, second ed., John Wiley & Sons, Inc., United States of America (2002).