IJEDR1701072
International Journal of Engineering Development and Research (www.ijedr.org)466
Analysis of Spectrum Sensing based on
Cyclostationary Feature Detection and Access using
OFDM and OWDM
1
Raman Kaur,
2Dr. Paras Chawla
1
Student,
2Professor
1,2Department of Electronics and Communication Engineering 1,2Chandigarh Engineering College, Landran, Greater Mohali, Punjab
________________________________________________________________________________________________________
Abstract - the growing demand of remote applications requires large amount of bandwidth. This becomes limitation between the growing demand of wireless spectrum and limited wireless resources. Traditionally, the radio spectrum is allocated in a fixed or statistical manner. In this manner of allocation, the spectrum is not fully utilized. Hence, the spectrum remains under-utilized. To make underutilized spectrum, used properly it should be allocated dynamically. Cognitive radio (CR) is a technology, which makes use of dynamic spectrum assignment (DSA) to allocate the spectrum dynamically. Spectrum sensing is one of the important tasks in DSA. In this paper, cyclostationary feature detection is used for sensing purpose. After detection, multiple users use orthogonal wavelet division multiplexing (OWDM) and orthogonal frequency division multiplexing (OFDM) schemes to access the single spectrum. The simulation parameters such as probability of detection, probability of false alarm, bit error rate and symbol error rate are used for performance evaluation of cyclostationary feature detection.
Index Terms— cognitive radio, Cyclostationary feature detection, OWDM, OFDM.
________________________________________________________________________________________________________
I. INTRODUCTION
Wireless communication becomes essential part of daily human life. With new emerging technologies, many applications such as smart phones and mobile computing involve more bandwidth. All those developments become constraint between the growing demand of wireless spectrum and the limited wireless resources. The Federal Communication Commission (FCC) in the U.S. is an independent agency which regulates the usage of spectrum internationally and domestically. For large geographical area and long term usage, a licensee is assigned with the spectrum. It has been studied that a portion of radio spectrum allocated to licensed user remains underutilized. The underutilized section of spectrum is called white space or spectrum holes [1]. To solve the inconsistency between the wireless resources and the demand of wireless spectrum, the unused spectrum must be used fully. To make the feasible, the spectrum assignment should be dynamic instead of statistical or fixed. In fixed spectrum assignment, an unlicensed user is not able to reuse the unconsumed frequency spectrum or bands properly. Whereas, dynamic or opportunistic spectrum access (OSA) allows an unlicensed user to access the available bands suitably without interrupting the primary users. Therefore, the unlicensed user must be familiar with the occupancy of a licensee in the available band. In order to make use of free spectrum, the cognitive user must locale the spectrum holes and idle state of licensed user. The cognitive user must be capable of instantly quitting the band if primary user is transmitting. This is accomplished by dynamically accessing the spectrum. Cognitive radio (CR) appears to be a technology, which makes use of dynamic spectrum assignment.
IJEDR1701072
International Journal of Engineering Development and Research (www.ijedr.org)467
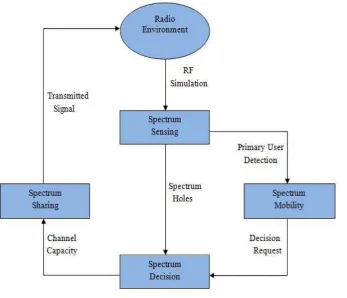
Fig. 1 Spectrum HolesThere are following properties of CR:
Cognitive capability: CRNs must be capable of selecting a suitable spectrum space by continuous examination of the desired environment or spectrum. This become attainable by spectrum management process, where a number of variables i.e. modulation type, frequency, power, etc., are evaluated. A cognitive cycle is required for the adaptive operation of cognitive capabilities as shown in Figure 2. This involves following operations.
a) Spectrum Sensing: This is a vital part of CR. The presence of PU and underutilized frequency range is observed by spectrum sensing process. There are local sensing techniques, database registry and beacon signals which make this possible. Beacon signal brings knowledge regarding channel quality as well as spectrum [4].
b) Spectrum analysis: The characteristics of various channels or networks are analyzed in this section. Then, by using sensing process, unused space is obtained.
c) Spectrum decision: This is the way toward selecting most applicable range of spectrum as indicated by client prerequisite and range qualities for transmission. A single CR or output can make spectrum decision from various CRs.
IJEDR1701072
International Journal of Engineering Development and Research (www.ijedr.org)468
Reconfigurability: After selecting free space, the next step is to communicate within selected space by changing its several parameters (e.g. type of modulation, frequency and transmission power). This is imperative since CRs, intended to make utilization of spectrum range in a opportunistic way, withdrawing a band if event of PU is seen by utilizing range hand-off technique. Software Defined Radios (SDRs) is used to make this feasible for reconfigurability characteristic [5]. It is promising strategy to make CRs more adaptable because hardware level seems to be insufficient. SDRs comprises of software and hardware parts as predicted in the Figure 3.Fig. 3 Software defined radio architecture [6].
Radio operation environment (ROE): For the radio configuration, ROE supports the essential parts such as antenna, RF
specific module, TRSEC module, ISEC module, and operating system.
User applications (UA): Field Programmable Gate Array (FPGA) devices are used for the implementation of hardware
part because of low energy consumption, better performance and high reprogrammability [5].
Service provider applications (SPA): This provides various services such as messaging, voice, video etc.
Radio applications (RA): RA controls the processing of radio platform, air interference and performs the communication
protocols.
II. SPECTRUM SENSING
Spectrum sensing is a vital part of dynamic spectrum access (DSA). It is the recognition of the existence of signals in the desired frequency range. To apportion another communication link, an empty portion of the frequency range is nominated. Before the transmission of a packet by an auxiliary or secondary user (SU), the spectrum environment should sensed well to recognize an accessible frequency band. To identify if there is a PU getting to the band, a SU needs constantly sense the band throughout the transmission. Therefore, the auxiliary user must have the capability to identify or might be altered of an approaching primary client and moved to another empty spot as soon as possible if primary user is arrived. This requires some level of conviction to discover the empty space and additionally quick assignment of this. There are centralized and uncentralized methodologies to locate an unused frequency band. The main challenge in range detection is detection reliability and time required for that. Spectrum sensing can be performed in frequency, code and time domain [7]. Overall, there are two techniques to decide signal nearness i.e. cooperative and local or non-cooperative sensing. Local sensing and Cooperative sensing is mainly constitute of matched filtering (MFD), cyclostationary feature detection (CFD), energy detection (ED), centralized and decentralized sensing.
1. Cooperative Spectrum Sensing (CSS)
When a network or group of cognitive users/radios shares the sensing information, cooperative spectrum sensing needed. It deals with reporting and sensing. It is a multi-antenna system. A definitive objective of cooperative sensing is to recognize unused part of range transiently and spatially. It provides better utilization of spectrum, better probability of detection in desired environment. These schemes outperform in case of hidden nodes, fading channels, and local interference.
Cooperative sensing has several advantages such as reduced hidden node problem, increased agility; false alarm is reduced, accurate signal detection. Cooperative spectrum sensing can classify as distributed and centralized.
2. Non-Cooperative Spectrum Sensing Techniques
IJEDR1701072
International Journal of Engineering Development and Research (www.ijedr.org)469
2.1 Cyclostationary Feature Detection
The cyclostationary feature i.e. periodicity of received signal is used for the detection of primary user. The cyclic autocorrelation function (CAF) of received signal is mainly used to make this attainable. Further, Cyclic Spectrum Density (CSD) function is used to characterize CAF. The cyclic frequency is equivalent to fundamental frequency of transmitted signal. The peaks of the received signal are indicated using CSD. H0 hypotheses show that there is no peak [8]. The sine wave, hopping sequence,
cyclic prefix, pulse train etc are the form of modulated signal.
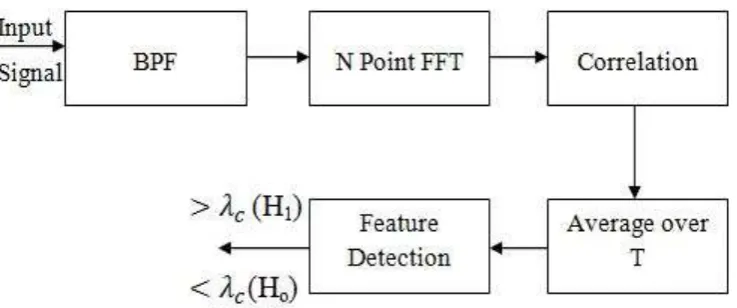
Fig. 4 Block diagram of cyclostationary feature detection.
The input signal or modulating signal passed through a filter and then the Fast Fourier Transform (FFT) with N point integer applied to the input signal as shown in Figure 4. A correlation function i.e. autocorrelation function is used to correlate the input signal. Further, to achieve the feature detection, a signal z (t) is considered and its periodicity is shown as:
𝑥(𝑡) = 𝑥(𝑡 + 𝑇0) (1)
The fourier series representation of the eq. 1 is given as:
𝑥(𝑡) = ∑∞𝑘=−∞𝑎𝑘 𝑒𝑗𝑘𝜔𝑡 (2) By means of transformation and fourier analysis, periodicity information can be extracted. Consider a simple modulated signal i.e.
𝑦(𝑡) = 𝑎(𝑡)cos (2𝜋𝑓𝑐𝑡) .
Where a (t) is the amplitude that is random in nature and fcis the carrier frequency.
Now to analyze such modulated signal, autocorrelation function and Power Spectral Density (PSD) are utilized. The autocorrelation function and the Power Spectral Density (PSD) for a (t) are given as;
𝑅𝑎= 𝐸{𝑎(𝑡)𝑎(𝑡 − 𝜏)∗} (3) 𝑆𝑎(𝑓) = 𝐹{𝑅𝑎(𝜏)} (4)
Now the PSD for the function x (t) is as follows;
𝑆𝑦(𝑓) = 1
4[𝑆𝑎(𝑓 + 𝑓𝑐) + 𝑆𝑎(𝑓 − 𝑓𝑐)] (5)
There are sine wave components or spectral lines as shown in above equation. The periodicity of the signal is more cleared with the spectral lines. So now consider a quadric equation and its transformation to make it clearer. The quadric equation is 𝑥(𝑡) = 𝑦(𝑡)2
or 𝑥(𝑡) = 𝑎(𝑡)2cos (2𝜋𝑓
𝑐𝑡) by using trigonometric properties this equation become as follows; 𝑥(𝑡) =1
2[𝑐(𝑡) + 𝑐(𝑡) cos(2𝜋𝑓𝑐𝑡)] (6)
Where 𝑐(𝑡) = 𝑎(𝑡)2
C (t) is positive and have spectral lines gives the periodicity clearly. The transformation 𝑥(𝑡) = 𝑦(𝑡)𝑦(𝑡 − 𝜏) ascertains spectral lines. By mentioning, 𝛼 = 𝑚. 𝑓𝑐 the following eq. 7 is obtained.
𝑀𝑥𝛼= 𝑥(𝑡)𝑒−𝑗2𝜋𝛼𝑡
= 𝑦(𝑡). 𝑦(𝑡 − 𝜏)𝑒−𝑗2𝜋𝛼𝑡 ≠ 0 (7) Where y (t) is second order periodicity if spectral lines contain delay product that is given as:
𝑋𝜏 = 𝑦 (𝑡 − 𝜏 2) 𝑦
∗(𝑡 +𝜏 2) 𝑀𝑥𝛼= 𝑦 (𝑡 −
𝜏 2) . 𝑦
∗(𝑡 +𝜏
2) (8)
And the autocorrelation for this equation at α=0 is generalized as;
𝑅𝑦0= 𝑦 (𝑡 − 𝜏
2) 𝑦 ∗(𝑡 +𝜏
2) (9)
The Cyclic autocorrelation function (CAF) for the above equation is given as:
𝑅𝑦𝛼= 𝑦 (𝑡 − 𝜏
2) 𝑦 ∗(𝑡 +𝜏
2)𝑒
−2𝑗𝜋𝛼𝑡 (10)
The spectral correlation function (SCF) is obtained from the following equation;
𝑅𝑦𝛼(0) = |𝑦(𝑡)|2𝑒−2𝑗𝜋𝛼𝑡 (11)
The signal y (t) is go through the narrow band filter and the average power is calculated. The bandwidth of the filter is almost equals to zero when the filter is repeated all over the spectrum. Then the PSD for the signal y (t) is given as;
𝑆𝑦(𝑓) = lim 𝐵→0 1
𝐵(|ℎ𝐵(𝑡)⨂𝑦(𝑡)|
IJEDR1701072
International Journal of Engineering Development and Research (www.ijedr.org)470
The signal y (t) becomes y [n] after applying fourier transform. And the spectral correlation density (SCD) function for y [n] is given as;𝑅𝑦𝛼(𝑓) = ∑𝛼𝑖=0𝑅𝑦𝛼(𝑖)𝑒−2𝑗𝜋𝑓𝑖 (13)
Where 𝑅𝑦𝛼(𝑖) is given as follows; 𝑅𝑦𝛼(𝑖) = lim
𝑁→∞
1
2𝑁+1∑ [𝑦(𝑛 + 𝑖)𝑒
−2𝑗𝜋𝛼(𝑛+𝑖)] 𝑁
𝑛=−𝑁 [𝑦(𝑛)𝑒−2𝑗𝜋𝛼𝑛] (14)
The periodic statics i.e. mean and auto correlation function of cyclostationary signal are revealed by the periodicity of signal. These features deliberately induced to give assistance to spectrum sensing. For the detection of space, this method uses CAF instead of Power Spectral density (PSD). it can detect weak signals at very low SNR also distinguishes noise from primary signals. This method is immune to noise uncertainty. When there is no information of PU, the performance is highly reliable. However, this method has some cons: implementation and computational complexity is there along with slow sensing, as compared to previous method.
III. SPECTRUM ACCESS
In the previous section, spectrum sensing is discussed with different sensing techniques. Once the spectrum is detection by the user, then the user can access it. When a number of users share the same communication channel or spectrum, multiple access is required for multiplexing the users over same spectrum or channel. This multiplexing can be done by using orthogonal frequency division multiplexing (OFDM) and orthogonal wavelet division multiplexing (OWDM).
1. Orthogonal Frequency Division Multiplexing (OFDM)
OFDM is a promising technique in the broadband remote framework. OFDM is a multi-carrier modulation method that can overcome numerous issues that emerge with high data rate communication, the most genuine of which is time scattering [9]. In OFDM, firstly the signal splits itself into independent channels, modulated by data signal and then de-multiplexed to form OFDM carrier signal. Because of the orthogonality, less portion of neighboring signals is affected by multipath fading. It uses fast fourier transform (FFT) and inverse fast fourier transform (IFFT) algorithm for transmission purpose. OFDM has been utilized as a part of the field of Wi-Fi where media transmission measures are 802.11a and so on. It has likewise been received by the innovations like wi-max, LTE-A and LTE. In CR, OFDM provides easy spectrum sensing in frequency domain and hence provide efficient spectrum utilization. It has inherent property of spectral allocation and multiple accessing.
Advantages of OFDM
i. Inter-symbol interference is less due to low data rate of carriers. ii. OFDM has high resistance to frequency selective fading iii. It is immune to multipath fading and delay spread iv. It has simple equalization
Disadvantages of OFDM
i. OFDM has high bit error rate at low SNR. ii. It has high inter-carrier interference (ICI) iii. OFDM is highly sensitive to phase noise.
iv. It performs less effectively in various fading environments such as rayleigh, racian, nakagami etc.
2. Orthogonal Wavelet Division Multiplexing (OWDM)
To make utilization of wavelet changes relating to the information being transmitted, a well known scheme is wavelet modulation. The Fourier transform in wavelet modulation is discrete in scale as well as in time domain; this makes this modulation preferable among other modulation schemes. OWDM is a multiplexing transmission technique in which information with distinctive time and frequency determination allotted to wavelet sub bands. A high degree of side lobe suppression and extremely adaptable framework, are the two main advantages of OWDM. By analyzing the wavelets, aliasing effect become noticeable which generated through the overlapping of the frequency response in the sub channels. To avoid the aliasing effect, the order of the wavelets can be increase. Thus, there must be the orthogonality between the sub bands. Instead of using Fourier transform for the modulation and demodulation, wavelets are used in DWT-OWDM. Unlike Fourier transform based system, wavelet based systems may cause a small bit error rate probability. If there is smallest amount of change in time, Fourier transform will offer actuate information with suitable windowing while performing a frequency analysis of a signal. In any case, there are quick variances in the time space or the time space contains data that is significant to how the frequency domain data is responding, is constraint in time domain. Despite the fact that in time domain there are fast fluctuations. There are a few instruments used for this however the most widely recognized are the Short-Time Fourier Transform (STFT) that works by clearing a window over the time-area flag and exhibits a three dimensional spectrograph; the wavelet change and wavelet bundles. The wavelet change maps a period capacity into a two measurement capacity of α rather than w - recurrence, where α is known as the scale and is the interpretation of the wavelet capacity along the time pivot. OWDM is best suited in cognitive radio in terms of its high noise resiliency. The effect of frequency selective fading is less in OWDM [10].This increase the bandwidth of each sub-band effectively. This is more flexible as compared to traditional scheme i.e. OFDM. There are following advantages of OWDM [11].
Advantages of OWDM
i. OWDM has low bit error rate even at low signal to noise ratio.
IJEDR1701072
International Journal of Engineering Development and Research (www.ijedr.org)471
iii. The spectral efficiency is quite high.iv. This technique has high resistance to transmission impairments.
v. Performance of the system is less affected by different fading environment.
Disadvantages of OWDM
i. OWDM requires high maintenance.
ii. The effect of noise may increases with different application and different environment.
IV. DESIGN METHODOLOGY
The proposed methodology uses a frame model for detecting the spectrum in a desired environment and a new multiplexing scheme for accessing single spectrum by multiple users. This involves following steps.
Step 1: Set the parameters such as samples S, signal to noise ratio (SNR). A spectrum of random variables is obtained. Step 2: Spectrum detection by Cyclostationary Feature Detection (CFD).
Step 3: Once the spectrum is detected then multiple users access that detected space by using orthogonal frequency division multiplexing (OFDM) and proposed scheme i.e. Orthogonal wavelet division multiplexing (OWDM) under rayleigh fading effect. Step 4: The performance of cyclostationary feature detection is evaluated according to the simulation parameters such as such as probability of detection (Pd), probability of false alarm (Pfa), bit error rate (BER) and symbol error rate (SER) with respect to SNR.
V. RESULTS AND DISCUSSION
In this section the evaluation of results is made according to simulation parametres for cyclostationary feature detetcion using OFDM and OWDM scheme. The evaluation of results is done for cyclostationary feature detection and modulation techniques are used as core for spectrum access based perfromanace improvisation for the detected spectrum. The spectrum space has been generated using sampling functions for introducing an actual spectrum generation like features. In this work, simulation results are analysed for different sample values but in this paper results are given for 200 samples and SNR is -10dB.
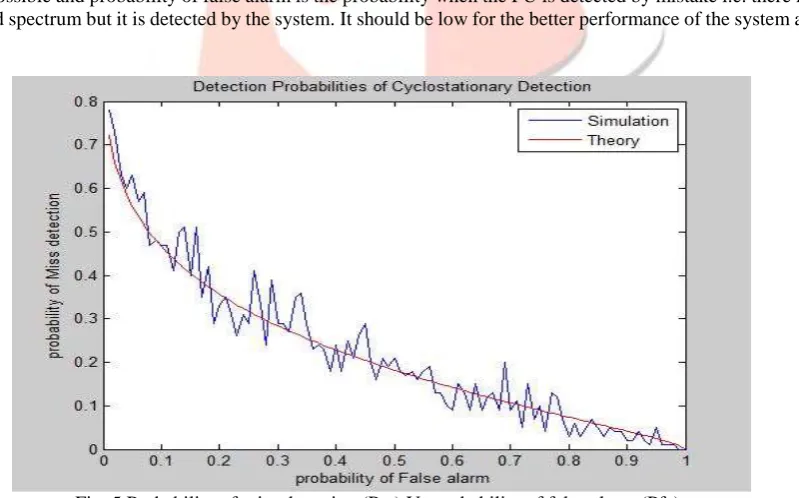
i. Probability of miss detection (Pm) and probability false alarm (Pfa):
Probability of miss detection is the probability of missing the detection or missing the PU while detecting the spectrum. It shoul be less as much as possible and probability of false alarm is the probability when the PU is detected by mistake i.e. there is no primary user in the desired spectrum but it is detected by the system. It should be low for the better performance of the system and for better outcomes.
Fig. 5 Probability of miss detection (Pm) Vs probability of false alarm (Pfa).
Figure 5, shows the Pm vs Pfa curve for 200 samples. This curve shows that probability of false alarm and probability of miss detection are inversely proportional to each other. The Pm is 0.47, 0.33, 0.29, 0.24, 0.21, 0.09, 0.09, 0.03, 0.02 and 0 for Pfa value 0.1, 0.2, 0.3, 0.4, 0.5, 0.6, 0.7, 0.8 and 0.9. The mean Pm is 1.77. if probability of false alarm increases, probability of miss detection decreases. Hence, theses two parameters cannot decrease simultaneously.
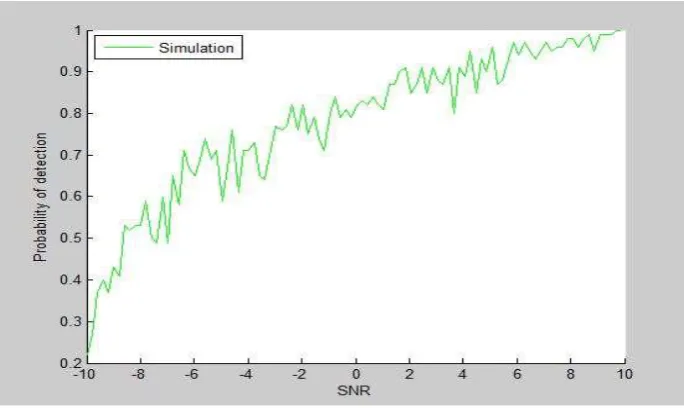
Probability of detection (Pd):
IJEDR1701072
International Journal of Engineering Development and Research (www.ijedr.org)472
Pd is also increases. The detection probability for SNR -10 to 10 is 0.22, 0.532, 0.699, 0.657, 0.807, 0.815, 0.867, 0.951, 0.98 and 1. It is analysed that cyclostationary feature detction has high probability of detection.Fig. 6 SNR Vs probability of detection(Pd).
i. Bit error rate (BER):
Bit error defined as the number of bits in a data packet get errerous because of the distortion, interference and noise in a transmission channel. In a transmission channel, BER is a rate at which error occurs. BER is an important parameter to analyse the system operation. It is small when the channel between the transmitter and receiver has high SNR. BER is analysed for two multiplexing techniques, firstly for traditonal technique i.e. Orthogonal Frequency Division Multiplexing (OFDM) and other for proposed cheme i.e. Orthogonal Wavelet Division Multiplexing (OWDM).
Fig. 7 Bit error rate (BER) Vs Signal to noise ratio (SNR).
Figure 7 shows the SNR vs BER curve for OWDM and OFDM with 200 samples. From the above simulation curve it is shown that the bit error rate decreases as the signal to noise ratio increase in both the cases. The results showns that OWDM performs better than traditional modulational scheme i.e. OFDM. The value of SNR is 0 to 30. The BER in OWDM is 0.332, 0.288, 2.37, 0.189, 0.143, 0.109, 0.064, 0.035, 0.014, 0.004, 0.0004 and 0.0001 and in OFDM is 0.405, 0.371, 0.329, 0.281, 0.232, 0.180, 0.136, 0.095, 0.060, 0.031, 0.011 and 0.003 for SNR from 2dB to 24dB. The mean BER for the wavelet scheme is 1.4155 and for conventional scheme is 2.134. Hence, OWDM has less BER as compared to OFDM.
ii. Fading:
The transmission of radio signals is affected by channel or medium through which it is transmitted. Fading causes distortion in amplitude and phase of signal in wireless medium. This may cause the high error rates.. The following fading model is used in proposed method.
Rayleigh fading model
IJEDR1701072
International Journal of Engineering Development and Research (www.ijedr.org)473
(SER). Symbol error rate is the rate of error at which the symbol gets erroneous during transmission. Fading is applied on two multiplexing techniques i.e. orthogonal frequency division multiplexing and orthogonal wavelet division multiplexing.Fig. 8 Signal to noise ratio (SNR) Vs symbol error rate (SER).
Figure 8 shows the curve of signal to noise ratio (SNR) Vs symbol error rate (SER) for 200 samples. The SNR and symbol error rate are inversely proportional to each other. Symbol error decreases as the SNR increases. Simulation results shows that symbol error rate in ODWM is less as compared to in OFDM. The SER in OWDM is 0.339, 0.280, 0.241, 0.194, 0.142, 0.102, 0.066, 0.035, 0.013, 0.003, 0.0007 and 0.0001 and in OFDM, SER is 0.410, 0.373, 0.329, 0.279, 0.231, 0.181, 0.142, 0.096, 0.062 , 0.032, 0.013 and 0.002 for SNR 2dB to 24dB. The mean SER for wavelet method is 1.4158 and for OFDM is 2.15. Hence, OWDM performs well under Rayleigh fading in comparison with OFDM. It is analyzed that orthogonal wavelet division multiplexing (OWDM) technique is better access technique than orthogonal frequency division multiplexing (OFDM) for cyclostationary feature detection. Hence, CFD has higher potential to work in fading environment.
CONCLUSION
Cognitive radio is a technology introduced to overcome the spectrum scarcity problem. Different approaches are used for sensing and accessing a spectrum. In this paper, it is concluded that cyclostationary feature detections provides suitable simulation results in case of detection probability, miss detection and false alarm probability and also in fading environment. Two multiplexing techniques i.e. OWDM and OFDM are compared based on single spectrum access by multiple users. Less BER and better performance in fading environment is achieved by OWDM as compare to OFDM.
REFERENCES
[1] R. R. Jaglan, S. Sarowa, Mustafa, R., Agrawal, S. and Kumar, N., “Comparative Study of Single-user Spectrum Sensing Techniques in Cognitive Radio Networks”, Second International Symposium on Computer Vision and the Internet (VisionNet’15), pp. 121-128, 2015.
[2] W. Ejaz, N. ul Hasan, S. Lee, and H. S. Kim, “I3S: Intelligent spectrum sensing scheme for cognitive radio networks”, EURASIP Journal on Wireless Communications and Networking, pp. 2-10, 2013.
[3] T. Yucek, and H. Arslan, , “A Survey of Spectrum Sensing Algorithms for Cognitive Radio Applications”, IEEE Communications Surveys & Tutorials, Vol. 11, Issue 1, pp. 116-130, 2009.
[4] Y. Zhao, L. Morales, J. Gaeddert, , K. K Bae, S.J. Um, and H. J. Reed, “Applying radio environment maps to cognitive wireless regional area networks,” IEEE International Symposium on New Frontiers in Dynamic Spectrum Access Networks, Dublin, Ireland, pp. 115–118, 2007.
[5] C. Y. Chen, F. H. Tseng, K. D. Chang, H. C. Chao and J. L. Chen, “Reconfigurable Software Defined Radio and Its Applications”, Tamkang Journal of Science and Engineering, Vol. 13, pp. 29-38, 2010.
[6] A. G. Fragkiadakis, E. Z. Tragos and I. G. Askoxylakis, “A Survey on Security Threats and Detection Techniques in Cognitive Radio Networks”, IEEE Communications Surveys & Tutorials, Vol. 15, issue 1, pp. 428-445, 2013.
[7] Shabnam and R. Mahajan, “Performance Analysis of Cyclostationary and Energy Detection Spectrum Sensing Techniques”, International Conference on Signal Processing, Computing and Control (ISPCC), Waknaghat, pp. 247 – 251, 2015.
[8] E. Rebeiz, P. Urriza and D. Cabric, “Optimizing wideband cyclostationary spectrum sensing under receiver impairments” IEEE Transaction On Signal Processing, Vol. 61, pp. 3931 – 3943, 2013.
[9] H. A. Mahmoud, T. Y¨ucek and H. Arslan, “OFDM for Cognitive Radio: Merits and Challenges”, IEEE wireless communication, pp. 1-9, 2009.
![Fig. 3 Software defined radio architecture [6].](https://thumb-us.123doks.com/thumbv2/123dok_us/8214116.1372735/3.595.176.424.137.383/fig-software-defined-radio-architecture.webp)