VANUATU School Mapping
Report - 2012
Department of Education Policy &Planning Unit
Private Mail Bag 9028 Port Vila, Vanuatu
Page | 2
Contents
Foreword ... 3
About This Publication ... 4
Key to Maps ... 5
Abbreviations ... 6
Section 1: Definitions, Norms and Standards... 7
Definitions of Terms ... 7
Class Size... 8
1. Summary of Total Acceptable School Age Population, School Type, Gender and School by Province - Torba Province ... 9
2. Summary of Total Acceptable School Age Population, School Type, Gender and School by Province - Sanma Province ... 11
3. Summary of Total Acceptable School Age Population, School Type, Gender and School by Province - Penama Province... 13
4 Summary of Total Acceptable School Age Population, School Type, Gender and School by Province - Malampa Province ... 15
5. Summary of Total Acceptable School Age Population, School Type, Gender and School by Province - Shefa Province ... 17
6. Summary of Total Acceptable School Age Population, School Type, Gender and School by Province - Tafea Province... 19
Standard Size ... 21
Section 2: Catchment Areas ... 22
Catchment Area 1: Torba Province ... 25
Catchment Area 2: Sanma Province ... 31
Catchment Area 3: Penama Province ... 41
Catchment Area 4: Malampa Province ... 51
Catchment Area 5: Shefa Province ... 64
Catchment Area 6: Tafea Province ... 79
Section 3: Summary Findings ... 90
3.1 Summary Findings in Torba ... 90
3.2 Summary Findings in Sanma... 94
3.3 Summary Findings in Penama ... 98
3.4 Summary Findings in Malampa ... 102
3.5 Summary Findings in Shefa... 106
3.6 Summary Findings in Tafea ... 110
Appendix ... 115
1. 2011 Enrolment by Province ... 116
2. Projected 2011 School Age Population ... 117
3. ECE Model Kindy... 118
4. Teacher Data 2011 ... 118
Page | 3
Foreword
School Mapping is a set of techniques and procedures used to plan the demand for school places at the local level and to decide on the location of future schools and the means to be allocated at the institutional level.
As a technique it requires four steps: first, diagnosing the coverage of the present educational services and the condition of the school network; second, projecting the number of pupils to be enrolled in each village; third, defining the norms and rules governing the creation of new schools or the opening of new schools or the opening of a new section or class; such norms include the maximum distance that a child should be expected to walk to attend a pre-school, a primary school, a community secondary or a secondary school; the minimum number of pupils required to allow the creation of a new pre-school center, a new primary school, a new community secondary school or secondary school; the maximum number of pupils who should be enrolled in a class leading to the opening of a new section etc.
The last step in school mapping is the preparation of the proposals or the local operational plan, that is to say, the proposals in terms of the number of primary schools to be opened, the number of classes and teachers to be planned; the number of classrooms to be built or renovated; eventually, the number of classes or sections to be closed so as to respect the norms and the consequences of redeployment of teachers.
The school map should be a forward looking and dynamic vision of what the educational services with their premises, teachers and equipment should be in the future so as to enable education policy to be implemented.
The Ministry of Education would like to thank all the schools heads, Zone Curriculum Advisors, Provincial Maintenance Officers, MOE staff and NSO staff that supported the School Mapping activities through completing the school mapping exercise, the information that has been captured using the GPS instrument is important for the mapping the future development of the education services.
Jesse Dick
Page | 4
About This Publication
This publication aims to provide information about the school age population and location of all inhabited schools in Vanuatu based on the 2011 VEMIS Enrolment Workbook Analysis and the 2009 National Population and Household Census conducted by the National Statistic Office (NSO). This publication was possible through the School Mapping project undertaken by the Policy and Planning Division through Vanuatu Education Road Map (VERM), and the National Statistic Office (NSO) which enabled us to understand better our school census data and with NSO technical assistance in finalizing this publication.
Village locations were derived from the Vanuatu Population Geographical Information System (PopGIS). The School locations were up to date using the Global Positioning System (GPS). This mapping report shows school location at island level rather than NSO Enumerated area. This is because School Mapping has created new school zoning using the existing Area Councils and Island boundaries which are used mostly for sub regional planning.
For each school, the numbers of females, males and total school population enumerated in the 2011 VEMIS Survey and the 2009 National population and Household Census. The information provided in this publication will be useful in economic and planning purposes especially at sub national level.
Access to services such as roads, villages and schools airstrip and beach landings can be found also in this Publication. While other services like airport, beach landing and health facilities are available, we are unable to show them here as we do not have an up to date list.
Maps are created at different scales with the projection of longitude/latitude (WGS 84). Users of this publication are advised to note that the boundaries contained in this publication refer to administrative boundaries used in the 2009 Population and Housing Census and they do NOT represent exact legal and customary boundaries.
I would like to take this opportunity to thank all those who have contributed to the production especially the Policy and Planning Team, Examination & Assessment Staff, Provincial Education Officers, Zone Curriculum Advisors, Provincial Maintenance Officers, and the NSO Staff for their continuous support and the VERM Donor Pool Partners for their support towards this school mapping activity.
John Niroa
Page | 5
Page | 6
Abbreviations
ACOM Anglican Church of Melanesia
ACV Apostolic Church Vanuatu
AOG Assemblies of God
ECCE Early Childhood Care & Education
ECE Early Childhood Education
FBTP Field Base Training Program
FELP La Federation de l’ Enseignement Libre Protestant
FTE Full Time Equivalent
GER Gross Enrolment Rate
GPS Global Positioning System
NTCU Neil Thomas Christian University
NSO National Statistics Office
PEB Provincial Education Board
PRESB Presbyterian Education Authority
PTR Pupil Teacher Ratio
PVIS Port Vila International School
SDA Seventh Day Adventist
UR Utilization Rate
VECCE Vanuatu Early Childhood & Care Education
Page | 7
Section 1: Definitions, Norms and Standards
Definitions of Terms
Early Childhood Care Education - Early Childhood Care Education (ECCE) Centers in this Policy will be referred to as pre-school or Kindergarten. At present in Vanuatu Early Childhood Care & Education [ECCE] is synonymous with Pre-School [4 - 6 year olds]. However, internationally the term ECCE is used to describe the education and the care of the child from birth to 8 years of age.
Kindergarten and Pre School – These terms are often used to describe a school that children attend before they go into formal education. They provide a half-day program 5 days per week for children 3 – 6 years.
Pre-Schools are established by communities, churches or are privately owned. Some pre schools are attached to primary schools and located on their premises. These are managed by the school PTA committee or a separate committee is formed.
Primary Education comprises Years 1 – 6.
Secondary Education comprises Years 7 to 13 and can be divided into the following categories; a community secondary or center school comprising Years 7 to 8; junior secondary comprising Years 8 to 10 and senior secondary comprising Years 11 to 13.
Pre-School Enrolment Age No child under 3 years of age should be enrolled in a Pre-School, thus allowing only children who have already turned 3 years to attend. No child aged 7 or more may attend or be enrolled at a Pre-School. The ideal age of entry to preschool is 4 years and children should be 6 years by March to enter Year 1 in Primary School
Page | 8
Class Size
“The first standard relates to the size of a class – defined as a group of pupils who are taught the same subject together. It is generally acknowledged that the greater the numbers of pupils in a class the worse are the educational conditions” (Caillods, page 4, 2009)
A: Early Childhood Education
According to the Vanuatu Early Childhood Care and Education Policy 2010 “there must be a minimum of fifteen (15) children enrolled at a pre-school with a maximum of 30 children attending at one time”.
B: Primary Education
The teacher-student ratio as specified under the Regulation Order No. 44 of 2005 is 1:30 for a primary school (years 1 – 6) and 1:25 for Years 7 – 8 which gives us an hint that at least a total of 30 pupils should be enroll in each year level (1 – 6) and 25 pupils maximum to be enroll in years 7 and 8.
C: Community Secondary Education or Center School
The teacher-student ratio as specified under the Regulation Order No. 44 of 2005 is 1:25 for Years 7 – 8 which tell us that least a total of 25 pupils should be enroll in each Year 7 and Year 8.
D: Secondary Education
“The problem of determining the minimum size for a school is encountered again in secondary education, but in even more complex form in that the teachers are subject specialists and sometimes they are specialized premises, such as laboratories and workshops”. (Caillods, page 7, 2009)
Page | 9
1. Summary of Total Acceptable School Age Population, School Type, Gender and School by Province - Torba Province
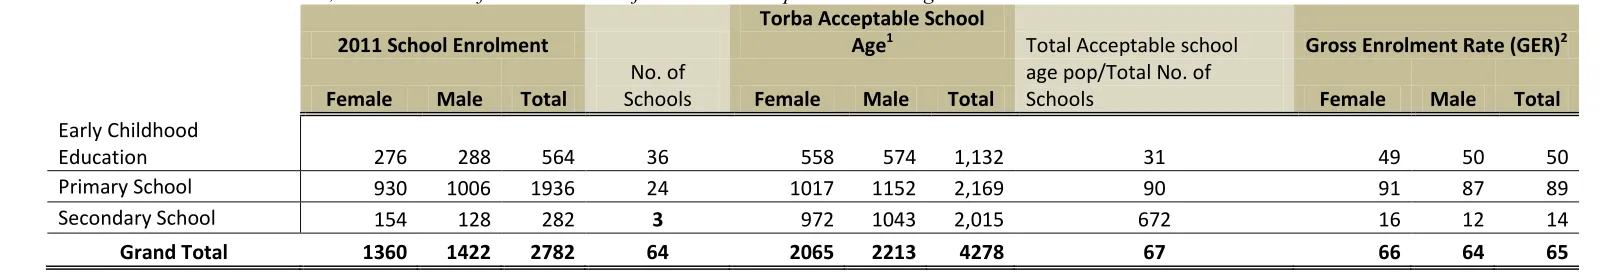
Table 1: Torba 2011 Enrolment, Total Number of schools and Projected 2011 Acceptable School Age
2011 School Enrolment
Torba Acceptable School
Age1 Total Acceptable school Gross Enrolment Rate (GER)2
Female Male Total
No. of
Schools Female Male Total
age pop/Total No. of
Schools Female Male Total
Early Childhood
Education 276 288 564 36 558 574 1,132 31 49 50 50
Primary School 930 1006 1936 24 1017 1152 2,169 90 91 87 89
Secondary School 154 128 282 3 972 1043 2,015 672 16 12 14
Grand Total 1360 1422 2782 64 2065 2213 4278 67 66 64 65
(Source: VEMIS Analysis Workbook on Enrolment & School Count 2011 & NSO 2009 Census Basic Table Reports pages iv & 24)
1.1. A: Early Childhood Education
Torba 2011 ECE total enrolment is at 564 which enrolled in 36 ECE schools. Given the projected acceptable ECE population age at a total of 1,132 kids aged between 3 to 6 years old over the total number of ECE schools in that province gives us a picture of 31 pupils in total attending an ECE school. When looking more closely at the GER, approximately 50% of the total projected 2011 ECE school age population are enrolled in school, meaning there is still work to be done in making sure that the other 50% are enroll in an ECE. If we are to abide with the VECCE Policy standard in ECE enrolment then there is still need to engage with the rural Torba communities to ensure that 50% not in school yet have to enroll in an ECE.
1 2011 Torba Projection Population based on 2009 Census Basic Tables Reports page 24 and Torba annual pop growth rate of 1.9 using this calculation formula =EXP(0.019*2.6)*2009 base Torba population. Note that 2.6 is
the number of years starting 2009 to 2011 which is 2 years exactly and 0.6 is the mid month of the year (June).
Page | 10
1.1. B: Primary Education
Torba 2011 primary enrolment3 is at 1,936 enrolled in 24 primary schools (Eighteen schools with years 1-6 and six schools with years 1-8)4. The 2011 projected school age population of acceptable ages 6 to 13 is at 2,169 over the total number of primary schools, which illustrated an approximate of 90 pupils to be enrolled in each primary school. Given the fact that a class should accommodate at least 30 pupils then a full cycle of primary years 1 – 6 should be of 180 pupils. In the case where classes 7 & 8 are still attached to some primary school then a full cycle should accommodate a total of 230 pupils from single classes 1 – 8.
The Primary School Gross Enrolment Rate (GER) is at 89% of which 11% of the primary acceptable school age populations are not yet in school. The indicator of 90 pupils per school illustrated that to accommodate a full primary years 1 – 8 with a total of 230 pupils per school portrait a picture of approximately 140 spaces available in the existing 24 schools that should be use to accommodate the 11% of the school age population who are not yet in school.
1.1.C: Secondary Education
Torba 2011 secondary enrolment5 is at 282 enrolled in 3 secondary schools. The 2011 projected secondary school age population ages 12 – 20 is at 2,015 over the total number of secondary schools indicated an approximate of 672 pupils per school. According to the Regulation Order No. 44 of 2005 specified that a secondary single class is of 25 pupils, then a full cycle of junior secondary, years 7 – 10 should at least be 100 pupils. If we are to include the senior cycle, in the case of Torba; a full secondary cycle should be 150 pupils (Year 7 -12) per school. Therefore an estimated total of 350 pupils should be enrolling in all 3 schools of Torba Province with 100 pupils each in two junior secondary schools and 150 in one senior secondary school. If we are to use the indicator of 672 pupils per school, the schools will be overcrowded because a complete secondary cycle of the 3 school is at 350 pupils in total. Therefore if we are to include all school age population to attend a secondary cycle, an estimate of 3226 spaces is yet to be created.
The Gross Enrolment Rate (GER) is at 14% which tells us that 86% of the acceptable school age populations are not enrolling in school. Currently we have a total of 282 who are enrolled in the 3 secondary schools, telling us that there are 68 spaces available still in all existing secondary schools. However, there is still need to accommodate the remaining 2547 pupils. There are other factors that contribute to children not accessing secondary education apart from available spaces in schools and examination results.
3 Primary enrolment 2011 includes years 1 - 8
4 2012 MOE Register of schools by Torba PEB & Colwyn Dingley 5 Secondary enrolment 2011 includes years 7 -13/14
6672 pupils per schools – 350 (standard pupil in all 3 secondary schools) = 322 spaces needed
Page | 11
2. Summary of Total Acceptable School Age Population, School Type, Gender and School by Province - Sanma Province
Table 2: Sanma 2011 Enrolment, Total Number of schools and Projected 2011 Acceptable School Age
2011 School Enrolment
Sanma Acceptable School
Age Total Acceptable school
Gross Enrolment Rate (GER)
Female Male Total
No. of
Schools Female Male Total
age pop/Total No. of
Schools Female Male Total
Early Childhood
Education 1408 1481 2889 145 2436 2712 5,148 36 58 55 56
Primary School 4497 5074 9571 95 4,618 5,197 9,816 103 97 98 98
Secondary School 1340 1423 2763 16 4,824 4,887 9,710 607 28 29 28
Grand Total 7245 7978 15223 256 11878 12796 24,674 96 61 62 62
(Source: VEMIS Analysis Workbook on Enrolment & School Count 2011 & NSO 2009 Census Basic Table Reports pages iv & 24)
2.1. A: Early Childhood Education
Page | 12
2.2.B: Primary Education
Sanma 2011 primary enrolment8 is at 9,571 enrolled in 95 primary schools (Eighty-three schools with years 1-6 and twelve schools with years 1-8)9. The 2011 projected school age population of acceptable ages 6 to 13 is at 9,816 over the total number of primary schools, which illustrated an approximate of 103 pupils to be enrolled in each primary school. Given the fact that a class should accommodate at least 30 pupils then a full cycle of primary years 1 – 6 should be of 180 pupils. In the case where classes 7 & 8 are still attached to some primary school then a full cycle should accommodate a total of 230 pupils from single classes 1 – 8.
The Primary School Gross Enrolment Rate (GER) is at 98% of which about 2% of the primary acceptable school age populations are not yet in school. The indicator of 103 pupils per school illustrated that to accommodate a full primary years of 1 – 6 with a total of 180 pupils per school and years 1 – 8 with a total of 230 pupils per school portrait a picture of approximately 20410spaces available in the existing 95
schools that should be use to accommodate the 2% of the school age population who are not yet in school.
2.3. C: Secondary Education
Sanma 2011 secondary enrolment11 is at 2,763 enrolled in 16 secondary schools. The
2011 projected secondary school age population ages 12 – 20 is at 9,710 over the total number of secondary schools indicated an approximate of 607 pupils per school. According to the Regulation Order No. 44 of 2005 specified that a secondary class is of 25 pupils, then a full cycle of junior secondary, years 7 – 10 should at least be 100 pupils. If we are to include the senior cycle, in sanma’s case a full secondary cycle should be 150 pupils (Year 7 -12) or 175 pupils (Year 7 – 13) per school.
Therefore an estimated total of 2,000 pupils should be enrolling in all 16 schools of Sanma Province with 100 pupils each in nine junior secondary schools and 150 pupils each in the five senior secondary school offering Years 7 – 12 and 175 pupils in two senior secondary schools offering Years 7 - 13. If we are to use the indicator of 607 pupils per school, the schools will be overcrowded because a complete secondary cycle in the 16 secondary school is at 2,000 pupils in total. Therefore if we are to include all school age population to attend a secondary cycle, an estimate of 1,39312 spaces is yet to be created.
The Gross Enrolment Rate (GER) is at 28% which tells us that 72% of the acceptable school age populations are currently not enrolling in schools. In 2011 Sanma Province has a total of 2,763 pupils enrolled in the 16 secondary schools, which is telling us that the Sanma secondary schools are currently overcrowded by 76313 pupils.
There are other factors that contribute to children not accessing secondary education apart from available spaces in schools and examination results.
8 Primary enrolment 2011 includes years 1 - 8
9 2012 MOE Register of schools by Sanma PEB, & Catholic
10 Years 1 – 6 (180-103 = 77 available spaces) Years 1 – 8 (230 – 103 = 127 available spaces). Total Available spaces : 77+127 = 204
11 Secondary enrolment 2011 includes years 7 -13/14
Page | 13
3. Summary of Total Acceptable School Age Population, School Type, Gender and School by Province - Penama Province
Table 3: Penama 2011 Enrolment, Total Number of schools and Projected 2011 Acceptable School Age
2011 School Enrolment Penama Acceptable School Age Total Acceptable school Gross Enrolment Rate (GER)
Female Male Total No. of Schools Female Male Total age pop/Total No. of Schools Female Male Total
Early Childhood Education 700 765 1465 78 1754 1777 3,531 45 40 43 41
Primary School 3024 3339 6363 64 3,240 3,485 6,725 105 93 96 95
Secondary School 828 789 1617 13 3,053 3,296 6,349 488 27 24 25
Grand Total 4552 4893 9445 155 8,047 8558 16605 107 57 57 57
(Source: VEMIS Analysis Workbook on Enrolment & School Count 2011 & NSO 2009 Census Basic Table Reports pages iv & 24)
3.1. A: Early Childhood Education
Penama 2011 ECE total enrolment is at 1,465 which enrolled in 78 ECE schools. Given the projected acceptable ECE population age at a total of 3,531 kids aged between 3 to 6 years old over the total number of ECE schools in that province gives us a picture of 45 pupils in total attending an ECE school. When looking more closely at the GER, approximately 41% of the total projected 2011 ECE school age population are enrolled in school, meaning there is still work to be done in making sure that the other 59% are enroll in an ECE.
3.2 B: Primary Education
Penama 2011 primary enrolment14 is at 6,363 enrolled in 64 primary schools. The 2011 projected school age population of acceptable ages 6 to 13 is at 6,725 over the total number of primary schools, which illustrated an approximate of 105 pupils enrolled in each primary school. Given the fact that a class should accommodate at least 30 pupils then a full cycle of primary years 1 – 6 should be of 180 pupils. In the case where classes 7 & 8 are still attached to some primary school then a full cycle should accommodate a total of 230 pupils from single classes 1 – 8.
Page | 14
The Primary School Gross Enrolment Rate (GER) is at 95% of which 5% of the primary acceptable school age populations are not yet in school. The indicator of 105 pupils per school illustrated that to accommodate a full primary years 1 – 6 with a total of 180 pupils per school and a total of 230 pupils in 4 schools offering Years 1 - 8 portrait a picture of approximately 30515 spaces available in the existing 64 schools that should be use to accommodate the 5% of the school age population who are not yet in school.
3.3C: Secondary Education
Penama 2011 secondary enrolment16 is at 1,617 enrolled in 13 secondary schools. The 2011 projected secondary school age population ages 12 – 20 is at 6,349 over the total number of secondary schools indicated an approximate of 488 pupils per school. According to the Regulation Order No. 44 of 2005 specified that a secondary class is of 25 pupils, then a full cycle of junior secondary, years 7 – 10 should at least be 100 pupils. If we are to include the senior cycle, in the case of the Penama Province, a full secondary cycle should be 150 pupils (Year 7 -12) or 175 pupils (Years 7 – 13) per school.
Therefore an estimated total of 1,525 pupils should be enrolling in all 13 schools of Penama Province with 100 pupils each in nine junior secondary schools and 150 in the three senior secondary school offering Years 7 – 12 and 175 in one senior secondary school with Years 7 - 13. If we are to use the indicator of 488 pupils per school, the schools will be overcrowded because a complete secondary cycle in the 13 secondary school is at 1,525 pupils in total. Therefore if we are to include all school age population to attend a secondary cycle, an estimate of 1,03717 spaces is yet to be created.
The Gross Enrolment Rate (GER) is at 25% which tells us that 75% of the acceptable school age populations are currently not enrolling in schools. In 2011 Penama Province has a total of 1,617 pupils enrolled in the 13 secondary schools, which is telling us that the Penama secondary schools are currently overcrowded by 9218 pupils. There are other factors that contribute to children not accessing secondary education apart from available spaces in schools and examination results.
15 Years 1 – 6 (180) + Years 1 – 8 (230) = 410 pupils – 105 = 305 available spaces 16 Secondary enrolment 2011 includes years 7 -13/14
Page | 15
4 Summary of Total Acceptable School Age Population, School Type, Gender and School by Province - Malampa Province
Table 4: Malampa 2011 Enrolment, Total Number of schools and Projected 2011 Acceptable School Age
2011 School Enrolment
Malampa Acceptable School
Age Total Acceptable school
Gross Enrolment Rate (GER)
Female Male Total
No. of
Schools Female Male Total
age pop/Total No. of
Schools Female Male Total
Early Childhood
Education 894 1020 1914 107 1891 2151 4,042 38 47 47 47
Primary School 3664 4177 7841 86 3,669 4,202 7,871 92 100 99 100
Secondary School 857 846 1703 16 3,446 3,602 7,047 440 25 23 24
Grand Total 5415 6043 11458 209 9,006 9955 18,960 91 60 61 60
(Source: VEMIS Analysis Workbook on Enrolment & School Count 2011 & NSO 2009 Census Basic Table Reports pages iv & 24)
4.1. A: Early Childhood Education
Malampa 2011 ECE total enrolment is at 1,914 which enrolled in 107 ECE schools. Given the projected acceptable ECE population age at a total of 4,042 kids aged between 3 to 6 years old over the total number of ECE schools in that province gives us a picture of 38 pupils in total attending an ECE school. When looking more closely at the GER, approximately 47% of the total projected 2011 ECE school age population are enrolled in school, meaning there is still work to be done in making sure that the other 53% are enroll in an ECE.
4.2. B: Primary Education
Malampa 2011 primary enrolment19 is at 7,841 enrolled in 86 primary schools (Seven-nine schools with years 1-6 and seven schools with years 1-8)20.
19 Primary enrolment 2011 includes years 1 - 8
Page | 16
The 2011 projected school age population of acceptable ages 6 to 13 is at 7,871 over the total number of primary schools, which illustrated an approximate of 92 pupils enrolled in each primary school. Given the fact that a class should accommodate at least 30 pupils then a full cycle of primary years 1 – 6 should be of 180 pupils. In the case where classes 7 & 8 are still attached to some primary school then a full cycle should accommodate a total of 230 pupils from single classes 1 – 8.
The Primary School Gross Enrolment Rate (GER) is at 100% which indicated that most of Malampa primary acceptable school age populations are enrolled in school. The indicator of 88 pupils per school illustrated that to accommodate a full primary years 1 – 6 with a total of 180 pupils and Years 1 – 8 with 230 pupils per school portrays a picture of enough spaces available in the existing 89 schools.
4.3. C: Secondary Education
Malampa 2011 secondary enrolment21 is at 1,703 enrolled in 16 secondary schools. The 2011 projected secondary school age population ages 12 – 20 is at 7,047 over the total number of secondary schools indicated an approximate of 415 pupils per school. According to the Regulation Order No. 44 of 2005 specified that a secondary class is of 25 pupils, then a full cycle of junior secondary, years 7 – 10 should at least be 100 pupils. If we are to include the senior cycle, in Malampa’s case a full secondary cycle should be 150 pupils (Year 7 -12) and 175 pupils (Years 7 – 13) per school. Therefore an estimated total of 1,775 pupils should be enrolling in all 16 schools of Malampa Province with 100 pupils each in thirteen junior secondary schools and 150 in two senior secondary school offering Years 7 – 12 and 175 pupils in one senior secondary offering Years 7 - 13. If we are to use the indicator of 440 pupils per school, the schools will be overcrowded because a complete secondary cycle of the 16 school is at 1,775 pupils in total. Therefore if we are to include all school age population to attend a secondary cycle, an estimate of 1,33522 spaces is yet to be created.
The Gross Enrolment Rate (GER) is at 24% which tells us that 76% of the acceptable school age populations are not enrolling in school. Currently we have a total of 1,703 who are enrolled in the 16 secondary schools, telling us that there are 72 spaces available still in all existing secondary schools. However, there is still need to accommodate the remaining 1,26323 pupils. There are other factors that contribute to children not accessing secondary education apart from available spaces in schools and examination results.
21 Secondary enrolment 2011 includes years 7 -13/14
Page | 17
5. Summary of Total Acceptable School Age Population, School Type, Gender and School by Province - Shefa Province
Table 5: Shefa 2011 Enrolment, Total Number of schools and Projected 2011 Acceptable School Age
2011 School Enrolment Shefa Acceptable School Age Total Acceptable school Gross Enrolment Rate (GER)
Female Male Total No. of Schools Female Male Total age pop/Total No. of Schools Female Male Total
Early Childhood Education 1254 1344 2598 76 3583 3801 7,383 97 35 35 35
Primary School 6225 6696 12921 82 6,629 7,174 13,803 168 94 93 94
Secondary School 2746 2660 5406 24 8,208 8,389 16,597 692 33 32 33
Grand Total 10225 10700 20925 182 18,420 19364 37,783 208 56 55 55
(Source: VEMIS Analysis Workbook on Enrolment & School Count 2011 & NSO 2009 Census Basic Table Reports pages iv & 24)
5.1. A: Early Childhood Education
Shefa 2011 ECE total enrolment is at 2,598 which enrolled in 76 ECE schools. Given the projected acceptable ECE population age at a total of 7,383 kids aged between 3 to 6 years old over the total number of ECE schools in that province gives us a picture of 97 pupils in total attending an ECE school. When looking more closely at the GER, approximately 35% of the total projected 2011 ECE school age population are enrolled in school, meaning there is still work to be done in making sure that the other 65% are enroll in an ECE.
5.2. B: Primary Education
Shefa 2011 primary enrolment24 is at 12,921 enrolled in 82 primary schools (sixty-two schools with years 1-6 and twenty schools with years 1-8)25. The
2011 projected school age population of acceptable ages 6 to 13 is at 13,803 over the total number of primary schools, which illustrated an
24 Primary enrolment 2011 includes years 1 - 8
Page | 18
approximate of 168 pupils enrolled in each primary school. Given the fact that a class should accommodate at least 30 pupils then a full cycle of primary years 1 – 6 should be of 180 pupils. In the case where classes 7 & 8 are still attached to some primary school then a full cycle should accommodate a total of 230 pupils from single classes 1 – 8.
The Primary School Gross Enrolment Rate (GER) is at 94% of which 6% of the primary acceptable school age populations are not yet in school. The indicator of 168 pupils per school illustrated that to accommodate a full primary years 1 – 6 with a total of 180 pupils and Years 1 – 8 with a total of 230 pupils per school portrait a picture of approximately 7426 spaces available in the existing 82 schools that should
be use to accommodate the 6% of the school age population who are not yet in school.
5.3. C: Secondary Education
Shefa 2011 secondary enrolment27is at 5,406 enrolled in 24 secondary schools. The
2011 projected secondary school age population ages 12 – 20 is at 16,597 over the total number of secondary schools indicated an approximate of 692 pupils per school. According to the Regulation Order No. 44 of 2005 specified that a secondary class is of 25 pupils, then a full cycle of junior secondary, years 7 – 10 should at least be 100 pupils. If we are to include the senior cycle, in the case of Shefa Province, a full junior secondary cycle should be 100 pupils (Year 7 -10), 150 pupils in senior secondary offering Years 7 – 12 and 175 pupils in senior secondary school offering Years 7 – 13/14 per school. Therefore an estimated total of 3,150 pupils should be enrolling in all 24 schools of Shefa Province with 100 pupils each in thirteen junior secondary schools and 150 pupils in the five senior secondary offering Years 7 - 12 and 175 pupils each in four senior secondary school offering Years 7 – 13/14. If we are to use the indicator of 692 pupils per school, the schools will be overcrowded because a complete secondary cycle of the 24 school is at 3,150 pupils in total. Therefore if we are to include all school age population to attend a secondary cycle, an estimate of 2,45828 spaces is yet to be created.
The Gross Enrolment Rate (GER) is at 33% which tells us that 67% of the acceptable school age populations are not enrolling in school. Currently we have a total of 5,406 who are enrolled in the 24 secondary schools, telling us that there are no available spaces in all existing secondary schools. There are other factors that contribute to children not accessing secondary education apart from available spaces in schools and examination results.
26 Years 1 – 6 (180-168 = 12 available spaces) and Years 1 – 8 (230-168 = 62 available spaces), therefore 12 + 62 = 74 available spaces in total in 82 primary schools
27 Secondary enrolment 2011 includes years 7 -13/14
Page | 19
6. Summary of Total Acceptable School Age Population, School Type, Gender and School by Province - Tafea Province
Table 6: Tafea 2011 Enrolment, Total Number of schools and Projected 2011 Acceptable School Age
2011 School Enrolment
Tafea Acceptable School
Age Total Acceptable school
Gross Enrolment Rate (GER)
Female Male Total
No. of
Schools Female Male Total
age pop/Total No. of
Schools Female Male Total
Early Childhood
Education 1049 1122 2171 101 1979 2211 4,190 41 53 51 52
Primary School 3860 4371 8231 76 3,788 4,193 7,981 105 102 104 103
Secondary School 867 889 1756 15 3,020 3,048 6,068 405 29 29 29
Grand Total 5776 6382 12158 192 8,787 9452 18,239 95 66 68 67
(Source: VEMIS Analysis Workbook on Enrolment & School Count 2011 & NSO 2009 Census Basic Table Reports pages iv & 24)
6.1. A: Early Childhood Education
Tafea 2011 ECE total enrolment is at 2,171 which enrolled in 101 ECE schools. Given the projected acceptable ECE population age at a total of 4,190 kids aged between 3 to 6 years old over the total number of ECE schools in that province gives us a picture of 41 pupils in total attending an ECE school. When looking more closely at the GER, approximately 52% of the total projected 2011 ECE school age population are enrolled in school, meaning there is still work to be done in making sure that the other 48% are enroll in an ECE.
6.2.B: Primary Education
Tafea 2011 primary enrolment29 is at 8,231 enrolled in 76 primary schools (Seventy-two schools with years 1-6 and four schools with years 1-8)30. The 2011 projected school age population of acceptable ages 6 to 13 is at 7,981 over the total number of primary schools, which illustrated an approximate of 105 pupils enrolled in each primary school. Given the fact that a class should accommodate at least 30 pupils then a full cycle of
29 Primary enrolment 2011 includes years 1 - 8
Page | 20
primary years 1 – 6 should be of 180 pupils. In the case where classes 7 & 8 are still attached to some primary school then a full cycle should accommodate a total of 230 pupils from single classes 1 – 8.
The Primary School Gross Enrolment Rate (GER) is at 103% of which indicated that most of the primary acceptable school age populations are in school. The indicator of 105 pupils per school illustrated that to accommodate a full primary years 1 – 6 with a total of 180 pupils and Years 1 – 8 with 230 pupils per school portrait a picture of approximately 20031 spaces available in the existing 76 schools.
C: Secondary Education
Tafea 2011 secondary enrolment32 is at 1,756 enrolled in 15 secondary schools. The
2011 projected secondary school age population ages 12 – 20 is at 6,068 over the total number of secondary schools indicated an approximate of 405 pupils per school.
According to the Regulation Order No. 44 of 2005 specified that a secondary class is of 25 pupils, then a full cycle of junior secondary, years 7 – 10 should at least be 100 pupils. If we are to include the senior cycle, in Tafea’s case a full secondary cycle should be 100 pupils (Years 7 – 10), 150 pupils (Year 7 -12) and 175 pupils (Years 7 – 13) per school.
Therefore an estimated total of 1,800 pupils should be enrolling in all 15 schools of Tafea Province with 100 pupils each in ten junior secondary schools and 150 in three senior secondary school offering Years 7 – 12 and 175 in two senior secondary schools offering Years 7 - 13. If we are to use the indicator of 405 pupils per school, the schools will be overcrowded because a complete secondary cycle of the 15 school is at 1,800 pupils in total. Therefore if we are to include all school age population to attend a secondary cycle, an estimate of 1,39533 spaces is yet to be
created.
The Gross Enrolment Rate (GER) is at 29% which tells us that 71% of the acceptable school age populations are not enrolling in school. Currently we have a total of 1,756 who are enrolled in the 15 secondary schools, telling us that there are 4434 spaces available still in all existing secondary schools. However, there is still need to accommodate the remaining 1,35135 pupils. There are other factors that contribute to
children not accessing secondary education apart from available spaces in schools and examination results.
31Years 1 – 6 (180 – 105 = 75 available spaces) & Years 1 – 8 (230 – 105 = 125 available spaces) which total to
200 available spaces in existing 76 primary schools
32 Secondary enrolment 2011 includes years 7 -13/14
Page | 21
Standard Size
Caillods 2009 explained that “a standard size for a school is one which, while ensuring good educational conditions, enables full use to be made of teachers and premises”. (Caillods, Page 8, 2009)
A. Early Childhood Education
If the minimum standard number of pupils per class is 15, with a maximum of 30, according to the Early Childhood Care and Education Policy, 2010 stated that “the ECCE centers shall have a minimum teacher/child ratio of 1:15 and maximum child ratio and classroom ratio for children 3 – 6 years is 1:30”.
“Pre-school buildings can be permanent, semi-permanent or traditional thatched house but it should be structurally sound, well ventilated with adequate windows and two doors for easy evacuation or access in case of emergency. There must be plenty of space both indoors and outdoors. Allow at least 2 square meters per child indoors and 5 square meters per child outdoors. The minimum size for the building should be 10m x 7m; or 18m x 7m; or 7m x 7m depending on the environment” (ECCE Policy, page 17, 2010).
Given that scenario of more than 25 pupils in class, then the management must appoint an assistant preferably with a certificate from the Field Based Training Program (FBTP). When an assistant is not available then an unqualified teacher can be recruited but must enroll in the FBTP after one year of teaching practice. Otherwise a parent helper’s roster must be organized, so that one adult helps the teacher each day. Such parent helpers must attend a workshop session with the teacher before assisting in the pre-school.
The VECCE Policy 2010 stated that “the hours of instruction for ECCE centers shall be 4 hours in the morning session (7:30 am – 11:30 am) for older children ages 5 – 6 years old and 2 hours in the afternoon session (1:30 pm – 3:30 pm) for smaller children ages 3 – 4 years”. Therefore the standard hour per week for ECCE is at 30.
B. Primary Education
“In school mapping at the primary level, the main thing is to find out how many classes should be allowed for in the different grades so as to have satisfactory class size” (Caillods, page 8, 2009)
According to the Ministry of Education Register of Schools 2012, The Ministry of Education has registered 426 primary schools in total with 382 primary schools offering grades 1 to 6 and 44 primary schools offering grades 1 to 8. If the promotion between grades were automatic, then the standard school size could be;
Grade 1 – 6 is of 6 classes with 180 pupils Grade 1 – 8 is of 8 classes with 230 pupils.
Page | 22
C. Secondary Education
“The problem of determining standard sizes is more complex in secondary education owing to the existence of different streams, more diversified school buildings and teachers who are subject specialists” (Caillods, page 10, 2009)
“To reach the decision on standard size one needs to start from curricular for the various grades, taking to account of the options possible and of the necessary splitting up of classes into groups” (Caillods, page 10, 2009).
In 2012 the Ministry of Education has registered 86 secondary schools, fifty-seven school with years 7 to 10; nineteen schools offerings Years 7 - 12 and ten schools offering senior cycle of Years 7 to 13.
Section 2: Catchment Areas
Let us recall the “school catchment area”; that is the geographical area served by a school. Usually you will find that with Early Childhood Care and Education and primary education the catchment area is determined by the distance which children can walk between home and school, i.e. a few kilometers.
The idea of a catchment area may be considered from the point of view description, theory or regulation.
From the theoretical point of view “the catchment area may be thought of a circle having its center an existing or potential school, and as its radius the maximum distance which pupil can travel. If we know the density of the potential school age population, we can calculate the numbers for whom schooling should be provided within this catchment area”. (Caillods, page 14, 2009)
The legal and regulatory aspect concerns the “requirement that all children living in a given geographic area should attend the school or schools in that area. However this is in fact very difficult to plan the provision to be made in a given area if pupils are free to select whatever school they like whether inside or outside the area, or if the schools in which they enroll have no connection with their places of residence”. (Caillods, page 17, 2009)
If the catchment area A of a school is a circle with a radius r (5km for secondary and center school; 3 km for primary school and 1.5 km for pre-school) then the maximum distance from home to school (in km), the area of this catchment area will be;
Page | 23
Formula: Density = Potential Enrolment 3.14 x 1.52(r2)
ECE Minimum density of school population aged 3 – 6, that pupils should not have to travel more than 1.5km to get to school.
ECE Calculation: 30 maximum attending at one time 3.14 x 1.52
= 30 3.14 x 2.25
= 30 7.1
Density = 4.2 (4) pupils per sq. km.
If the VECC Policy to have maximum of 30 pupils in a class, the extend of the catchment area will be:
3.14 x r2 = 3.14 x 2.25 = 7.065 sq.km
The number of pupils = 7.065 x 4 (average density of children) = 28 The number of classes = 28/30 = 0.9333 or 1
Hence: an ECE center with one class.
Primary Minimum density of school population aged 6 – 12 (classes 1 – 6) that pupils should not have to travel more than 3km to get to school
Primary Calculation: 180 (full cycle of primary 1 – 6 with 30 pupils each class 3.14 x 32
= 180 3.14 x 9
= 180 28.26
Density = 6 pupils per sq. km.
If 180 pupils is the minimum size of Primary School (1 – 6), no school can be opened in rural areas with less than 6 pupils (aged 6 - 12) per sq. km.
If the Regulation Order no. 44 of 2005 to have maximum of 30 pupils in a class, the extend of the catchment area will be:
3.14 x r2 = 3.14 x 9 = 28.26 sq.km
The number of pupils = 28.26 x 6 (average density of children) = 169.56
The number of classes = 169.56/30
Page | 24
Primary Minimum density of school population aged 6 – 14 (classes 1 – 8)
Primary Calculation: 230 (full cycle of primary 1 – 8 with 30 pupils each class 1 – 6 & 25 pupils in 7 - 8 3.14 x 52
= 240 3.14 x 25
= 240 78.5
Density = 3 pupils per sq. km.
If 230 pupils is the minimum size of Primary School (1 – 8), no school can be opened in rural areas with less than 3 pupils (aged 6 - 14) per sq. km.
If the Regulation Order no. 44 of 2005 to have maximum of 30 pupils in a classes 1 – 6 and 25 pupils in years 7 and 8, the extend of the catchment area will be:
3.14 x r2 = 3.14 x 25 = 78.5 sq.km
The number of pupils = 78.5 x 3 (average density of children) = 236 (plus 1 or 2 more pupils) The number of classes = 236/30
Hence: a primary school offering years 1 – 6 with 8 classes.
Junior Secondary Minimum density of school population aged 13 – 16 (classes 7 – 10)
Secondary Calculation: 100 (full cycle of primary 7 – 10 with 25 pupils each class) 3.14 x 52
= 100 3.14 x 25
= 150 78.5
Density = 1 pupil per sq. km.
If 100 pupils is the minimum size of Junior Secondary School (7 – 10), no school can be opened in rural areas with less than 1 pupil (aged 13 - 16) per sq. km.
If the Regulation Order no. 44 of 2005 to have maximum of 25 pupils in a class, the extend of the catchment area will be:
3.14 x r2 = 3.14 x 25 = 78.5 sq.km
The number of pupils = 78.5 x 1 (average density of children) = 79 (plus 21 more pupils) The number of classes = 79/25
Hence: a primary school offering years 7 – 10 with 4 classes.
Senior Secondary Minimum density of school population aged 13 – 18 or 19 (classes 7 – 12)
Secondary Calculation: 175 (full cycle of primary 7 – 13/14 with 25 pupils each class) 3.14 x 52
= 175 3.14 x 25
= 175 78.5
Page | 25
Catchment Area 1: Torba Province
If 175 pupils is the minimum size of senior Secondary School (7 – 13/14), no school can be opened in rural areas with less than 2 pupil (aged 13 - 19) per sq. km.
If the Regulation Order no. 44 of 2005 to have maximum of 25 pupils in a class, the extend of the catchment area will be:
3.14 x r2 = 3.14 x 25 = 78.5 sq.km
The number of pupils = 78.5 x 2 (average density of children) = 157
The number of classes = 157/25
Page | 26
Map 1.1: TORBA: Torres Primary Schools; (Years 1 - 6)
HIU
1
Martin (49)
o
TEGUS
LOH
TOGA
Ba9Svegug (83)
o 5
"
Page | 27
Map 1.2: TORBA: Northen Banks Primary Schools; English & French (Years 1 - 6)
UREPARAPARA
VANUALAVA
o 5 10
,
1\
~-N
!
MOTA LAVA
'
'''0'
Ro"
Christian (24)~21
Page | 28
Map 1.4: TORBA: Mere Lava Primary SChools; English & French (Years 1 - 6)
N
,
o 5
Page | 29
Map 1.5: TORBA: Community Secondary Schools; English & French (Years 1 ·8)
G
·
b
Robin (41)~
H
~
o
5"
UREPARAPARA
VANUA LAVA
Sanlang
1"'1
GAUA
MOTA LAVA
.
,(F
'
''''
'
~
'"
1168)~
MOTA
Pasalele (144)
"," Mj'" (116)
(169)
Page | 30 Map 1.6:
o 5
TORBA: Secondary Schools; English & French (Years 7 -12)
UREPARAPARA
VANUA LAVA
"
. ,
'\,
.GAUA
MOTA LAVA
p
~
MOTAArep I Secondary (128)
'''''',''' S"",)<'," """'"
(77),
Page | 31
Page | 32
Map 2.1 SANMA: North West Santo Primary School; English & French (Years 1 • 6)
DaySpring ,",. _ _ _
o
"
Page | 33
o
o
o
o o
o
N
,
o
2
.
'
,
: -_ _ ~ .. Sanabas (Turte Bay) (75)
Page | 34 o
o o
'\)
8
J
Schools; English & French
o
Page | 36
& French 1
-o 2 4
Page | 38
Luganville (YP"" 1 - 8)
, " ... .i
o
o
N
,
o
12.5 25ldlometers
Page | 40
Map 2.8 Schools
o
9
1
o o
00
0 0
0'" 0
C
'
?J
o 3.5 7 ~iIometers
Page | 41
Page | 42 N
,
o
2.5 5Page | 43
N
,
o 2.5 5
Page | 44
PENAMA: Maewo Primary Schools; English & French (Years 1 -6)
N
,
Bakanao (Naviso)
(76)
Page | 45
3.4 PENAMA: North Pentecost Schools; French
169)
o 3.5 7 . . " , . . ,
Page | 46
Map
o
Revised June 2\)12
PENAMA: South Pentecost Primary Schools;
English & French
(Years 1 ·6)
StHeori
Page | 47
Map 3.6 PENAMA: Ambae, Maewo and Pentecost Community Secondary:
English (Years 1 - 8)
o 10 20
Sulua (97)
1
Page | 48
PENAMA: Ambae
P.evIsed june 2(112
Ii & French
SI. Patrick's College (317)
o 5
Page | 49
Map 3.8 PENAMA: Maewo Secondary School; English (Years 7 • 10)
N
,
o 5 10
Page | 50
Map 3.9
RevIsed June 2<112
Uo'
Mom"',"~"{50)
Melsisi
Schools;
& French
1
Ranwadi High ScmoI
o 00
o
5 10Page | 51
Page | 52
N
,
Revis&d June 2{112
: North Malekula Primary Schools; English & French;(Years 1 ·6)
o Co 0
o 3.5 7
~
...
i.,
Page | 53
Map 4.2 MALAMPA: Central Malekula
Primary Schools; English & French;(Years 1 - 6)
J';;;""lii"
(12)o
(47)
o
o 3.' 7
~i
oPage | 54
J,"'"",lii,, (12) Map 4.3 MALAMPA: South Malekula
Pr;n,a" Schools; Engl;sh & Fr.rlch:1
(47)
o
o
-""_(29)
Namaru (67)
Page | 55
MALAMPA: North Ambyrm Primary Schools; English & French (Years 1 -6)
N
!
o 1.5 3
Page | 56 Map 4.5
1
I
/
I
I
\
\
\
'\
MALAMPA: South West Ambym Primary Schools; English & French
(Years t - 6)
/
---/---
--~--~
Sanesup
(5) o
o
(52)
o 2.5 5
Lalinda
Page | 57
Map 4.6
(58)
(31)
MALAMPA: South East Ambym Primary Schools; English & French
(Years 1 ·6)
"
\
\
\
I
I
1
)
"
---
.-/
/
---~.-o 2.S 5
Page | 59
Schools; Ii
7-1
o
o
Maran!tha (41)
o 0
Page | 60
MALAMPA: Paama & French
1
•
o o
o
o o
o
0.75 1.5
o
Page | 61
Map 4.10 MALAMPA: Paarna Secondary Schools, English; (Years 7 -10)
o 0.5
~
"""""'
o
o
o o
o o 0
o
o 0
00
o o
I
o
{125}
o
o
o
o
o
Page | 62 Map 4.11
,p
MALAMPA: Malekula Community Secondary; English & French Years (1 ·8)
o 0
o
o
o o
~June2Q12
o
o
o 0
Page | 63 Map 4.12
tJ
o 0 o
o
"
MALAMPA: Malekula Secondary Schools; English & French
(Years 7 -12113)
Jean VKlii (Vaa)
;:';""'-1'32)
o
o
"
o
o 0
o
South ~est Bay
o
o
Page | 64
Page | 65
i
__
-1-""O"'- (109)
Lokopue (.8)-- -"1
Revised June 2012
Map 5.1: SHEFA: Epi Primary Schools; English & French (Years 1 - 6)
Maganua (Ngala) (62)
\ S, ... ~ Mats (74)
o
o ",""'o",\,,, (99)
o
,
Page | 66
o
o
,
kilometers
,.
i
o
Map 5.2: : Epi
English & French; (Years 1 - 8)
o
o o
Page | 67
o
,
kilometers
Rev;sed June 2012
o
Secondary Schools; English & French (Years 7 -12)
-
-7
-
£.
Secondary (231)1
o o
o
Page | 68
SHEFA: & & 1
-TONGOA
(142) N
Lakalaka (56)
!
(41 )
TONGARIKI
Coconak (93)
Ma"",
e
(28) MAKIRA
o
5Page | 69
SHEFA: School 1
-iiak" ~ (123)
BUNINGAt!!;>
EMAE o
~MAKIRA
MATASO
<\
o
,
Page | 70
Map 5.6: SHE FA: Tongoa & Shepherds; Secondary Schools English ; (Years 7 - 10)
Napangasale (113)
~
p TONGARIKIBUNINGA~ ..
e
o
Nofo Junior Secondary (83)
~MAKIRA
MATASO
C\
o
,
Page | 71
Map 5.7: SHEFA: EfateOff-Shore Island;
o o
o
o
T.,,,·." (72)
o
o
Primary Schools (Years 1 - 6)
""",~ .• (00)
1
o o
o 5
Page | 72
Map 5.8: SHEFA: Efate Off-Shore Island; Community Secondary Schools; English (Years 1 - 8)
Moso
o
o
Nguna Island
o o
o
North Efate
o
,
Pele Island
CJKakula
o o
o
o
Page | 73
5.9:
o
Port Vila Com","p'<Ycn,;.,"" (135)
lfira F~"", ('J3)_ j,
lfira English
Erakor (167)
°
1
,... ....
...,iiiiiiiiiiii . . ':... ... .;'" kilorroelersEfate Schools; English & 1
-,
)o
...
-+-Ma" ri~ (SO)o
o
o
Page | 74
5.10:
o
,
o
o Manus
... ")~, (365)
o
o
(221)
Rural Community Secondary
I English & French
4----E.~ (202)
.
"'"
Page | 75
o
o
Baptist
Col . . , 'l' Mootmartre
~~
o
Map 5.11: SHEFA: Efate Rural Secondary Schools;
i & French 7·1
~_"'
"
""'''rio<
Collegeo
---\
-o
Page | 79
Page | 80
Map 6.1: TAFEA: Erromango Primary School; English & French; Years 1 - 6
ERROMANGO
1
Port ","'ii" (92) o
o o o
Bay (66)
o
o
Page | 81
Map 6.2: TAFEA: Aniwa Primary School; English; Years 1 ·6
1
o
,
"
Page | 82
6.3:
1
Ishii!
,
,
"
Page | 83
6.4: TAFEA: Aneityum Primary School; English & French; Years 1 -6
ANEITYUM
''''''.OJ''''' (125)
o ,
Page | 84
Map 6.5: TAFEA: North Tanna Primary Schools; English & French (Years 1 -6)
1
{50)
o 2
Page | 85
o
TAFEA: Central Tanna;
Schools; English French,;
- 6)
Page | 86
!"""~ (94)1 M"p 6.7:
Iquaramanu (1 Manuapen (99)
-r'-
-
---1
H
m
"'"
(121)o
,
.
,
TAFEA: South Tanna;
Primary Schools;
English French; (Years 1 - 6)
Page | 87
Map 6,8: TAFEA: Tanna Outer Island Secondary Schools; English 17 -10)
o 15
_ _ _ :Ipota Junior Secondary School
- (74)
Teruja Junior Secondary ScIloo
1(87)
Ishia Juoa SecorKIary School
1"1
'Il
Page | 88
Map 6.9: TAFEA:Tanna Community Secondary Schools; English & French (1 - 8)
o 15
o
o
o
a#c;ool:
o 0 0o 0
o
00
o
(123)
o 0
00
1
Page | 89
Map 6.10: TAFEA: Tanna Secondary Schools; (7-13)
1
L"",p'", 1156)
o 15
Page | 90
Section 3: Summary Findings
3.1Summary Findings in TorbaTorba Early Childhood Education
Sections Standards Current Findings Gaps
1: Norms & Standards
1.1 Class Size The Vanuatu Early Childhood Care and Education Policy 2010:
“There must be a minimum of fifteen (15) children enrolled at a pre-school with a maximum of 30 children attending at one time”.
2011 Total Torba ECE enrolment: 564 (276 female & 288 male)
2011 total ECE schools: 36
Projected ECE school age population (4 – 7 years old): 1,132
Total acceptable school age divided by total number of ECE schools: 31
GER: 50%
50 % of ECE projected population not yet enroll in ECE schools
1.2 Standard Size The Vanuatu Early Childhood Care and Education Policy, 2010:
“The ECCE centers shall have a minimum teacher/child ratio of 1:15 and maximum child ratio and classroom ratio for children 3 – 6 years is 1:30”.
“The hours of instruction for ECCE centers shall be 4 hours in the morning session (7:30 am – 11:30 am) for older children ages 5 – 6 years old and 2 hours in the afternoon session (1:30 pm – 3:30 pm) for
2011 total ECE schools: 36
Page | 91
smaller children ages 3 – 4 years”.
Therefore the standard hour per week for ECCE is at 30.
“Pre-school buildings can be permanent, semi-permanent or traditional thatched house but it should be structurally sound, well ventilated with adequate windows and two doors for easy evacuation or access in case of emergency.
There must be plenty of space both indoors and outdoors. Allow at least 2 square meters per child indoors and 5 square meters per child outdoors. The minimum size for the building should be 10m x 7m; or 18m x 7m; or 7m x 7m depending on the environment”
2: Catchment Areas School catchment of 1.5 km radius
Student should not travel more than 1 – 3 km in distance
Density = 4.2 (4) pupils per sq. km.
Torba Primary Education
Sections Standards Current Findings Gaps
1: Norms & Standards
1.1 Class Size The Regulation Order No. 44 of 2005
is 1:30 for a primary school (years 1 – 6) which gives us an hint that at least a total of 30 pupils should be enroll in each year level
2011 Total Torba Primary Enrolment: 1,936 (930 female & 1006 male)
2011 total Primary Schools: 24