R E S E A R C H A R T I C L E
Open Access
Diagnostic effect of shear wave
elastography imaging for differentiation of
malignant liver lesions: a meta-analysis
Xing Hu
1†, Xiaojie Huang
2†, Hui Chen
3, Tong Zhang
2, Jianhua Hou
2, Aixin Song
2, Lei Ding
1, Weiyuan Liu
1,
Hao Wu
2*†and Fankun Meng
1*†Abstract
Background:Shear wave elastography (SWE) imaging have been proposed for characterization of focal liver
lesions. We conducted a meta-analysis to evaluate the accuracy and clinical utility of SWE imaging for differentiation of malignant and benign hepatic lesions.
Methods:PubMed, Embase, Web of Science, and the Cochrane Library were systematically reviewed to search for
studies published between January 1, 1990, and November 30, 2018. The studies published in English relating to the evaluation the diagnostic accuracy of SWE imaging for distinguishing malignant and benign liver lesions were retrieved and examined for pooled sensitivity, specificity, likelihood ratios, and diagnostic odds ratios, using bivariate random-effects models. The hierarchical summary receiver operating characteristic (HSROC) curve was estimated to assess the SWE imaging accuracy. The clinical utility of SWE imaging for differentiation of malignant liver lesions was evaluated by Fagan plot.
Results:A total of 15 studies, involving 1894 liver lesions in 1728 patients, were eligible for the meta-analysis. The
pooled sensitivity and specificity for identification of malignant liver lesions were 0.82 (95% CI: 0.77–0.86) and 0.82 (95% CI: 0.76–0.87), respectively. The AUC was 0.89 (95% CI: 0.86–0.91). When the pre-test probability was 50%, after SWE imaging measurement over the cut-off value (positive result), the corresponding post-test probability for the presence of malignant liver lesions was 82%; the post-test probability was 18% after negative measurement.
Conclusions:SWE imaging showed high sensitivity and specificity in differentiating malignant and benign liver
lesions and may be promising for noninvasive evaluation of liver lesions.
Trial registration:The review was registered in the International Prospective Register of Systematic Reviews
(PROSPERO):CRD42018104510.
Keywords:Liver neoplasms, Ultrasonography, Elasticity imaging techniques, Diagnosis, Meta-analysis
© The Author(s). 2019Open AccessThis article is distributed under the terms of the Creative Commons Attribution 4.0 International License (http://creativecommons.org/licenses/by/4.0/), which permits unrestricted use, distribution, and reproduction in any medium, provided you give appropriate credit to the original author(s) and the source, provide a link to the Creative Commons license, and indicate if changes were made. The Creative Commons Public Domain Dedication waiver (http://creativecommons.org/publicdomain/zero/1.0/) applies to the data made available in this article, unless otherwise stated. * Correspondence:[email protected];[email protected]
Xing Hu and Xiaojie Huang contributed equally to this study and share first authorship.
Hao Wu and Fankun Meng contributed equally to this study and share corresponding authorship.
2Center for Infectious Disease, Beijing Youan Hospital, Capital Medical
University, No 8, Xitoutiao, Youanmenwai, Fengtai District, Beijing 100069, China
1Ultrasound and Functional Diagnosis Center, Beijing Youan Hospital, Capital
Medical University, No 8, Xitoutiao, Youanmenwai, Fengtai District, Beijing 100069, China
Background
The development and extensive application of imaging technology has resulted in increased detection of focal liver lesions (FLLs) [1]. Liver cancer is the second most common cause of death from cancer worldwide [2]. Therefore, it is crucial to differentiate malignant from benign liver lesions, despite how extremely challenging that might be amid the wide variation of FLLs.
Ultrasonography is commonly used as the first im-aging technique for detecting and distinguishing focal liver lesions because of its availability, low cost, and safety. Contrast-enhanced ultrasound (CEUS) has been shown to be a practicable and accurate method, because it can increase the sensitivity and specificity of detection of focal liver lesions detected by ultrasound to above 90 and 80%, respectively [3, 4]. However, some nodules are still difficult to distinguish, especially in the context of liver cirrhosis; moreover, the adverse effects of contrast agents limits the use of this technology to some extent. Liver biopsy has always been regarded as the gold stand-ard for differentiating malignant and benign lesions. Despite its strengths, liver biopsy is an invasive proced-ure and could give rise to several complications such as pain, bleeding, and risks of mortality [5,6].
Ultrasound elastography (USE) is a noninvasive method for the determination of tissue stiffness and the measurement value is usually altered by specific patho-logical or physiopatho-logical processes of soft tissues (such as malignancy, inflammation, et al) [7]. Quantitative ultra-sound elastography methods currently include acoustic radiation force impulse (ARFI) and transient elastogra-phy (TE) techniques [8]. The term “shear wave elasto-graphy” (SWE) refers to the technique of detecting shear-wave velocity (SWV) excited by acoustic radiation forces [9]. Both point shear-wave elastography (pSWE) and two-dimensional shear-wave elastography (2D-SWE) rely on the ARFI technique, which uses focused, short-duration acoustic pulses to deform localized tissue and generate shear waves [10]. Although both pSWE and 2D-SWE use ARFI to generate shear waves, pSWE is often referred to as ARFI elastography in some litera-ture and 2D-SWE is referred to as real-time two-dimensional SWE (RT-2D-SWE).
A series of studies evaluate the performance of USE in quantifying tumor stiffness to characterize focal liver le-sions [11–13]. In this study, we performed a systematic review and meta-analysis to assess the diagnostic accur-acy and clinical utility of SWE imaging in differentiating malignant and benign FLLs.
Methods
The review was registered in the International Prospect-ive Register of Systematic Reviews (PROSPERO, http:// www.crd.york.ac.uk/PROSPERO): CRD42018104510. We
reported this study in accordance with the Preferred Reporting Items for Systematic Reviews and Meta-analyses (PRISMA) of Diagnostic Test Accuracy Studies [14].
Literature search
We searched PubMed, Embase, Web of Science, and the Cochrane Library for studies published between January 1, 1990, and November 30, 2018, to identify articles evaluating SWE for distinguishing malignant and benign liver lesions. The following search strategy including Medical Subject Heading (MeSH) terms and a series of relevant keywords was used: ((liver lesion) OR (liver neo-plasm) OR (liver cancer) OR (hepatic lesion) OR (hep-atic tumor)) AND ((shear wave elastography) OR (SWE) OR (acoustic radiation force impulse) OR (ARFI) OR (virtual touch tissues quantification) OR (VTQ) OR (ultrasound elastography)) AND ((diagnosis) OR (differ-entiation) OR (evaluation) OR (distinguishing) OR (dis-criminate)). We also retrieved the reference lists of related studies manually and searched for other studies that might be omitted in electronic retrieval. The search was limited to journal articles written in English.
Selection criteria
The included studies were required to fulfill the follow-ing inclusion criteria: (1) evaluated the performance of SWE imaging for differentiation of malignant and benign liver lesions; (2) used an appropriate reference standard for the diagnosis, such as cytology/histology acquired by biopsy or surgical specimens, or clinical imaging findings (CEUS or computed tomography/magnetic resonance imaging [CT/MRI]); (3) reported data sufficient to calcu-late the diagnostic accuracy results of SWE imaging (true positive, false positive, false negative, and true negative) for distinguishing liver lesions. The appropriate author was contacted by e-mail if such data were un-available, and the study would be excluded if no author’s reply. (4) The study included at least 30 patients for the purpose of attaining good reliability. Studies were ex-cluded if they were in a language other than English or were animal experiments. Only the most recent study could be included if the publications used an overlap-ping cohort of patients.
Data extraction and quality assessment
number of the malignant liver lesions, invalid measures, lesion types, nodule size, reference standard for the diag-nosis, proportion of cirrhosis, proportion of chronic liver disease, and the cut-off values. In addition, true positive (TP), false positive (FP), false negative (FN), and true negative (TN) could be extracted directly or calculated indirectly. Two investigators independently assessed the quality of the included studies by the Quality Assess-ment of Diagnostic Accuracy Studies 2 (QUADAS-2) [15], with divergences resolved by consensus.
Statistical analysis
Summary measures of the SWE imaging accuracy (sensi-tivity, specificity, likelihood ratios, and diagnostic odds ratios) were calculated using a bivariate random-effects model. A hierarchical summary receiver operating char-acteristic (HSROC) curve was also plotted, and the area under the ROC curve (AUC) was calculated using bivari-ate model. The inconsistency index (I2) and Cochrane Q statistic were used to estimate the heterogeneity across studies. I2value greater than 50% or aP value less than 0.10 suggested substantial heterogeneity. Sensitivity ana-lysis was performed by removing studies in which the cut-off values of shear wave velocity (SWV) were less than 2.0 m/s to estimate whether undue influence of a single study was possible.
In addition, univariate meta-regression analyses were performed to explore the sources of potential heterogen-eity among studies. The covariates included the follow-ing: elastography modality (pSWE vs. 2D-SWE), study location (Asian vs. European or North American), gold standard (histopathology only vs. histopathology and/or others), number of liver lesions (≥100 vs.<100), preva-lence of malignant liver lesions (≥50% vs. < 50%), blinded from the results of the reference standard before inter-pretation of SWE (blinded vs. not blinded), and attrition rate (≥10% vs.<10%). Furthermore, groups were divided into subgroups based on the heterogeneity between studies. We performed a separate analysis of the studies that reported the cut-off value of the SWV/elasticity in FLL, as well as the cut-off value of the SWV/elasticity ratio (FLL to surrounding liver parenchyma).
We performed the Fagan plot to assess the clinical utility of the SWE imaging [16]. We calculated pre-test probabilities of 25, 50, and 75% versus corresponding post-test probabilities, following a positive or negative measurement of SWE. The potential publication bias was inspected by examining a Deeks funnel plot asym-metry test, withP< 0.1 for the slope coefficient indicat-ing significant asymmetry [17].
All statistical analyses were conducted using Stata ver-sion 13.0 (StataCorp, College Station, TX) with midas and metandi modules.
Results
Search results and study characteristics
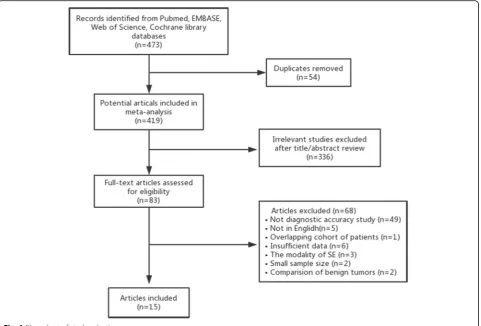
Based on the predefined search strategies, a total of 473 studies were retrieved initially, with 54 duplicates. After eliminating 336 irrelevant studies on review of the titles and abstracts, 83 potentially relevant studies underwent full-text review to determine their eligibility for inclusion. Sixty-eignt articles were excluded for the following reasons: not diag-nostic accuracy study (n= 49), not in English (n= 5), over-lapping cohort of patients (n= 1), insufficient data (n= 6), the modality of strain elastography (n= 3), small sample size (n= 2), and focus on the comparison between benign tu-mors (n = 2) [13,18]. Finally, 15 articles that fulfilled the in-clusion criteria were included in this meta-analysis. The flow chart of the study selection appears in Fig.1.
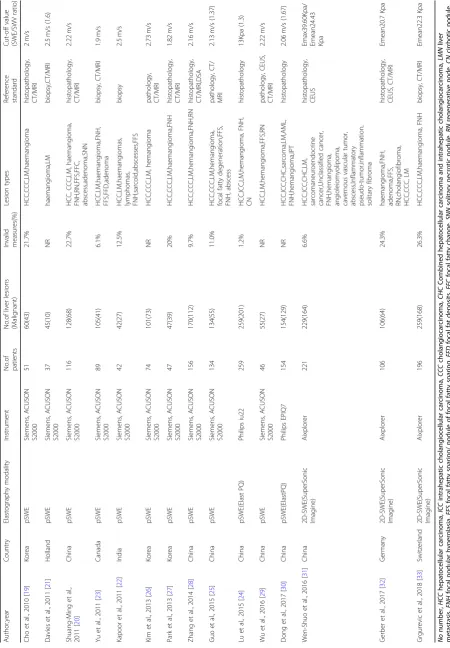
The characteristics of the 15 included studies are sum-marized in Table 1 and Additional file 1: Table S1. A total of 1894 liver lesions (673 benign, 1221 malignant) in 1728 patients were investigated. The cut-off value of shear wave speed in pSWE ranged from 1.82 m/s to 2.5 m/s, the cut-off value of Young modulus in 2D-SWE ranged from 20.7 Kpa to 24.43 Kpa, and the cut-off value of SWV/elasticity ration (FLL to surrounding liver parenchyma) ranged from 1.3 to 1.67. All of the 15 in-cluded studies were prospective in design. Twelve stud-ies [19–30] used pSWE as the diagnostic imaging modality; the other 3 studies [31–33] performed 2D-SWE imaging modality. Ten studies [19, 20, 22, 23,
26,28, 29,31–33] exclusively reported the cut-off value of the SWV/elasticity in FLL, whereas 4 studies [21, 24,
25, 30] reported the cut-off value of the SWV/elasticity and the cut-off value of the SWV ratio. In addition, 1 study [27] reported the sum of the SWV (FLL and sur-rounding liver parenchyma). There were respectively four articles [22, 23, 30, 33] and six articles [19, 20, 23,
26,30,31] reporting the proportion of patients with cir-rhosis and the proportion of chronic liver disease in the enrolled population. Eleven studies [19, 20, 22–25, 27,
28, 31–33] reported the number of patients who were excluded from the study due to SWE measurement fail-ure for the reason of the presence of deep-seated lesion (greater than 8 cm from the skin); or with lesion near the heart and large blood vessels; or with lesion smaller than the size of the sampling box (smaller than 1 cm) for SWV measurement; or the patients’ inability to hold their breath properly. The percentage of SWE nonfeasi-ble due to the technical limitations ranged from 1.2 to 26.3%, with the mean percentage of 12.7%. Eleven stud-ies were conducted in Asia (7 in China, 3 in Korea, 1 in India), 3 in Europe, and 1 in North America (Canada).
Quality assessment of the included studies
studies was moderate (Fig.2 and Additional file1: Table S2). However, the risk of bias in patient selection was unclear in 3 studies [28, 29, 32] because it was not clear whether patients were consecutively enrolled in the co-hort. Risk of bias in the index test was unclear in 3 stud-ies [23, 25, 30] because they did not report whether SWE imaging was performed blinded to the reference standard. In 8 studies [19, 21, 25–30], the risk of bias in the reference standard was unclear because it was unclear whether the reference standard results were interpreted without knowledge of the measurement of SWE. The time interval between SWE imaging and the reference standard was not described in 3 studies [19, 20, 31].
Pooled analysis of diagnostic accuracy and heterogeneity assessment
The pooled sensitivity and specificity of SWE in differen-tiation of benign and malignant liver lesions were 0.82 (95% CI: 0.77–0.86) and 0.82 (95% CI: 0.76–0.87), re-spectively (Fig. 3). The positive likelihood ratio (PLR) and negative likelihood ratio (NLR) were 4.57 (95% CI: 3.28–6.38) and 0.22 (95% CI: 0.16–0.29), respectively; the summary diagnostic odds ratio (DOR) was 21.06
(95% CI: 12.14–36.59); and the area under the HSROC was 0.89 (95% CI 0.86–0.91) (Fig.4a). There was statisti-cally significant heterogeneity among the studies in pool-ing sensitivity (SEN) (I2= 71.36%, P< 0.01), specificity (SPE) (I2= 67.32%, P< 0.01), and DOR (I2= 99.96%, P< 0.01). We performed a sensitivity analysis in which two studies [23,27] (the cut-off values of SWV less than 2.0 m/s) were removed, whereas the results were not influ-enced seriously. We cannot separately calculate the diag-nostic accuracy of SWE imaging in differentiation of liver lesions in patients with cirrhosis and non-cirrhosis, because the articles did not report the data or the data could not be extracted.
Accuracy of SWV ratio for the differentiation of benign and malignant liver lesions
The pooled sensitivity, specificity, PLR, and NLR, of the SWV ratio (FLL to surrounding liver parenchyma) for the differentiation of malignant and benign liver lesions were 0.72 (95% CI: 0.59–0.83), 0.82 (95% CI: 0.43–0.97), 4.08 (95% CI: 0.88–18.89), and 0.33 (95% CI: 0.19–0.60), respectively; the summary DOR was 12.17 (95% CI: 1.62–91.31), and the area under the SROC was 0.78 (95% CI: 0.74–0.81) (Fig.4b).
Table 1 Main characteristics of the included studies Author,year Country Elastography modality Instrument No.of patients No.of liver lesions (Malignant) Invalid measures(%) Lesion types Referenc e standard Cut-off value (SWE/SWV ratio) Cho et al., 2010 [ 19 ] Korea pSWE Siemens, ACUSON S2000 51 60(43) 21.7% HCC,CCC,LM,haemangioma histopathology, CT/MR I 2 m/s Davies et al., 2011 [ 21 ] Holland pSWE Siemens, ACUSON S2000 37 45(10) NR haemangioma,LM biopsy,CT/MRI 2.5 m/s (1.6) Shuang-Ming et al., 2011 [ 20 ] China pSWE Siemens, ACUSON S2000 116 128(68) 22.7% HCC, CCC,LM, haemangioma, FNH,RN,FFS,FFC, abscess,adenoma,SNN histopathology, CT/MR I 2.22 m/s Yu et al., 2011 [ 23 ] Canada pSWE Siemens, ACUSON S2000 89 105(41) 6.1% HCC,LM,haemangioma,FNH, FFS,FFD,adenoma biopsy, CT/MRI 1.9 m/s Kapoor et al., 2011 [ 22 ] India pSWE Siemens, ACUSON S2000 42 42(27) 12.5%
HCC,LM,haemangiomas, lymphomas, FNH,sarcoid,abscesses,FFS
biopsy 2.5 m/s Kim et al., 2013 [ 26 ] Korea pSWE Siemens, ACUSON S2000 74 101(73) NR HCC,CCC,LM, hemangiom a patholog y, CT/MR I 2.73 m/s Park et al., 2013 [ 27 ] Korea pSWE Siemens, ACUSON S2000 47 47(39) 20% HCC,CCC,LM,haemangioma,FNH histopathology, CT/MR I 1.82 m/s Zhang et al., 2014 [ 28 ] China pSWE Siemens, ACUSON S2000 156 170(112) 9.7% HCC,CCC,LM,hemangioma,FNH,RN histopathology, CT/MR I,DSA 2.16 m/s Guo et al., 2015 [ 25 ] China pSWE Siemens, ACUSON S2000 134 134(55) 11.0% HCC,CCC,LM,hemangioma, focal fatty degeneration,FFS, FNH, abscess patholog y, CT/ MRI 2.13 m/s (1.37) Lu et al., 2015 [ 24 ] China pSWE(Elast PQ) Philips iu22 259 259(201) 1.2% HCC,ICC,LM,hemangioma, FNH, CN histopathology 13Kpa (1.3) Wu e t al., 2016 [ 29 ] China pSWE Siemens, ACUSON S2000 46 55(27) NR HCC,LM,hemangioma,FFS,RN patholog y, CEUS, CT/MR I 2.22 m/s Dong et al., 2017 [ 30 ] China pSWE(ElastPQ) Philips EPIQ7 154 154(129) NR HCC,ICC,CHC,sarcoma,LM,AML, FNH,hemangioma,IPT histopathology 2.06 m/s (1.67) Wen-Shuo et al., 2 016 [ 31 ] China 2D-SWE(SuperSonic Imagine) Aixplorer 221 229(164) 6.6%
HCC,ICC,CHC,LM, sarcomaneuroendocrine cancer,Unclassified
cancer,
FNH,hemangioma, angioleiomyolipoma, cavernous
vascular
tumor,
abscess,Inflammatory pseudo-tumor,inflammation, solitary
fibroma
histopathology, CEUS Emax39.60Kpa/ Emean24.43 Kpa
Gerber et al., 2017 [ 32 ] Germany 2D-SWE(SuperSonic Imagine) Aixplorer 106 106(64) 24.3%
haemangioma,FNH, adenoma,FFS, RN,cholangiofibroma, HCC,CCC,
Fig. 2Quality assessment of the included studies according to Quality Assessment of Diagnostic Accuracy Studies-2 (QUADAS-2) criteria
Fig. 3Sensitivity and specificity forest plots of shear wave elastography for differentiation of malignant and benign liver lesions. The pooled
sensitivity and specificity of the SWE for differentiation of malignant and benign malignant liver lesions were 0.82 (95%CI: 0.77–0.86) and 0.82
Meta-regression and subgroup analyses
Univariate meta-regressions were performed to examine the sources of potential heterogeneity in sensitivity and specificity. The results showed that elastography modality, study location, gold standard, blinded interpretation of SWE, and attrition rate were significantly associated with the heterogeneity of sensitivity, whereas number of liver lesions, prevalence of malignant liver lesions, blinded in-terpretation of SWE, and attrition rate were significantly associated with the heterogeneity of specificity (Additional file1: Figure S1). We performed subgroup analysis accord-ing to the elastography modality. The sensitivity of 2D-SWE was slightly higher compared with pSWE (84% vs. 82%,P< 0.01), whereas there was no significant differ-ence in the specificity for the two modalities (P= 0.18). The sensitivity and the specificity of high attrition rate (≥10%) was higher than low attrition rate (<10%) (82% vs. 80%, P < 0.01; 81% vs. 78%,P< 0.05). Summary data strati-fied into several subgroups are shown in Table2.
Assessment of clinical utility of SWE for differentiation of liver lesions
The Fagan plot demonstrated that SWE imaging was fairly effective in distinguishing benign from malignant
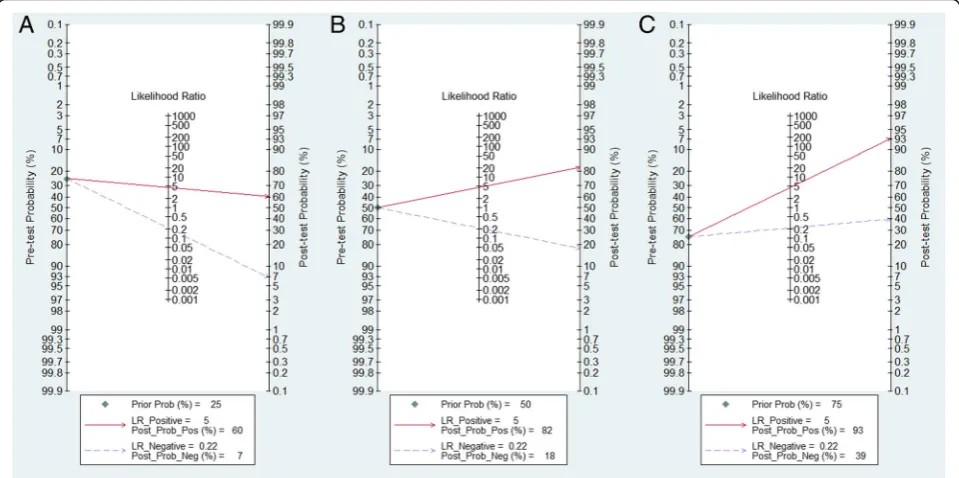
liver lesions when the pre-test probability was 50%, with 82% probability of malignant disease following a positive measurement, and the probability reduced to 18% when a negative measurement occurred (Fig. 5b). However, when the pre-test probability was 25%, probability was only 60% to differentiate malignant liver lesions correctly following a positive measurement of SWE imaging (Fig.
5a). In addition, the probability of a correct diagnosis rate reached 93% for malignant liver lesions following a positive measurement when the pre-test probability was 75%; nevertheless, the incidence of malignant lesions could reach 39% with a negative measurement (Fig.5c).
Publication bias
The Deeks’funnel plot showed that the studies included in the meta-analysis were distributed symmetrically (P= 0.87, Additional file1: Figure S2), indicating no clear evi-dence of publication bias.
Discussion
Ultrasound elastography has been explored for applica-tion in many fields, it has shown good performance in the evaluation of liver fibrosis and the characterization of superficial organ lesions [34–36]. Similarly, focal liver
Fig. 4HSROC curve for differentiation of malignant and benign liver lesions of (a) shear wave elastography, (b) the shear wave velocity ratio (FLL to surrounding liver parenchyma). The AUC of the SWE and the SWV ratio for differentiation of malignant and benign malignant liver lesions
were 0.89 (95%CI: 0.86–0.91) and 0.78 (95%CI: 0.74–0.81), respectively. (HSROC: Hierarchical summary receiver operating characteristic; FLL: focal
lesions differ mechanically from surrounding tissues and show changes in their elasticity, with the tendency to in-crease stiffness in malignant lesions [8, 37]. Previous re-search have demonstrated that strain elastography is helpful for differentiation of benign and malignant liver lesions [38, 39], and enable us to distinguish accurately between HCC and metastatic adenocarcinoma [40]. SWE have been studied rencently to characterise focal liver lesions and have been proved to have certain clin-ical value in differential diagnosis [41, 42]. In this sys-tematic evaluation and meta-analysis, we conducted an evidence-based summary of the performance character-istics of SWE in identifying malignant liver lesions.
The meta-analysis synthetic results indicate that SWE imaging has a high accuracy to discriminate malignant liver lesions from benign ones, with sensitivity, specifi-city, and AUC of 0.82 (95% CI: 0.77–0.86), 0.82 (95% CI: 0.76–0.87), and 0.89 (95% CI: 0.86–0.91), respectively. Furthermore, the results of the Fagan plot show that SWE imaging is valuable in differentiating liver lesions. When the pre-test probability was 50%, the correct diag-nosis of malignant liver lesions increased to 82% after the SWE measurement was positive, whereas when the measurement was negative, malignant liver lesions were present in only 18% of patients. Therefore, it was rea-soned that SWE imaging is promising and would play an important role in clinical practice. SWE imaging is easily and inexpensively integrated into the ultrasound systems and can be performed with one conventional probe so that the operator can visualize the liver directly, and the region of interest can be positioned manually at the spe-cific location [43]. In addition, SWE imaging is rarely
affected by ascites and obesity, because the generated shear waves originate inside the liver rather than from the body surfaces [44]. The results of a prior meta-analysis was also encouraging [45], with the sensi-tivity, the specificity, and the AUC of 0.86, 0.89, and 0.94, respectively, yet only 8 studies assessing diagnostic the performance of pSWE were included. Another meta-analysis [46] discussing the efficiency of SWE im-aging for detecting malignant lesions of the liver also showed good results, with sensitivity, specificity and AUC of 0.82, 0.80 and 0.87, respectively; however, the 9 studies included were all to evaluate the diagnostic per-formance of pSWE while 2D-SWE studies were not in-cluded in this meta-analysis.
FLLs may occur on different liver backgrounds; shear wave velocity (SWV) of SWE imaging in the same type of focal lesion is variable with different surrounding paren-chyma. Cirrhosis is an important cause of increased liver parenchyma stiffness. It is noteworthy that the liver is sur-rounded by a stiff, expandable capsule (Glisson’s capsule), so liver stiffness would increase following any increase in its volume caused by inflammation, cholestasis, or steato-sis [44, 47]. Some viewpoints speculate that the ratio of SWV values (FLL to the surrounding liver parenchyma) can more accurately differentiate malignant lesions [48]. However, our meta-analysis found that the cut-off value of the SWV/elasticity in FLL showed superior performance compared to the cut-off value of the SWV ratio, with an AUROC of 0.89 vs. 0.78. The diagnostic performance for the sum of SWV values (FLL and the surrounding liver parenchyma) to differentiate liver lesions is reported in only one article [27], with an AUROC of 0.853.
Table 2Results of the meta-regression and subgroup analyses on shear wave elastography for differentiation of malignant and
benign liver lesions
Covariates Subgroup No.of studies Pooled SEN (95% CI)
Pvalue Pooled SPE (95% CI)
Pvalue Meta-Regression JointPValue
modality 1-pSWE 12 0.82(0.76–0.87) <0.01 0.83(0.77–0.89) 0.18 0.70
0-2D-SWE 3 0.84(0.75–0.93) 0.79(0.66–0.92)
location 1-Asian 11 0.82(0.77–0.88) 0.02 0.82(0.76–0.89) 0.05 0.99
0- European or North America 4 0.82(0.72–0.92) 0.81(0.71–0.92)
gold standard 1-histopathology 3 0.82(0.72–0.92) 0.02 0.85(0.73–0.96) 0.22 0.89
0- histopathology and/or other 12 0.82(0.77–0.88) 0.81(0.75–0.88)
number of lesions 1-≥100 10 0.84(0.79–0.88) 0.06 0.80(0.73–0.86) <0.01 0.10
0-<100 5 0.76(0.66–0.87) 0.88(0.80–0.97)
prevalence of malignant lesions 1-≥50% 11 0.84(0.79–0.88) 0.14 0.81(0.74–0.88) 0.02 0.29
0-<50% 4 0.75(0.63–0.87) 0.84(0.74–0.94)
blinded 1-yes 11 0.82(0.77–0.88) 0.02 0.81(0.74–0.88) 0.02 0.79
0-unclear 4 0.82(0.72–0.92) 0.85(0.75–0.95)
attrition rate 1-≥10% 7 0.82(0.77–0.87) <0.01 0.81(0.74–0.88) 0.04 <0.01
0-<10% 4 0.80(0.75–0.86) 0.78(0.69–0.87)
Despite the results of our study showing promising re-sults, there were still some technical limitations in SWE imaging. First, the maximum detection depth of SWE is limited. The transmission of an acoustic radiation im-pulse was allowed only up to 10 cm from the skin in pSWE, owing to safety concerns [49]. The maximum de-tection depth of 2D-SWE would be deeper than pSWE but would depend on the type of instrument and probe. It is difficult to detect the shear wave of a deep-seated lesion because of high attenuation of the signal as it propagates, whereas a shear wave attenuates more slowly due to the Mach cone’s effect in 2D-SWE. Second, the shear wave’s speed that SWE measured was susceptible to motion-related factors, and the accuracy of the results decreased when the lesion was close to the heart and large vessels, or when patients had poor breath-holds. Third, there are wide ranges of stiffness values for focal liver lesions, and some values overlap between the be-nign and malignant lesions [50]. It seems likely that ma-lignant liver lesions are usually stiffer than benign ones, especially for tumours with pronounced desmoplastic stroma reaction such as intrahepatic cholangiocellular carcinoma, but internal hemorrhage or necrosis in ma-lignant lesions would decrease stiffness. The stiffness of some benign lesions with a high proportion of fibrous tissue such as focal nodular hyperplasia can increase due
to fibrous septa and central scar [34]. Finally, there is a high potion of the measurement failure among the in-cluded studies (from 1.2 to 26.3%), the diversity of attri-tion rate may be related to the patient inclusion criteria of the original studies and the proficiency of the oper-ator. In general, patients with FLLs in the right liver lobe and a proximal edge located < 7 cm from the body’s sur-face would be easily detected, and patients with success-ful measurement had a lower body mass index (BMI) as compared to patients in which SWE measurement failed. A few studies demonstrate that the performance of SWE for FLL characterization appears limited due to the over-lap of the stiffness values between the benign and malig-nant lesions [50,51].
There are several potential limitations in our study that should be taken into consideration. First, a consid-erable amount of heterogeneity was detected among the included studies. Our subgroup analyses found that po-tential sources of heterogeneity included elastography modality, study location, prevalence of malignant liver lesions, blinded interpretation of SWE, attrition rate, and several other differences, which were unrecorded in these studies, might also contribute to the heterogeneity. Second, because of the limited number of included stud-ies, only 3 studies assessed 2D-SWE, and our study in-cluded some relatively small samples of studies;
Fig. 5Fagan plot to evaluate the clinical utility of shear wave elastography for differentiation of liver lesions. (A) Pre-test probability = 25%; (B) Pre-test probability = 50%; (C) Pre-test probability = 75%. When the pre-test probability was 25%, with 60% probability of malignant disease
following a positive measurement, and the probability reduced to 7% when a negative measurement occurred (Fig.a). When the pre-test
probability was 50%, with 82% probability of malignant disease following a positive measurement, and the probability reduced to 18% when a
negative measurement occurred (Fig.b). When the pre-test probability was 75%, with 93% probability of malignant disease following a positive
large-sample and multicenter studies on the different kinds of elastography modality in different liver paren-chymal settings (such as cirrhosis and non-cirrhosis) are still needed. Third, the summary measurement of diag-nostic accuracy pooled the optimal results from each study, with diverse cut-off values, which also may result in overestimation of the performance of SWE imaging. Nevertheless, in clinical practice, one criterion of cut-off value would be required for differentiating liver malig-nant lesions. Fourth, original studies included in our meta-analysis did not provide size-stratified subgroup analysis results which in turn make it hard to identify appropriate size of lesion to do SWE imaging. Future studies are needed to do subgroup analysis according to tumor size to investigate the proper size. In addition, only English-language articles were included in our study; thus, language bias may have influenced the re-sults. Therefore, considering these limitations, our find-ings should be interpreted with caution.
Conclusions
In conclusion, our meta-analysis suggests that SWE im-aging has favorable diagnostic value for differentiating malignant liver lesions from benign ones. SWE imaging is a promising method undergoing rapid development [52], which could give additional important information to conventional ultrasound, with high sensitivity and specificity in differential diagnosis of liver lesions. It should be emphasized that the SWE imaging assessment of a liver lesion should be interpreted in the context of the patient’s clinical background. Future large-scale stud-ies are required to evaluate the performance of SWE im-aging in differentiation of malignant liver lesions and to determine an optimal cut-off value.
Additional file
Additional file 1:Table S1.Characteristics of the diagnostic
performance of SWE imaging in included studies.Table S2.Quality
assessment with QUADAS-2.Figure S1.Univariate meta-regression and
subgroup analyses for sensitivity and specificity of SWE imaging.Figure S2.
Deeks’funnel plot asymmetry test for publication bias. (DOCX 1237 kb)
Abbreviations
2D-SWE:two-dimensional shear wave elastography; ARFI: acoustic radiation force impulse; AUC: area under the ROC curve; BMI: body mass index; CEUS: contrast-enhanced ultrasound; FLL: focal liver lesion;
HSROC: hierarchical summary receiver operating characteristic; NAFLD: Non-alcoholic fatty liver disease; pSWE: point shear wave elastography; SWE: shear wave elastography; SWV: shear wave velocity; TE: transient elastography
Acknowledgements Not applicable.
Funding
This work was supported by the Chinese Government 13th Five-Year Plan (2017ZX10201101), Major Project of Beijing Municipal Science and Technology Committee (D161100000416003, D171100000517003), the
National Natural Science Foundation of China (No. 81701984), the National
Science and Technology Major Project (2018ZX10302205–005), the NSFC-NIH
Biomedical collaborative research program (81761128001), the Capital Health
Research and Development of Special Fund (2016–1-2182), Beijing Key
Laboratory (No. BZ0089), and the Scientific Research Project of You’an
Hospital, CCMU, 2018 (No. YNKTTS20180106).
Availability of data and materials
The datasets used and/or analysed during the current study are available from the corresponding author on reasonable request.
Authors’contributions
All authors have contributed to the manuscript and have no conflicts of interest to declare. XH, XJH, HW, and FKM conceived and designed the protocol and study. XH and LD identified eligible articles and extracted data. XH and TZ assessed the study quality. XH and JHH performed the analysis with assistance from HC. XH and XJH composed the manuscript and WYL and AXS revised the manuscript. All authors read and approved the final manuscript.
Ethics approval and consent to participate
This is a systematic review and meta-analysis, thus ethics approval and con-sent to participant are not applicable.
Consent for publication Not applicable.
Competing interests
The authors declare that they have no competing interests.
Publisher’s Note
Springer Nature remains neutral with regard to jurisdictional claims in published maps and institutional affiliations.
Author details
1
Ultrasound and Functional Diagnosis Center, Beijing Youan Hospital, Capital Medical University, No 8, Xitoutiao, Youanmenwai, Fengtai District, Beijing 100069, China.2Center for Infectious Disease, Beijing Youan Hospital, Capital
Medical University, No 8, Xitoutiao, Youanmenwai, Fengtai District, Beijing 100069, China.3School of Biomedical Engineering, Capital Medical University, Beijing, China.
Received: 25 December 2018 Accepted: 4 April 2019
References
1. Marrero JA, Ahn J, Rajender Reddy K. Americal College of G. ACG clinical
guideline: the diagnosis and management of focal liver lesions. Am J
Gastroenterol. 2014;109(9):1328–47 quiz 48.
2. Ferlay J, Soerjomataram I, Dikshit R, Eser S, Mathers C, Rebelo M, et al.
Cancer incidence and mortality worldwide: sources, methods and major
patterns in GLOBOCAN 2012. Int J Cancer. 2015;136(5):E359–86.
3. Strobel D, Seitz K, Blank W, Schuler A, Dietrich C, von Herbay A, et al.
Contrast-enhanced ultrasound for the characterization of focal liver lesions--diagnostic accuracy in clinical practice (DEGUM multicenter trial). Ultraschall
Med. 2008;29(5):499–505.
4. Seitz K, Strobel D, Bernatik T, Blank W, Friedrich-Rust M, Herbay A, et al.
Contrast-enhanced ultrasound (CEUS) for the characterization of focal liver lesions - prospective comparison in clinical practice: CEUS vs. CT (DEGUM multicenter trial). Parts of this manuscript were presented at the ultrasound
Dreilandertreffen 2008, Davos. Ultraschall Med. 2009;30(4):383–9.
5. Lindor KD, Bru C, Jorgensen RA, Rakela J, Bordas JM, Gross JB, et al. The role
of ultrasonography and automatic-needle biopsy in outpatient
percutaneous liver biopsy. Hepatology (Baltimore, Md). 1996;23(5):1079–83.
6. Atwell TD, Smith RL, Hesley GK, Callstrom MR, Schleck CD, Harmsen WS, et
al. Incidence of bleeding after 15,181 percutaneous biopsies and the role of
aspirin. AJR Am J Roentgenol. 2010;194(3):784–9.
7. Shiina T, Nightingale KR, Palmeri ML, Hall TJ, Bamber JC, Barr RG, et al.
WFUMB guidelines and recommendations for clinical use of ultrasound elastography: part 1: basic principles and terminology. Ultrasound Med Biol.
8. Kennedy P, Wagner M, Castera L, Hong CW, Johnson CL, Sirlin CB, et al. Quantitative Elastography methods in liver disease: current evidence and
future directions. Radiology. 2018;286(3):738–63.
9. Bamber J, Cosgrove D, Dietrich CF, Fromageau J, Bojunga J, Calliada F, et al.
EFSUMB guidelines and recommendations on the clinical use of ultrasound elastography. Part 1: basic principles and technology. Ultraschall Med. 2013;
34(2):169–84.
10. Sarvazyan AP, Rudenko OV, Swanson SD, Fowlkes JB, Emelianov SY. Shear
wave elasticity imaging: a new ultrasonic technology of medical
diagnostics. Ultrasound Med Biol. 1998;24(9):1419–35.
11. Ronot M, Di Renzo S, Gregoli B, Duran R, Castera L, Van Beers BE, et al.
Characterization of fortuitously discovered focal liver lesions: additional information provided by shearwave elastography. Eur Radiol. 2015;25(2):
346–58.
12. Park HS, Kim YJ, Yu MH, Jung SI, Jeon HJ. Shear wave Elastography of focal
liver lesion: Intraobserver reproducibility and elasticity characterization.
Ultrasound quarterly. 2015;31(4):262–71.
13. Brunel T, Guibal A, Boularan C, Ducerf C, Mabrut JY, Bancel B, et al. Focal
nodular hyperplasia and hepatocellular adenoma: the value of shear wave
elastography for differential diagnosis. Eur J Radiol. 2015;84(11):2059–64.
14. McInnes MDF, Moher D, Thombs BD, McGrath TA, Bossuyt PM. The P-DTAG,
et al. preferred reporting items for a systematic review and meta-analysis of diagnostic test accuracy studies: the PRISMA-DTA statement. Jama. 2018;
319(4):388–96.
15. Whiting PF, Rutjes AW, Westwood ME, Mallett S, Deeks JJ, Reitsma JB, et al.
QUADAS-2: a revised tool for the quality assessment of diagnostic accuracy
studies. Ann Intern Med. 2011;155(8):529–36.
16. Hellmich M, Lehmacher W. A ruler for interpreting diagnostic test results.
Methods Inf Med. 2005;44(1):124–6.
17. Deeks JJ, Macaskill P, Irwig L. The performance of tests of publication bias
and other sample size effects in systematic reviews of diagnostic test
accuracy was assessed. J Clin Epidemiol. 2005;58(9):882–93.
18. Taimr P. Klompenhouwer AJ. Can point shear wave elastography
differentiate focal nodular hyperplasia from hepatocellular adenoma. 2018;
46(6):380–5.
19. Cho SH, Lee JY, Han JK, Choi BI. Acoustic radiation force impulse
elastography for the evaluation of focal solid hepatic lesions: preliminary
findings. Ultrasound Med Biol. 2010;36(2):202–8.
20. Shuang-Ming T, Ping Z, Ying Q, Li-Rong C, Ping Z, Rui-Zhen L. Usefulness of
acoustic radiation force impulse imaging in the differential diagnosis of
benign and malignant liver lesions. Acad Radiol. 2011;18(7):810–5.
21. Davies G, Koenen M. Acoustic radiation force impulse elastography in
distinguishing hepatic haemangiomata from metastases: preliminary
observations. Br J Radiol. 2011;84(1006):939–43.
22. Kapoor A, Kapoor A, Mahajan G, Sidhu BS, Lakhanpal VP. Real-time
elastography in differentiating metastatic from nonmetastatic liver nodules.
Ultrasound Med Biol. 2011;37(2):207–13.
23. Yu H, Wilson SR. Differentiation of benign from malignant liver masses with
acoustic radiation force impulse technique. Ultrasound quarterly. 2011;27(4):
217–23.
24. Lu Q, Ling W, Lu C, Li J, Ma L, Quan J, et al. Hepatocellular carcinoma:
stiffness value and ratio to discriminate malignant from benign focal liver
lesions. Radiology. 2015;275(3):880–8.
25. Guo LH, Wang SJ, Xu HX, Sun LP, Zhang YF, Xu JM, et al. Differentiation of
benign and malignant focal liver lesions: value of virtual touch tissue quantification of acoustic radiation force impulse elastography. Med Oncol. 2015;32(3):68.
26. Kim JE, Lee JY, Bae KS, Han JK, Choi BI. Acoustic radiation force impulse
elastography for focal hepatic tumors: usefulness for differentiating
hemangiomas from malignant tumors. Korean J Radiol. 2013;14(5):743–53.
27. Park H, Park JY, Kim DY, Ahn SH, Chon CY, Han KH, et al. Characterization of
focal liver masses using acoustic radiation force impulse elastography.
World J Gastroenterol. 2013;19(2):219–26.
28. Zhang P, Zhou P, Tian SM, Qian Y, Li JL, Li RZ. Diagnostic performance of
contrast-enhanced sonography and acoustic radiation force impulse imaging in solid liver lesions. Journal of ultrasound in medicine : official journal of the
American Institute of Ultrasound in Medicine. 2014;33(2):205–14.
29. Wu JP, Shu R, Zhao YZ, Ma GL, Xue W, He QJ, et al. Comparison of
contrast-enhanced ultrasonography with virtual touch tissue quantification in the evaluation of focal liver lesions. Journal of clinical ultrasound : JCU. 2016;
44(6):347–53.
30. Dong Y, Wang WP, Xu Y, Cao J, Mao F, Dietrich CF. Point shear wave speed
measurement in differentiating benign and malignant focal liver lesions.
Medical ultrasonography. 2017;19(3):259–64.
31. Tian WS, Lin MX, Zhou LY, Pan FS, Huang GL, Wang W, et al. Maximum
value measured by 2-D shear wave Elastography helps in differentiating malignancy from benign focal liver lesions. Ultrasound Med Biol. 2016;42(9):
2156–66.
32. Gerber L, Fitting D, Srikantharajah K, Weiler N, Kyriakidou G, Bojunga J, et al.
Evaluation of 2D- shear wave Elastography for characterisation of focal liver
lesions. Journal of gastrointestinal and liver diseases : JGLD. 2017;26(3):283–
90.
33. Grgurevic I, Bokun T, Salkic NN, Brkljacic B, Vukelic-Markovic M, Stoos-Veic T,
et al. Liver elastography malignancy prediction score for noninvasive characterization of focal liver lesions. Liver international : official journal of
the International Association for the Study of the Liver. 2018;38(6):1055–63.
34. Sigrist RMS, Liau J, Kaffas AE, Chammas MC, Willmann JK. Ultrasound
Elastography: review of techniques and clinical applications. Theranostics.
2017;7(5):1303–29.
35. Cosgrove D, Piscaglia F, Bamber J, Bojunga J, Correas JM, Gilja OH, et al.
EFSUMB guidelines and recommendations on the clinical use of ultrasound
elastography. Part 2: clinical applications. Ultraschall Med. 2013;34(3):238–53.
36. Shiha G, Ibrahim A, Helmy A, Sarin SK, Omata M, Kumar A, et al.
Asian-Pacific Association for the Study of the liver (APASL) consensus guidelines on invasive and non-invasive assessment of hepatic fibrosis: a 2016 update.
Hepatol Int 2017;11(1):1–30.
37. Sun XL, Yao H, Men Q, Hou KZ, Chen Z, Xu CQ, et al. Combination of
acoustic radiation force impulse imaging, serological indexes and contrast-enhanced ultrasound for diagnosis of liver lesions. World J Gastroenterol.
2017;23(30):5602–9.
38. Onur MR, Poyraz AK, Ucak EE, Bozgeyik Z, Ozercan IH, Ogur E.
Semiquantitative strain elastography of liver masses. Journal of ultrasound in medicine : official journal of the American Institute of Ultrasound in
Medicine. 2012;31(7):1061–7.
39. Gheorghe L, Iacob S, Iacob R, Dumbrava M, Becheanu G, Herlea V, et al. Real
time elastography - a non-invasive diagnostic method of small hepatocellular carcinoma in cirrhosis. Journal of gastrointestinal and liver
diseases : JGLD. 2009;18(4):439–46.
40. Kato K, Sugimoto H, Kanazumi N, Nomoto S, Takeda S, Nakao A.
Intra-operative application of real-time tissue elastography for the diagnosis of liver tumours. Liver international : official journal of the International
Association for the Study of the Liver. 2008;28(9):1264–71.
41. Gallotti A, D'Onofrio M, Romanini L, Cantisani V, Pozzi MR. Acoustic radiation
force impulse (ARFI) ultrasound imaging of solid focal liver lesions. Eur J
Radiol. 2012;81(3):451–5.
42. Guibal A, Boularan C, Bruce M, Vallin M, Pilleul F, Walter T, et al. Evaluation
of shearwave elastography for the characterisation of focal liver lesions on
ultrasound. Eur Radiol. 2013;23(4):1138–49.
43. Berzigotti A, Ferraioli G, Bota S, Gilja OH, Dietrich CF. Novel
ultrasound-based methods to assess liver disease: the game has just begun. Digestive and liver disease : official journal of the Italian Society of Gastroenterology
and the Italian Association for the Study of the Liver. 2018;50(2):107–12.
44. Ferraioli G, Filice C, Castera L, Choi BI, Sporea I, Wilson SR, et al. WFUMB
guidelines and recommendations for clinical use of ultrasound
elastography: part 3: liver. Ultrasound Med Biol. 2015;41(5):1161–79.
45. Ying L, Lin X, Xie ZL, Tang FY, Hu YP, Shi KQ. Clinical utility of acoustic
radiation force impulse imaging for identification of malignant liver lesions:
a meta-analysis. Eur Radiol. 2012;22(12):2798–805.
46. Jiao Y, Dong F, Wang H, Zhang L, Xu J, Zheng J, et al. Shear wave
elastography imaging for detecting malignant lesions of the liver: a systematic review and pooled meta-analysis. Medical ultrasonography. 2017;
19(1):16–22.
47. Tang A, Cloutier G, Szeverenyi NM, Sirlin CB. Ultrasound Elastography and
MR Elastography for assessing liver fibrosis: part 2, diagnostic performance,
confounders, and future directions. AJR Am J Roentgenol. 2015;205(1):33–
40.
48. Hasab Allah M, Salama RM, Marie MS, Mandur AA, Omar H. Utility of point
shear wave elastography in characterisation of focal liver lesions. Expert
review of gastroenterology & hepatology. 2018;12(2):201–7.
49. Fahey BJ, Nightingale KR, Nelson RC, Palmeri ML, Trahey GE. Acoustic
radiation force impulse imaging of the abdomen: demonstration of
50. Frulio N, Laumonier H, Carteret T, Laurent C, Maire F, Balabaud C, et al. Evaluation of liver tumors using acoustic radiation force impulse elastography and correlation with histologic data. Journal of ultrasound in medicine : official journal of the American Institute of Ultrasound in
Medicine. 2013;32(1):121–30.
51. Heide R, Strobel D, Bernatik T, Goertz RS. Characterization of focal liver
lesions (FLL) with acoustic radiation force impulse (ARFI) elastometry.
Ultraschall Med. 2010;31(4):405–9.
52. Dong J, Qi X. Liver imaging in precision medicine. EBioMedicine.