1
Development and validation of a LC-MS/MS method for the quantification of
1the checkpoint kinase 1 (CHK1) inhibitor SRA737 in human plasma
23
Running title: Analysis of SRA737 in human plasma
4
5
6
M. Zangarini1, P. Berry1, J. Sludden1, F.I.Raynaud2, U. Banerji2, P Jones3, D. Edwards3 and 7
G.J. Veal1* 8
9
1 Newcastle Cancer Centre Pharmacology Group, Northern Institute for Cancer Research,
10
Newcastle University, Newcastle upon Tyne, UK 11
2 Cancer Research UK Cancer Therapeutics Unit, Division of Cancer Therapeutics, The
12
Institute of Cancer Research, London, UK 13
3 Cancer Research UK Centre for Drug Development, London, UK
14
15
The work was undertaken under the sponsorship and management of Cancer Research UK
16
Centre for Drug Development.
17
18
19
* Corresponding author: Dr Gareth J. Veal
20
Northern Institute for Cancer Research
21
Paul O’Gorman Building
22 Medical School 23 Framlington Place 24 Newcastle University 25
Newcastle upon Tyne NE2 4HH
26
UK
27 28
Tel: (+44) 0191 208 4332
29
Fax: (+44) 0191 208 3452
30
Email: [email protected]
2 Financial disclosure
32
Dr Raynaud and Dr Banerji are employees of the Institute of Cancer Research (ICR), which has
33
financial interest in the development of SRA737. The authors have no other relevant
34
affiliations or financial involvement with any organisation or entity with a financial interest in
35
or financial conflict with the subject matter or materials discussed in the manuscript apart
36
from those disclosed.
37
38
Acknowledgements 39
The work was undertaken under the sponsorship and management of Cancer Research UK
40
Centre for Drug Development.
41
42
Ethical conduct of research 43
The authors state that they have obtained appropriate institutional review board approval
44
or have followed the principles outlined in the Declaration of Helsinki for all human or
45
animal experimental investigations. In addition, for investigations involving human subjects,
46
informed consent has been obtained from the participants involved.
47
48
49
50
3
Development and validation of a LC-MS/MS method for the quantification of
52the checkpoint kinase 1 (CHK1) inhibitor SRA737 in human plasma
5354
Abstract 55
Background: SRA737 is an orally active small molecule inhibitor of Checkpoint kinase 1 being 56
investigated in an oncology setting. A HPLC-MS/MS method for quantifying plasma
57
concentrations of SRA737 was validated.
58
Methods & results: Sample preparation involved protein precipitation with acetonitrile 59
following addition of 13C15N deuterated SRA737 as internal standard. A rapid and selective
60
method was fully validated across a range of 5-20,000 ng/mL, exhibiting good sensitivity,
61
overall precision (expressed as CV) ≤8.0% and accuracy 96-102%. Consistently high recovery
62
was observed, with no matrix effect and a lower limit of quantitation of 5 ng/mL.
63
Conclusion: A novel method for analysing SRA737 in human plasma has been validated and is 64
now being utilised for quantification of SRA737 in a phase I trial.
65
66
Keywords: CCT245737, SRA737, CHK1, LC-MS/MS, validation study, pharmacokinetics,
67
cancer
68
4 Introduction
70
In an oncology setting the use of chemotherapy or radiotherapy is frequently associated with
71
DNA damage [1]. In response to DNA damage, cells activate the DNA damage response (DDR),
72
involving multiple signalling pathways such as cell cycle checkpoints, DNA repair,
73
transcriptional programs and apoptosis. Cells maintain genomic integrity via the DNA damage
74
response (DDR) which is critical for survival and proliferation. Intrinsic genomic instability and
75
an over-reliance on the DDR machinery is a hallmark feature of tumour development
76
prompting the development of agents targeting DDR signalling pathways, particularly
77
checkpoint kinase 1 (CHK1), which plays a key role in the DNA-damage checkpoint signal
78
transduction pathway [2]. CHK1 has been shown to play a role in the disruption or halting of
79
DNA replication to facilitate DNA repair following treatment with a variety of
80
chemotherapeutics in mammalian cells [3, 4]. CHK1 inhibitors are predicted to prevent cells
81
entering cell cycle arrest, thereby enhancing the activity of genotoxic agents such as
82
gemcitabine and cisplatin. Chk1 inhibitors are also predicted to demonstrate synthetic
83
lethality as monotherapy in tumours with certain genetic profiles.
84
SRA737 (formerly known as CCT245737) is an orally active small molecule inhibitor of CHK1
85
discovered at the Cancer Therapeutics Unit, Institute of Cancer Research, and developed for
86
use in an oncology setting [5]. Inhibition of CHK1 function by SRA737 can result in substantial
87
increases in the sensitivity of tumour cells to a variety of anticancer drugs [6, 7]. In this
88
respect, SRA737 was shown to improve gemcitabine and SN38 antitumor activity without
89
increasing toxicity in a human tumour xenograft model [7]. Following the generation of
90
promising preclinical data, SRA737 is currently being tested in a Phase I clinical trial setting.
91
To support the Phase I study of SRA737, a robust method for the quantification of SRA737 in
92
human plasma is required for the generation of pharmacokinetic data. Thus far, no validated
93
method for the quantification of SRA737 has been published. The current work describes the
94
development and validation of a high performance liquid chromatography tandem mass
95
spectrometry (LC–MS/MS) assay for the quantification of SRA737 in human plasma. The assay
96
has been validated according to European Medicines Agency (EMA) and US Food and Drug
97
Administration (FDA) guidelines for bioanalytical method validation [8, 9] and successfully
5
applied to support a pharmacokinetic study in advanced cancer patients in a Phase I clinical
99
trial setting.
100
101
6 Experimental
103
Standards & chemicals 104
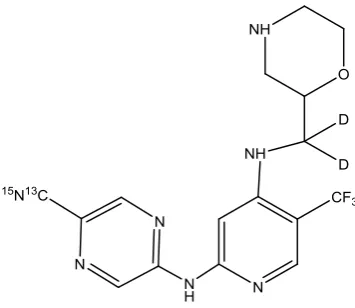
Analytical standards of SRA737 (MW 379.34 g/mol) and labelled SRA737 (13C15N deuterated
105
SRA737; MW 383.35 g/mol) were provided by Cancer Research UK (Figure 1). HPLC grade
106
acetonitrile, acetic acid and ammonium hydroxide were purchased from Fisher Scientific
107
(Leics, UK). Control human plasma with sodium citrate, used to prepare daily standard
108
calibration curves and quality control samples (QCs), was obtained from the Blood
109
Transfusion Centre (Newcastle, UK).
110
111
Standard solutions 112
Two separate stock solutions of SRA737 for standards and QCs were prepared in
113
dimethylformamide (DMF) at a concentration of 1 mg/mL. A stock solution of 13C15N
114
deuterated SRA737 (Internal Standard; IS) was prepared at 1 mg/mL in DMF. Stock solutions
115
were diluted serially in DMF to obtain working solutions, with final SRA737 concentrations of
116
0.4, 1, 2, 20, 100, 200 and 400 µg/mL for standards and 0.6, 60 and 300 µg/mL for working
117
solutions of QCs. These solutions were used to prepare calibration curve standards and QC
118
samples in control human plasma. The IS working solution was prepared at a concentration
119
of 1 μg/mL by diluting the stock solution with DMF. All solutions were stored at -20 °C prior
120
to use.
121
122
A ten-point calibration curve was utilised, with standard calibration samples prepared by
123
adding 10 μL of the working standard solutions to plasma (190 μL), to produce final SRA737
124
concentrations of 5, 10, 20, 50, 100, 150, 1000, 5000, 10000 and 20000 ng/mL. Each run
7
included a blank sample (plasma control processed without IS) and a zero blank sample
126
(plasma control processed with IS). The QC samples were prepared by adding 10 μL of each
127
working QC solution to human plasma control (190 μL) to obtain SRA737 concentrations of
128
30, 3000 and 15000 ng/mL.
129
130
Processing samples 131
Plasma aliquots (20 µL) from study samples, standards or QC samples were vortex mixed
132
with 10 µL (10 ng) of IS working solution and 100 µL of acetonitrile and samples were
133
centrifuged at 4000 g for 5 minutes at room temperature. The supernatant obtained (100
134
µL) was transferred to an Eppendorf tube and 100 µL of mobile phase A was added.
135
Following vortex mixing, samples were transferred to autosampler vials and 3 µL volumes
136
were routinely injected onto the HPLC-MS/MS system.
137
138
Chromatography conditions 139
A Prominence series HPLC system was utilised, consisting of a SIL-20AC XR autosampler, two
140
LC-20AD XR pumps, a CBM-20A communications bus module and a CTO-20AC column oven
141
(Shimadzu, Milton Keynes, Buckinghamshire, UK). A Phenomenex Kinetex C18 column (2.6
142
µm, 50.0 x 4.6 mm) with a Phenomenex Security guard containing a C18 cartridge (4 x 2mm)
143
was utilised for sample separation. Mobile phase A (MP A) consisted of 10 mM ammonium
144
acetate + 0.5% ammonia (v/v) and MP B was acetonitrile. The HPLC system was set at a
145
constant flow rate of 0.5 mL/min and run under gradient conditions: step 1 - 95% MP A for 1
146
min; step 2 - 95% MP A to 5% over 3 min; step 3 - constant for 1 min; step 4 - 5% MP A to
147
initial conditions over 1 min; step 5 - reconditioning for 4 min.
148
8 Mass spectrometry conditions
150
An API 4000 triple quadrupole mass spectrometer from SCIEX (Foster City, CA, USA) was
151
utilised in the current assay. MS parameters were optimised through the infusion of standard
152
solutions (10 ng/mL) of SRA737 and IS at a flow rate of 0.5 mL/min. Positive ion mode was
153
used to obtain the mass spectra (MS1) and the product ion spectra (MS2). Fragment selection
154
during compound tuning was based on an initial fragmentation screen which produced four
155
prominent fragments. These four fragments were further optimised for collision energy and
156
collision cell exit potential and the best three selected for flow injection analysis and
157
background testing. After testing in blank matrix under final chromatographic conditions, the
158
best performing fragment by signal-to-noise comparison was chosen as the final transition.
159
The instrument incorporated a Turbo Ion Spray source operated at 650°C, with voltage of
160
5500 V. Biological samples were analysed with electrospray ionization (ESI), using zero air as
161
the nebulizer gas (206.8 kPa) and as heater gas (482.6 kPa). Nitrogen was employed as curtain
162
gas (206.8 kPa) and as collision gas at 34.5 kPa (CAD). The declustering potential (DP) was
163
optimized and set to 71V for SRA737 and 61V for the 13C15N deuterated SRA737.
164
Quantification was carried out in Selected Reaction Monitoring (SRM) mode following the
165
transitions m/z 379.872 → 360.200 for SRA737 and m/z 384.086 → 324.200 for the IS. Data
166
processing was carried out with Analyst 1.6.2 software package (SCIEX).
167
168
Method validation 169
Validation of the method was carried out according to EMA and FDA bioanalytical method
170
validation guidance documents [8, 9]. Parameters validated included selectivity,
171
anticoagulant comparison, matrix effect, recovery, lower limit of quantification (LLOQ),
9
linearity and range, dilutional integrity, carry-over effect, intra/inter-assay precision, accuracy
173
and stability.
174
175
Selectivity 176
The selectivity of the method was assessed by analysing 6 independent sources of blank
177
plasma. Any response with similar retention time to the analyte was required to be ≤ 20% of
178
the response for the lowest concentration included in the standard curve. Any response with
179
a similar retention time to the IS was required to be ≤ 5% of the response for the IS peak [8,
180
9]. Experiments to investigate the interference of potentially co-administered drugs were not
181
carried out as part of the assay method validation.
182
183
Anticoagulant comparison 184
The potential effects of different anticoagulants were determined by analysing 3 replicates at
185
LQC and HQC concentrations of SRA737, which were prepared using blank plasma obtained
186
through the use of 3 different anticoagulants: sodium citrate, potassium EDTA and lithium
187
heparin. The coefficient of variation (CV) was required to be within 15% and accuracy within
188
85-115% [8, 9].
189
190
Matrix effect 191
Six independent sources of blank matrix for SRA737 at low and high QC concentrations and
192
for the IS were utilised to calculate the matrix factor (MF) for each analyte, i.e. the ratio of
193
the peak area of the analyte added to a pre-extracted sample to the peak area of an equal
194
amount of analyte in solvent. The IS normalised MF was calculated by dividing the MF of
195
SRA737 by the MF of IS. The CV of the IS-normalised MF was required to be within 15% [8, 9].
10 197
Recovery 198
Percentage extraction data were obtained using 3 QC concentrations (30, 3000 and 15000
199
ng/mL) for SRA737 and at 500 ng/mL for the IS in plasma samples processed in triplicate. The
200
peak area of SRA737 extracted from plasma samples was compared to the peak area in
201
absence of matrix (true concentration of the analyte in solvent) to calculate the absolute
202
recovery. The CV was required to be within 15% [8, 9].
203
204
Limit of quantification 205
The LLOQ for the assay was defined as the concentration of the lowest standard with precision
206
20% and accuracy within 80-120% of the nominal value, with a signal-to-noise ratio ≥10.
207
The defined LLOQ was assessed by preparing five plasma samples with SRA737 at a final
208
concentration of 5.0 ng/mL, with the experiment repeated on 4 separate days [8, 9].
209
210
Linearity and Range 211
Calibration curve linearity was investigated over seven working days, with the linear range
212
determined over one working day through the preparation of samples <50% of the lowest
213
concentration included in the standard curve and >150% of the upper limit of quantification
214
(ULOQ). The ratio of the HPLC-MS/MS peak area for SRA737 to IS was calculated for each
215
standard concentration and plotted against the nominal concentration of drug in the sample.
216
Standard curve linearity was assessed by regression analysis and goodness of fit using
217
Pearson’s determination coefficient R2 and through comparison of true and back-calculated
218
concentrations of calibration standards. Back-calculated values were required to be within
219
85-115% of the theoretical concentration (80-120% at the lowest concentration included in
11
the standard curve), and at least 75% of the standards were required to meet these criteria,
221
including the lowest and the highest calibrators [8, 9].
222
223
Dilution integrity and carryover 224
A 50 µg/mL solution of SRA737 was made in plasma and diluted 1 in 10 with control plasma
225
to generate a 5000 ng/mL standard. Samples were prepared in 5 replicates. Accuracy and
226
precision were required to be within ±15% [8]. Carryover of SRA737 and IS were evaluated by
227
placing a blank sample directly after the highest calibration standard. Carryover sample
228
analyte response was required to be ≤20% of the response observed for the lowest
229
concentration on the standard curve. The IS response in the carryover sample was required
230
to be ≤5% of the response for the control matrix + IS [8, 9].
231
232
Intra/Inter-assay precision and accuracy 233
Intra-day precision and accuracy were investigated using five replicates per QC concentration,
234
with data from four separate experiments carried out on different days generated to assess
235
inter-day precision and accuracy. The precision of the method at each concentration was
236
reported as the CV value, expressing the standard deviation as a percentage of the mean
237
calculated concentration; accuracy was determined by expressing mean calculated
238
concentrations as a percentage of the nominal concentration. Concentrations determined for
239
QC samples in each run were required to be within 15% of the nominal value, with the
240
exception of the LLOQ which should be within 20% [8, 9].
241
242
12
SRA737 stability in plasma was assessed by analysing low and high QC samples in triplicate
244
following storage under various different conditions. Short-term stability was investigated
245
using QC samples both unextracted and extracted (autosampler stability) from the plasma
246
matrix after 7 days storage at 4°C, with bench-top stability at room temperature calculated
247
over 4 h. Freeze–thaw stability was determined for three cycles over a range of -20°C and
248
room temperature. Long-term stability was investigated using QC samples stored for 8
249
months at -20°C. SRA737 QC samples were analysed against a calibration curve generated
250
from freshly spiked standards, with the concentrations determined compared to the nominal
251
concentrations. The mean obtained QC concentration was required to be within ±15% of the
252
nominal concentration [8, 9].
253
254
Application of method to clinical sample analysis 255
The method was used to quantify SRA737 plasma concentrations in a patient with advanced
256
cancer treated on the ongoing Phase I clinical trial of SRA737 administered as single agent
257
monotherapy (EudraCT number 2015-004486-86). Blood samples for pharmacokinetic
258
analysis were obtained prior to administration of a single oral dose of 40 mg SRA737 and at
259
0.5, 1, 2, 4, 6, 8, 12 and 24 h post-administration. Blood samples (2 mL) were collected into
260
EDTA tubes and centrifuged at 1200 g for 5 min at 4°C. Plasma was separated and frozen at
-261
20°C prior to analysis as described above.
262
263
13 Results & discussion
265
HPLC-MS/MS 266
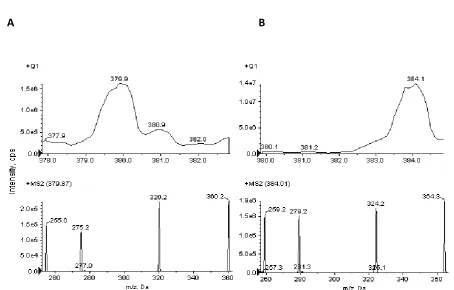
Using an ESI source in positive ion mode, SRA737 formed mainly a molecular ion M+ at m/z
267
379.872, while 13C15N deuterated SRA737 (IS) formed a protonated molecule [M+H]+ at m/z
268
384.086. These precursor ions passed through the first quadrupole into the collision cell and
269
the collision energy (CE) was optimized to obtain a high signal for the product ions generated.
270
After fragmentation, the characteristic products were monitored in the third quadrupole at
271
m/z 320.2 (35 eV), 360.2 (25 eV) and 255.0 (39 eV) for SRA737 and at m/z 324.2 (33 eV) and
272
259.2 (39 eV) for the IS. The fragmentation patterns are presented in Figure 2; SRA737 and IS
273
were quantified using the transitions m/z 379.872 → 360.200 (Figure 2A) and m/z 384.086 →
274
324.200 (Figure 2B). Figure 3 represents typical SRM chromatograms, using the same SRA737
275
and IS transitions as above. Figure 3A shows an extracted blank plasma sample; Figure 3B
276
shows an extracted blank plasma sample with IS added; Figure 3C represents an extracted
277
plasma sample at the LLOQ (5 ng/mL) with IS. The elution of the analytes was efficient and
278
selective, SRA737 and IS being eluted at ∼4 min. No interfering peaks were observed at these
279
retention times and the peaks were completely resolved from the plasma matrix with good
280
peak shape observed. The specificity of the method was confirmed by analysing six
281
independent sources of blank human plasma.
282
283
Method validation 284
Selectivity 285
Selectivity was evaluated on 6 different batches of human plasma, including haemolysed
286
plasma. The method shown to be selective with an absence of interfering components.
14
Response with similar retention time was <7 % of the LOQ and <1 % for the IS in six batches
288
of plasma evaluated.
289
290
Anticoagulant comparison and matrix effect 291
The potential effect of different anticoagulants was determined by analysing 3 replicates at
292
LQC and HQC concentrations of SRA737, prepared using blank plasma obtained through the
293
use of potassium EDTA and lithium heparin, as compared to control citrate plasma. No effect
294
of different anticoagulants was observed, with a calculated CV ≤ 4.8 % and accuracy within
295
the range 97-100 %, indicating that plasma obtained from blood samples collected with any
296
of these commonly used anticoagulants could be utilised to generate accurate results. The
297
matrix effect was evaluated on 6 different batches of human plasma, including haemolysed
298
plasma at LQC and HQC concentrations. There were no significant differences between the
299
six lots evaluated by assessment of IS-corrected matrix factor, with calculated values of 1.02
300
± 0.03 for LQC (CV 3.4%) and 0.96 ± 0.02 for HQC (CV 2.1 %).
301
302
Recovery and limit of quantification 303
Recovery was determined in triplicate using three QC concentrations through comparison of
304
peak areas of spiked plasma samples following extraction, with peak areas obtained from
305
direct injection of SRA737 standards in mobile phase. Recovery percentages for SRA737 were
306
114%, 95.7% and 93.7% at concentrations of 30, 3000 and 15000 ng/mL, respectively, with a
307
recovery of 102% observed for the IS. There were no significant variations (1.8-8.3%) for the
308
peak areas of SRA737 and IS and all data generated were in the anticipated and acceptable
309
range. The LLOQ concentration in plasma was defined to be 5.0 ng/mL, with precision and
310
accuracy of 5.4% and 102.9%, respectively determined by preparing five plasma samples with
15
CCT245737 at a final concentration of 5.0 ng/mL, with the experiment repeated on 4 separate
312
days, at this concentration of SRA737 (see Table 2). For LLOQ and LQC concentrations the
313
volume of injection was increased from 3 µL to 10 µL. All results are expressed as a ratio of
314
the peak area of SRA737 to IS and therefore the overall data generated are unaffected by
315
sample volume.
316
317
Linearity and Range 318
Linearity was investigated over ten concentrations of SRA737 (range 5-20000 ng/mL), with a
319
linear correlation of ≥0.997 calculated from 7 separate experiments. The calibration curve
320
was typically described by the linear equation y = 1.75x + 0.003, with 1/y2 weighting. The
321
weighting of 1/y2 gave the best linear response, with consistent % relative error values across
322
the standard curve concentration range and correlation coefficients with excellent
323
reproducibility. Table 1 shows linearity and range data over a SRA737 concentration range of
324
5-20000 ng/mL.
325
326
Dilution integrity and carryover 327
A 50 µg/mL spiked sample was generated in plasma and diluted 1 in 10 in plasma to a
328
concentration of 5000 ng/mL, with an accuracy of 91% observed. Carry-over effects were
329
negated by injecting 2 mobile phase samples and 2 extracted blank plasma samples after the
330
injection of ULOQ samples or high concentration samples.
331
332
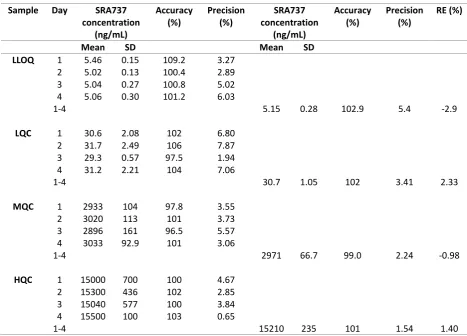
Intra/Inter-assay precision, accuracy and stability 333
The intra-assay study showed precision ≤5.6 % and accuracy ranging from 96.5 - 100 % (n =
334
5). The inter-assay study over four days showed precision ≤7.9 % and accuracy 96.5 - 106 %
16
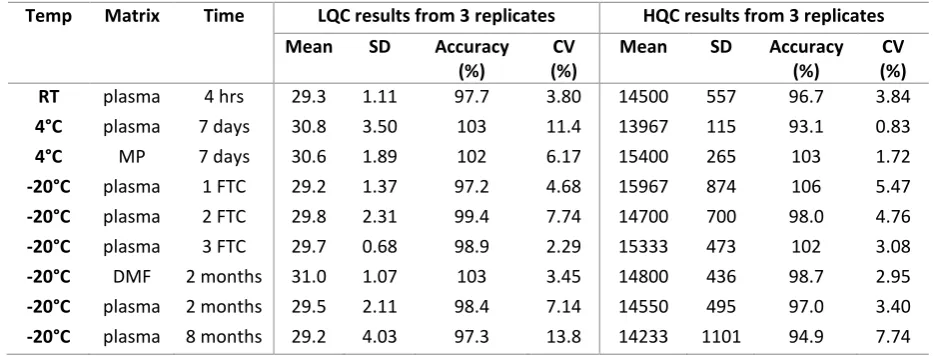
as shown in Table 2. SRA737 stability in plasma was determined by analysing triplicate QC
336
samples at low and high concentrations. SRA737 was stable in plasma for at least 4 h at room
337
temperature and for 7 days at 4°C both before and after drug extraction. SRA737 was stable
338
in plasma at -20°C after 8 months of storage and over 3 freeze-thaw cycles. Standard working
339
solutions of SRA737 and IS, prepared in DMF and stored at -20°C, were stable for at least 2
340
months. Table 3 provides a summary of the stability data generated as part of the assay
341
validation. In addition to these stability experiments formalised in the method validation plan,
342
experiments were also carried out to investigate the impact of storing whole blood samples
343
from patients who have received SRA737, for defined time periods ahead of plasma
344
separation and storage. Results indicated that storage of whole blood samples for 8 h or 24 h
345
at either room temperature or 4°C had no effect on the concentration of SRA737 determined
346
in plasma, with mean values varying <5% from data obtained when whole blood samples were
347
centrifuged immediately following collection.
348
349
Clinical sample analysis 350
Analysis of plasma samples obtained from a patient receiving a single oral dose of 40 mg
351
SRA737 indicated that the assay could successfully be utilised to quantify SRA737 in clinical
352
trial samples. Figure 3D shows an SRM chromatogram obtained from an extracted plasma
353
sample collected from a patient receiving SRA737 and Figure 4 shows the plasma
354
concentration-versus-time curve for SRA737 at a dose of 40 mg. Quantifiable drug levels were
355
measured over a 24h period following drug administration, with a Cmax of 95 ng/mL observed
356
at a Tmax of 1 h.
357
358
17 Conclusions & future perspective
360
The bioanalytical method described has been validated for the quantitative measurement of
361
the CHK1 inhibitor SRA737 in human plasma obtained from patients currently participating in
362
early phase clinical trials with this promising drug candidate. The method utilises small plasma
363
volumes, is rapid, highly sensitive, precise and accurate. The observed limit of quantification
364
clearly facilitates the determination of SRA737 concentrations in clinical samples, even at low
365
doses administered during the early patient cohorts recruited to the ongoing clinical trials.
366
367
Experiments to investigate the interference of potentially co-administered drugs were not
368
carried out as part of the assay method validation as it was felt that it was unlikely that
co-369
administered drugs with contrasting chemical structures would interfere with the assay and
370
due to the number of potentially co-administered drugs being prescribed in late stage cancer
371
patients participating in a phase I clinical trial. However, further experiments to investigate
372
potential interactions with specific co-administered anticancer drugs may be warranted for
373
future drug combination studies. It should also be highlighted that as SRA737 is at an early
374
stage of clinical development, incurred sample reanalysis experiments have not yet been
375
carried out. The FDA guidance and EMEA guideline on Bioanalytical method validation
376
stipulate that 7-10% of the samples should be analysed around the Cmax and in the
377
elimination phase. Further information will be gathered on these aspects prior to initiating
378
incurred sample reanalysis studies.
379
18
The assay is now being utilised to generate novel data concerning the pharmacokinetics of
381
SRA737, facilitating investigations into the importance of systemic drug exposure to this agent
382
in determining clinical response and toxicity in cancer patients.
383
19 Executive Summary
385
Background 386
• a HPLC-MS/MS method was developed to quantify the novel anticancer drug SRA737 in
387
human plasma obtained from patients participating in an early phase clinical trial.
388
Experimental 389
• The method utilises small samples volumes (20µL), involving protein precipitation with
390
acetonitrile and use of 13C15N deuterated SRA737 as internal standard.
391
Results and discussion 392
• A rapid and selective assay was developed according to EMA and FDA guidelines for
393
bioanalytical method validation, covering a range of 5-20,000 ng/mL as appropriate for the
394
analysis of drug levels in patient samples.
395
• The method is being utilised successfully to quantify SRA737 in clinical samples obtained
396
from patients participating in an ongoing phase I trial.
397
20 References
399
1. Goldstein M, Kastan MB. The DNA damage response: implications for tumor responses
400
to radiation and chemotherapy. Annu. Rev. Med. 66, 129–143 (2015).
401
2. Sanchez Y, Wong C, Thoma RS, Richman R, Wu Z, Piwnica-Worms H, Elledge SJ.
402
Conservation of the Chk1 checkpoint pathway in mammals: linkage of DNA damage to
403
Cdk regulation through Cdc25. Science 277(5331), 1497–1501 (1997).
404
3. Karnitz LM, Flatten KS, Wagner JM et al. Gemcitabine induced activation of checkpoint
405
signaling pathways that affect tumor cell survival. Mol. Pharmacol. 68(6), 1636–1644
406
(2005).
407
4. Morgan MA, Parsels LA, Parsels JD, Mesiwala AK, Maybaum J, Lawrence TS. Role of
408
checkpoint kinase 1 in preventing premature mitosis in response to gemcitabine.
409
Cancer Res. 65(15), 6835–6842 (2005). 410
5. Osborne JD, Matthews TP, McHardy T, et al. Multiparameter lead optimization to give
411
an oral Checkpoint Kinase 1 (CHK1) inhibitor clinical candidate:
(R)-5-((4-((Morpholin-412
2-ylmethyl)amino)-5-(trifluoromethyl)pyridin-2-yl)amino)pyrazine-2-carbonitrile
413
(CCT245737). J. Med. Chem. 59(11), 5221-5237 (2016).
414
6. Walton MI, Eve PD, Hayes A, et al. The preclinical pharmacology and therapeutic
415
activity of the novel CHK1 Inhibitor SAR-020106. Mol. Cancer Ther. 9(1), 89-100 (2010).
416
7. M.I. Walton, P.D. Eve, A. Hayes, et al. The clinical development candidate CCT245737
417
is an orally active CHK1 inhibitor with preclinical activity in RAS mutant NSCLC and
Eμ-418
MYC driven B-cell lymphoma. Oncotarget 7(3), 2329–2342 (2016).
419
8. European Medicines Agency. Guideline on bioanalytical method validation.
420
Committee for Medicinal Products for Human Use (CHMP), London, UK (2011).
421
www.ema.europa.eu/docs/en_GB/document_library/Scientific_guideline/2011/08/
422
WC500109686.pdf
423
9. US Food and Drug Administration. Guidance for industry bioanalytical method
424
validation. Center for Drug Evaluation and Research (CDER) (2001).
425
www.fda.gov/downloads/Drugs/Guidance/ucm070107.pdf
21 TABLES
427
Table 1. Inter-day linearity, accuracy and precision of calibration curves of SRA737 in human plasma 428
429
SRA737 plasma concentrations (ng/mL)
Day 5.0 10.0 20.0 50.0 100 500 1000 5000 10000 20000
1 4.9 10.5 19.7 51.7 99 547 988 5049 9794 18865
2 5.2 9.8 18.5 51.6 103 509 1068 5174 9300 20160
3 4.9 10.1 19.9 51.6 104 554 1030 5158 9302 18018
4 5.0 9.7 21.6 51.9 101 532 1023 4933 9900 18085
5 5.0 9.7 20.6 51.9 107 485 998 5367 10053 18116
6 5.0 10.0 19.1 53.5 102 491 979 5504 9143 20633
7 5.0 9.9 19.8 48.9 105 515 1037 5414 9286 19504
Mean (n=4) 5.0 10.0 19.9 52 103 519 1018 5229 9540 19054
SD 0.1 0.3 1.0 1.4 2.6 26.6 31.2 207.0 363.7 1068.4
Accuracy (%) 100.1 99.7 99.4 103.2 103.1 103.8 101.8 104.6 95.4 95.3
Precision (%) 1.8 2.9 5.1 2.7 2.5 5.1 3.1 4.0 3.8 5.6
SD: Standard deviation 430
431
432
433
22
Table 2. Intra/Inter-day precision and accuracy of the method for the analysis of SRA737 in human 435
plasma (LLOQ, LQC, MQC and HQC) 436
437
Sample Day SRA737
concentration (ng/mL)
Accuracy (%)
Precision (%)
SRA737 concentration
(ng/mL)
Accuracy (%)
Precision (%)
RE (%)
Mean SD Mean SD
LLOQ 1 5.46 0.15 109.2 3.27
2 5.02 0.13 100.4 2.89
3 5.04 0.27 100.8 5.02
4 5.06 0.30 101.2 6.03
1-4 5.15 0.28 102.9 5.4 -2.9
LQC 1 30.6 2.08 102 6.80
2 31.7 2.49 106 7.87
3 29.3 0.57 97.5 1.94
4 31.2 2.21 104 7.06
1-4 30.7 1.05 102 3.41 2.33
MQC 1 2933 104 97.8 3.55
2 3020 113 101 3.73
3 2896 161 96.5 5.57
4 3033 92.9 101 3.06
1-4 2971 66.7 99.0 2.24 -0.98
HQC 1 15000 700 100 4.67
2 15300 436 102 2.85
3 15040 577 100 3.84
4 15500 100 103 0.65
1-4 15210 235 101 1.54 1.40
438
NA: Not applicable; SD: Standard Deviation; RE: Relative Error 439
23
Table 3. Short and long-term stability data for SRA737 in various different matrices 441
442
Temp Matrix Time LQC results from 3 replicates HQC results from 3 replicates
Mean SD Accuracy
(%)
CV (%)
Mean SD Accuracy
(%)
CV (%)
RT plasma 4 hrs 29.3 1.11 97.7 3.80 14500 557 96.7 3.84
4°C plasma 7 days 30.8 3.50 103 11.4 13967 115 93.1 0.83
4°C MP 7 days 30.6 1.89 102 6.17 15400 265 103 1.72
-20°C plasma 1 FTC 29.2 1.37 97.2 4.68 15967 874 106 5.47
-20°C plasma 2 FTC 29.8 2.31 99.4 7.74 14700 700 98.0 4.76
-20°C plasma 3 FTC 29.7 0.68 98.9 2.29 15333 473 102 3.08
-20°C DMF 2 months 31.0 1.07 103 3.45 14800 436 98.7 2.95
-20°C plasma 2 months 29.5 2.11 98.4 7.14 14550 495 97.0 3.40
-20°C plasma 8 months 29.2 4.03 97.3 13.8 14233 1101 94.9 7.74
443
RT: Room temperature; MP: Mobile phase; FTC: Freeze thaw cycle; DMF: Dimethylformamide 444
445
446
24 Figure Legends
448
449
Figure 1. Chemical structures of (A) SRA737 (Molecular Weight: 379.34) and (B) labelled 450
SRA737 ([13C15N] deuterated SRA737) (Molecular Weight: 383.35)
451
452
Figure 2. MS and MS/MS mass spectra of (A) SRA737 and (B) IS ([13C15N] deuterated SRA737).
453
454
Figure 3. (A) SRM chromatograms of a human blank plasma sample (volume of injection 3 µl); 455
(B) SRM chromatograms of a human blank plasma sample with IS (volume of injection 3 µl);
456
(C) signal-to-noise ratio of SRA737 at the LLOQ (volume of injection 10 µl); (D) SRM
457
chromatograms showing SRA737 and the IS of a plasma sample collected from a patient
458
receiving a single oral dose of 40mg SRA737 (volume of injection 3 µl).
459
460
Figure 4. Plasma concentration-versus-time profile of SRA737 in a patient following a single 461
oral administration of 40mg SRA737.
462
25
Figure 1 464
465
466
A B
467
468
26
Figure 2 470
471
472
A B
473
474
27
Figure 3 476
477
478
479
28
Figure 4 481
482