Journal of
Applied Research on Industrial Engineering
Journal of Applied Research on Industrial Engineering
Vol. 2, No. 3 (2015) 139-153
Ranking Practicable Technologies Within The Science And Technology
Corridor Of Isfahan, Using MCDM Techniques
Esmail Najafi
1, Mohsen Amiri
2, Vahid Abdolah Zadeh
31Professorof Industrial Engineering, Azad University, Research & Science Branch, IRAN([email protected]) 2 PhD student of Industrial Engineering, Azad University, Research & Science Branch, IRAN ([email protected])
3
PhD student of Industrial Engineering .Azad University, Research & Science Branch, IRAN ([email protected])
A B S T R A C T A R T I C L E I N F O
National and regional growth and development models in the developing countries whose development attributes are far different from those of the developed countries, must be in such a way to allow the corresponding country or region to develop at the minimum cost within the shortest possible period of time. One of the successful approaches toward national and regional development models is to rely on a development model which is based on extending and developing science and technology corridors. This study is aimed at ranking practicable technologies within the science and technology corridor of Isfahan using multiple attribute decision-making process. Since the technology and science corridor are new issues in IRAN and there had been no researches on identification and selection of applicable technologies, the work on this issue was very innovative, also application of 3 methods of decision making for upgrading of reliability is the outstanding criteria of this research. For this purpose, 13 attributes were utilized (categorized into 6 groups) and AHP, TOPSIS and SAW techniques were employed to rank technologies, so that the following order of preference was suggested for the practicable technologies within the science and technology corridor of Isfahan:1) Information and communication technology, 2) material technologies, 3) bio-technology, 4) energy technology, 5) Nano-technology, 6) environmental technology, 7) laser and optic technology, 8) nuclear technology.
Article history : Received: 25 June 2015 Received in revised format: 27 July 2015
Accepted: 6 September 2015 Available online: 5 October 2015
Keywords :
Ranking, Technology knowledge-based economy , Science and technology corridor, MCDM
1.
Introduction
140
The knowledge, which is the starting point toward growth and development via this newdevelopment approach, relies on trained and efficient personnel, innovation and creativity, entrepreneurship and novel technologies. An optimum combination of these elements makes it possible to transit from traditional production structure into knowledge-based production structure (Saxenian, 1994).
Science and technology corridors have played an important role as one of the primary tools to facilitate the approach toward knowledge development. A Science and technology corridor – sometimes referred to as a science and technology cluster or a science and technology park – is a network of mass scientific, industrial, production, laboratory and research facilities along with communication infrastructures, persons and information all coordinated toward well-defined purposes and solutions on the basis of a well-established system within a geographical trend, so as to synergize among existing organizations, centers and institutions within the corridor by attracting national and regional capitals and sharing interests provided by all shareholders leading to enhance innovation and science and technology development thereby developing production and economy and establishing a knowledge-based society (Din Mohammadi, 2005).
Many developing countries have already succeeded in providing fundamental robust planning in this regard, most of which have already led to desired results. According to the report by Nordicity Group, there are around 200 science and technology areas at national or regional levels in USA, Canada, France, Germany, Italy, Spain and Japan, which are active in the course of attracting investments on knowledge-based industries (Din Mohammadi, 2005).
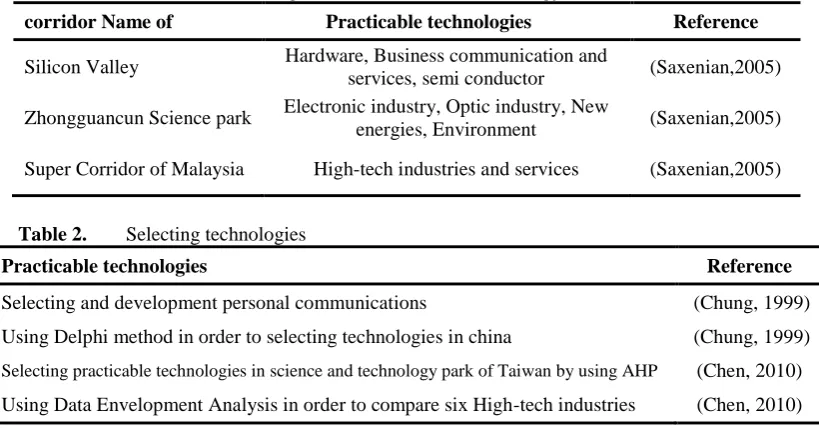
In the Iran’s 20-year vision plan (Iran’s 2021 horizon), achieving a GDP1 of more than 520 Billiard Dollars is a set target. Considering the present status of OECD countries, if we want to achieve a higher than 50% contribution of knowledge-based economy in 2021 horizon, it is necessary to raise the value of hi-tech and relatively hi-tech industries and services up to 260 Billiard Dollars requiring about 65000 small and medium-scale knowledge-based companies to be active (Iran’s fifth Development Plan,2007). Such a rate of growth can only be realized when environmental and legal provisions have well prepared the basis for fostering such a number of knowledge-based companies. As was mentioned before, science and technology corridors are among the best physical bases on which such a growth can be realized. Isfahan enjoys suitable geographic and physical conditions, adequate human resources and software infrastructures, economic sectors and technological structure consistent with evolutions of knowledge-based economy, capabilities and previous experiences in terms of international linkages and special mission concerned with knowledge-based economy, so as it was chosen as the first option within which to establish a science and technology corridor. “Science and technology” constitutes the main building block of the designation of these corridors. Technology, as a principal component of these corridors, plays a significant role in achievability of the purposes of the corridors. Considering hi-techs, providing a basis on which technology can develop via interactions with up-to-date knowledge and modern technologies and, in general, national and regional plans for technology development constitute core components of the corridors. Furthermore, numerous researches have been conducted on the selection and prioritization of technologies within recent years (Table 1&2).
141
Table 1. Practicable technologies in the science and technology corridors
Name of
corridor Practicable technologies Reference
Silicon Valley Hardware, Business communication and
services, semi conductor (Saxenian,2005)
Zhongguancun Science park Electronic industry, Optic industry, New
energies, Environment (Saxenian,2005)
Super Corridor of Malaysia High-tech industries and services (Saxenian,2005)
Table 2. Selecting technologies
Practicable technologies Reference
Selecting and development personal communications (Chung, 1999)
Using Delphi method in order to selecting technologies in china (Chung, 1999)
Selecting practicable technologies in science and technology park of Taiwan by using AHP (Chen, 2010) Using Data Envelopment Analysis in order to compare six High-tech industries (Chen, 2010)
The results of this research study can be considered as an appropriate guide for executive decision-makers in the course of deploying adequate technologies in the science and technology corridor of Isfahan, eventually leading in maximum utilization of national and regional capacities, developing better and more suitable markets via a proper selection of technologies, achieving a proper regional and national position in terms of technology and enhancing competition capabilities of production and service sectors within the selected technologies (Din Mohammadi, 2005).
This research is an attempt to investigate and compare proper decision-making models in order to reach valid results and Since the technology and science corridor are new issues in IRAN and there had been no researches on identification and selection of applicable technologies, the work on this issue was very innovative, also application of 3 methods of decision making for upgrading of reliability is the outstanding criteria of this research.
In the following, we begin by a description of methodology to identify those technologies which can be deployed in the science and technology corridor of Isfahan. After that, attributes to be used for prioritization of the identified technologies are discussed, while introducing the population, sample and data gathering methods. Finally, AHP, TOPSIS and SAW models are designed and implemented. It is recommended that a multi objective decision making methods to be considered in future research for the decision making issues in technology and science corridors.
2.
Identification of practicable technologies
142
technologies at three levels: international level, national level and province level(Ahmadi,2003).
The importance and pervasion of knowledge-based economy is in such a level that knowledge-based developments serve as a core strategy for the developed countries (Din Mohammadi, 2005). By technology we mean well-defined knowledge-based industries and services presented by OECD countries. Based on this definition, all industries and technologies enjoy a degree of knowledge as an input for the production process; however, knowledge-based industries differ from other industries in the density and contribution of knowledge input to the production process, not solely employment or non-employment of knowledge. When providing an operational definition of the extent to which knowledge-based economy is present in the member nations, OECD organization have categorized various industries and services into the following categories and sub-categories:
A) Hi-tech industries, B) middle range hi-tech industries, C) middle range low-tech industries, D) low-tech industries, E) other services (not based on knowledge), F) services (services having the potential to be knowledge-based).
The industries in categories A and B, the services in category F, and also modern technologies (information and communication technology, bio-technology, material technology and energy technology) constitute a category referred to as knowledge-based technologies, industries and services (Saxenian, 1994).
There is also a great emphasize on knowledge-based economy at national level. In this regard, various legislative and regulatory provisions are provided in Islamic Republic of Iran’s 20-year vision plan and the fourth development plan of (clauses 43, 44, 45 and 46). A review on rational requirements in terms of expected developments in Isfahan Province in the course of 20-year vision reveals the role of knowledge-based economy and modern technologies in economic blossoming of the province (Iran’s 20-year Provision Plan,2001). According to what was already mentioned, no one can deny associated impacts of knowledge-based economy on the economy of societies within the third millennium. On the other hand, Iran’s 20-year provision plan as well as the fourth development plan not only emphasize on knowledge-based development, but also directly suggest investments on a set of particular technologies neglecting which may not seem to be logical. According to the above mentioned points the selected technologies is based on the OECD organization model which introduced the knowledge- based technology and services. Also it is selected based on technologies emphasis in five years development plan:
1. The first category: knowledge-based technologies (OECD pattern) including: a. Information and Communication Technologies (ICT),
b. Nano-technology (NANO.T), c. Bio-technology (BIO.T)’
d. Material Technology (MATERIAL), e. Energy Technology (ENERGY).
2. The second category: emphasized technologies at national and province levels: a. Laser and Optic Technology (LA & OP),
143
3.
Decision attributes
Knowing that other factors than solely economic and financial ones, such as strategic decisions, may contribute to decisions on choosing technologies, it is necessary to have attributes which allow a comparison to be made among different technologies. Accordingly, for the sake of analysis in this research, 13 simple, significant, common sub-attributes related to Iran’s situation were introduced based on studying required documents and records for identification of and choosing technologies. The sub-attributes are categorized into 6 categories of economic and financial, strategic, technical, environmental, resource accessibility and political, based on their contributions into the corridor performance (Table 3).
Table 3 Criteria and sub criteria for ranking practicable technologies
Criteria Sub criteria
Reference
Economical & Financial Profitability
(Haj Fathaliha,1993) (Ramanthan,2001) (Golestaneh,2002) (Yadollahi Farsi,1995)
Market demand (Golestaneh,2002)
(Va’ez Zadeh,2004) (Mahnak,2003)
Strategic Localization
(Ramanthan,2001) (Mahnak,2003) (Ghazi Noori,2000) (Alvani, 2001)
Occupation (Haj Fathaliha,1993)
(Bayat, 2003)
National security (Ramanthan,2001)
(Va’ez Zadeh,2004)
Technical Efficiency & Productivity
(Ramanthan,2001) (Yadollahi Farsi,1995)
Flexibility (Haj Fathaliha,1993)
(Ghazi Noori,2000)
Environment -
(Golestaneh,2002) (Bayat, 2003)
Resource Equipment
(Ramanthan,2001) (Yadollahi Farsi,1995) (Ghazi Noori,2000)
Row material & energy (Mahnak,2003)
(Science and …,2003) (Alvani, 2001)
Human resource (Haj Fathaliha,1993)
(Ramanthan,2001) (Yadollahi Farsi,1995) (Science and …,2003)
Political External politics
(Haj Fathaliha,1993) (Golestaneh,2002)
Internal politics
(Mahnak,2003)
144
4.
Modeling
Multiple attribute decision-making technique is applied where more than one attributes determine the optimum output. These decision-making models are divided into two main groups:
- Multiple objective decision-making techniques, - Multiple attribute decision-making techniques,
Each multi-attribute decision-making technique or method follows a particular approach toward evaluating different solutions based on which it will provide a set of results for the decision-maker. In terms of data analysis method, these techniques can be categorized into two categories: compensatory methods and non-compensatory methods (Mehregan,2013). Compensatory methods work to exchange information on various attributes to compensate weaknesses of an attribute in a particular alternative by the strengths of other attributes. Among the available compensatory methods:
- AHP method was chosen because of its ability to calculate consistency rate for group applications, so as to promote a kind of control over the course of calculations leading to higher confidence of the results produced via this method;
- TOPSIS method was selected because it first finds the ideal positive and negative solutions before ranking them with respect to their distance from the ideal positive option; and
- SAW method was selected because it opts for the alternative with the maximum weighted average, so SAW method can be seen as a specific case of TOPSIS method where block distances are utilized, and also as an evaluation tool for examining TOPSIS method (Shirouyehzad, 2014).
Since different methods follow different approaches toward ranking practicable technologies in the science and technology corridor of Isfahan, it is expectable to see different prioritizations produced via different methods. Following with this section, data gathering tools are introduced along with design and implementation techniques employed.
4.1.
Research methodology
Since the case under study relates to the present time and the researcher is looking for a better and more comprehensive characterization of the present situation using data gathering and the information he gained from experts’ opinions on the present situation, and also considering non-judged descriptions presented on the conditions as well as the constituent elements of the subject matter, this research is a descriptive research in terms of the applied methodology, while it is an applied research with respect to its scope.
4.2.
Data gathering tools, research population and statistical sample
145
council. In order to achieve valid results, sample size was chosen to be equal to that of thepopulation.
4.3.
Analytic hierarchy process (AHP)
AHP method is a tool which, along with the mathematical techniques, can be employed to establish allocation target. One of its features is that the decision and selection processes are based on the expert’s opinions. Analytic hierarchy process can be designed and implemented in five main steps: forming hierarchical tree, pairwise comparison of alternatives and investigation attributes, data calculation operation, sensitivity and consistency rate analyses. In this study, we are looking for an applicable pattern of prioritization of the practicable technologies in the science and technology corridor of Isfahan via the mentioned method using Expert Choice software (Ghodsi pur,2001).
4.3.1.
Hierarchical tree
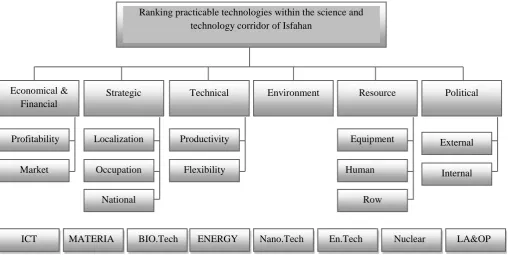
In this methodology, the modeling procedure was based on a hierarchical tree of AHP which described the problem under study. In this tree, the first level was the scope, the second one contained the attributes, the third one included sub-attributes and the last one was filled by competing alternatives (Ghodsi pur,2001). The aim of this research was to prioritize the practicable technologies in the science and technology corridor of Isfahan. Economic-financial, strategic, technical, environmental, resource accessibility and political factors were decision attributes used to evaluate competing alternatives. However, these attributes were categorized into previously mentioned sub-attributes which constituted the third level. Several technologies were identified as the practicable technologies form the third level. Accordingly, the hierarchical tree of the AHP is presented in the following (Figure 1).
4.3.2.
Pairwise comparison table
There are three types of tables in this section including the table of pairwise comparison of alternatives with the last level of attributes, the table of pairwise comparison of sub-attributes with the sub-attributes, and finally the table of pairwise comparison matrix of different attributes with each other. In AHP method, fuzzy logic is used as a continuous approach to prepare a 9th order table. This table will include integer numbers of 1 to 9, each showing a comparison output (where 1 indicates the same preference or importance, 3 indicates slightly more preferred or important, 5 shows highly preferred, 7 indicates much highly preferred or more important, and 9 indicates definitely preferred or more important) (Ghodsi pur,2001).
4.3.3.
Preference extraction
146
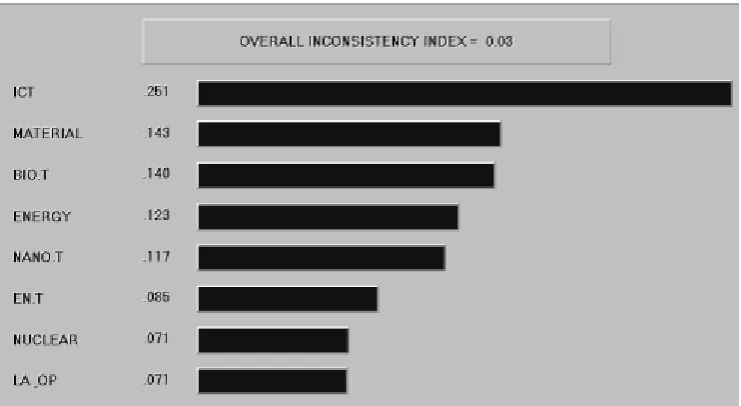
quantitative information, all the data was qualitatively gathered from the corresponding experts’opinions. Ultimate weights of alternatives were calculated via harmonic averaging procedure (Mehregan,2013). Finally, the practicable technologies were ranked based on the order of preferences using AHP method, as follows:
1) Information and communication technology, 2) material technology, 3) bio-technology, 4) energy technology, 5) nano-technology, 6) environmental technology, 7) nuclear technology, and 8) laser and optic technology.
Fig. 1. Hierarchy tree
4.3.4.
Consistency rate
Consistency rate is a mechanism through which the validity of participators is examined using comparison matrices. The mechanism determines the extent to which the responds from the participators to attributes, sub-attributes and alternatives’ comparisons have been logically valid. In AHP, the maximum tolerable rate of consistency is 0.1. Consistency rate is calculated in 6 steps including calculation of averaged sum vector, consistency vector, averaged consistency vector, consistency attribute and consistency rate (Mehregan,2013). A consistency rate of less than 0.1 was obtained for all of the pairwise comparison tables indicating logical validity of the responds from the participators.
4.3.5.
Sensitivity analysis
Sensitivity analysis is used to measure sensitivity of alternatives to a change in priorities of attributes. This allows one to virtually increase or decrease the weights of attributes and see the resulting effects on the ranking process of the alternatives. Following with the article we will see how a change in the weights of attributes may change the order of preferences in terms of practicable technologies in the science and technology corridor of Isfahan (Tables 3 to 8).
Ranking practicable technologies within the science and technology corridor of Isfahan
Environment Economical &
Financial
Profitability
Market
Technical
Productivity
Flexibility
Political
External
Internal Strategic
Localization
Occupation
National Security
Resource
Equipment
Human
Row Material
ICT MATERIA
L
147
Fig. 2. Ranking practicable technologies within the science and technology corridor by AHP
Table 4. Sensitivity analysis compared to strategic criteria
100 60 24.6 14.4 8.8 0
WEIGHT- S %
1 1 1 1 1 1 ICT 3 3 3 2 2 2 MATERIAL.T 2 2 2 3 3 3 BIO.T 4 4 4 4 4 4 ENERGY.T 5 5 5 5 5 5 NANO.T 7 7 6 6 6 6 EN.T 6 6 7 7 8 8 NUCLEAR 8 8 8 8 7 7 LA&OP
Table 5. Sensitivity analysis compared to technical criteria 100 64.1 61.9 33.6 17.3 10.4 0
WEIGHT- T %
148
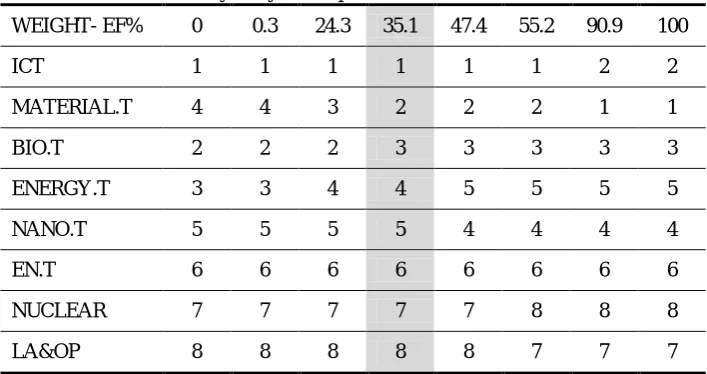
Table 6. Sensitivity analysis compared to economical criteria
100 90.9 55.2 47.4 35.1 24.3 0.3 0 WEIGHT- EF% 2 2 1 1 1 1 1 1 ICT 1 1 2 2 2 3 4 4 MATERIAL.T 3 3 3 3 3 2 2 2 BIO.T 5 5 5 5 4 4 3 3 ENERGY.T 4 4 4 4 5 5 5 5 NANO.T 6 6 6 6 6 6 6 6 EN.T 8 8 8 7 7 7 7 7 NUCLEAR 7 7 7 8 8 8 8 8 LA&OP
Table 7. Sensitivity analysis compared to environmental criteria
100 73.6 65.4 61 48.2 46.4 45.7 44.6 20.7 17.9 15.3 4.2 WEIGHT- E% 1 1 1 1 1 1 1 1 1 1 1 1 ICT 7 7 6 6 6 5 4 3 3 2 2 2 MATERIAL.T 3 3 3 3 2 2 2 2 2 3 3 3 BIO.T 5 5 5 4 4 4 3 4 4 4 4 4 ENERGY.T 4 4 4 5 5 6 6 6 5 5 5 5 NANO.T 2 2 2 2 3 3 5 5 6 6 6 7 EN.T 8 8 8 8 8 8 8 8 8 8 7 6 NUCLEAR 6 6 7 7 7 7 7 7 7 7 8 8 LA&OP
Table 8. Sensitivity analysis compared to resource criteria
149
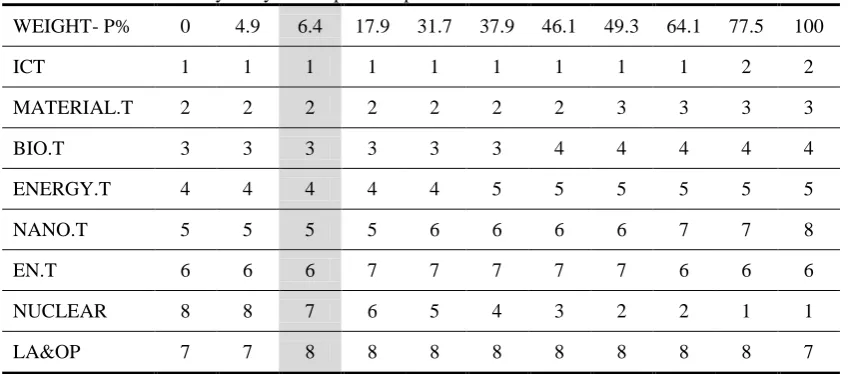
Table 9. Sensitivity analysis compared to political criteria
100 77.5 64.1 49.3 46.1 37.9 31.7 17.9 6.4 4.9 0 WEIGHT- P% 2 2 1 1 1 1 1 1 1 1 1 ICT 3 3 3 3 2 2 2 2 2 2 2 MATERIAL.T 4 4 4 4 4 3 3 3 3 3 3 BIO.T 5 5 5 5 5 5 4 4 4 4 4 ENERGY.T 8 7 7 6 6 6 6 5 5 5 5 NANO.T 6 6 6 7 7 7 7 7 6 6 6 EN.T 1 1 2 2 3 4 5 6 7 8 8 NUCLEAR 7 8 8 8 8 8 8 8 8 7 7 LA&OP
As can be inferred from the above tables, the most changes were observed in the ranks of material and bio-technology (the second and the third preferences) as well as nuclear technology and laser and optic technology (the seventh and the eighth preferences). The preferences of material and bio-technologies would frequently change in strategic, technical, economic and financial as well as resources accessibility attributes, while the preferences of nuclear and laser and optic technologies would frequently change in strategic, technical, environmental, resources accessibility as well as political attributes. It is also worth mentioning that the political attribute, just like the environmental attribute, failed to have stable contribution to the ranking process, so that the ranking process based on this attribute exhibited much more fluctuations rather than those based on other attributes.
4.4.
TOPSIS method
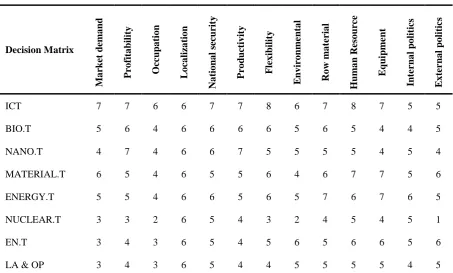
This technique considers m alternatives and n attributes in the form of m points distributed over a n-dimensional domain. Prioritization is started with the alternative at the minimum distance from the ideal solution (the best possible case) and the maximum distance from the ideal negative solution. The participators’ responds are combined using geometric averaging approach to form mixed group decision matrix (Table 9). This procedure is implemented via the following steps (Shirouyehzad, 2014):
Normalizing the decision matrix
First of all, the decision matrix should be translated into a harmonic dimensionless matrix.
Weighting the decision matrix
Harmonic decision matrix is calculated using entropy technique as well as the weighed vector obtained via DM in AHP method (Table 10)
Calculating the magnitude of the distance and relative closeness, Ai, to the ideal solution Determining the ideal positive solution, A+, and ideal negative solution, A-
150
Table 10. Decision Matrix
Table 11. Weighting to decision matrix
W’j M a rket dema nd P ro fit a bil it y O cc up a tio n L o ca liza tio n Na tio na l securit y P ro du ct iv it y F lex ibi lity E nv iro nm e nta l Ro w ma ter ia l H um a n Re so urce E qu ipm e nt Inte rna l po litic s E x ter na l po litic s
n j j j j j w w j W 1 . ' . 0 .3 3 4 0 .1 2 4 0 .0 7 3 0 0 .0 1 0 0 .0 9 8 0 .0 4 4 0 .1 6 7 0 .0 1 3 0 .0 0 5 0 .0 6 3 0 .0 0 7 0 .0 6 5Table 12. Positive & Negative ideal
A+ 0.2 0.1 0 0 0 0 0 0.1 0 0 0.03 0 0 A- 0.1 0 0 0 0 0 0 0 0 0 0.02 0 0
Decision Matrix M a rket dema nd P ro fit a bil it y O cc up a tio n L o ca liza tio n Na tio na l securit y P ro du ct iv it y F lex ibi lity E nv iro nm e nta l Ro w ma ter ia l H um a n Re so urce E qu ipm e nt Inte rna l po litic s E x ter na l po litic s
ICT 7 7 6 6 7 7 8 6 7 8 7 5 5
BIO.T 5 6 4 6 6 6 6 5 6 5 4 4 5
NANO.T 4 7 4 6 6 7 5 5 5 5 4 5 4
MATERIAL.T 6 5 4 6 5 5 6 4 6 7 7 5 6
ENERGY.T 5 5 4 6 6 5 6 5 7 6 7 6 5
NUCLEAR.T 3 3 2 6 5 4 3 2 4 5 4 5 1
EN.T 3 4 3 6 5 4 5 6 5 6 6 5 6
151
Table 13. Ranking alternatives
Cli W RANK
ICT 0.963 1
Bio 0.563 3
Nano 0.438 5
Material 0.668 2
Energy 0.548 4
Nuclear 0.004 8
Environmental 0.341 6
Laser & Optic 0.281 7
4.5.
SAW method
Just like the TOPSIS method, SAW method uses the decision matrix; however, the decision matrix here is formed by combining geometric averaging, respondents’ opinions and group decision matrix. This is one of the oldest methods employed in MADM, so that considering the vector W (attribute-based preferences obtained via entropy method in TOPSIS technique) the best alternative (A*) can be calculated as follows. This approach starts with translating the decision matrix into the harmonic dimensionless matrix.
It should be noted that this method determines the best alternative making no direct contribution into the ranking of the alternatives. However, once the best alternative was determined, one may form a new decision matrix by eliminating the best alternative followed by a new round of determination of weights vector and implementation of SAW method to come with the second best alternative. This can be repeated until all the technologies are ranked in order of preferences.
SAW method led to the following order of practicable technologies in the science and technology corridor of Isfahan:
1. Information and communication technology. 2. Material technology.
3. Bio-technology. 4. Energy technology. 5. Nano-technology.
6. Environmental technology. 7. Laser and Optic technology. 8. Nuclear technology.
5.
Conclusion
152
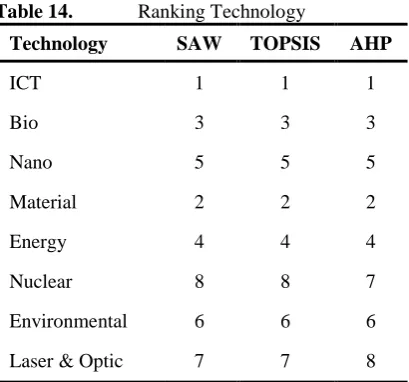
A difference is evident in the seventh and eighth preferences obtained by AHP method andthose of TOPSIS and SAW methods. Considering the obtained differences in the weights for the seventh and eighth preferences in AHP method and also taking sensitivity analysis into account which indicated high sensitivity of the seventh and eighth preferences to the weights of the attributes, it is suggested to use the results of TOPSIS and SAW methods for ranking the order of preferences of the practicable technologies within the science and technology corridor of Isfahan.
Table 14. Ranking Technology
AHP TOPSIS
SAW Technology
1 1
1 ICT
3 3
3 Bio
5 5
5 Nano
2 2
2 Material
4 4
4 Energy
7 8
8 Nuclear
6 6
6 Environmental
8 7
7 Laser & Optic
On the other hand, since the practicable technologies were divided into two categories of knowledge-based technologies and emphasized technologies at national and province levels, a gap was evident in the middle of the obtained order of preferences based on which one could distinguish between the first category (1st to 5th preferences), namely the knowledge-based technologies, and the second category (6th to 8th preferences), namely the emphasized technologies at national and province levels; this is another reason for the necessity of further developing and focusing on the knowledge-based economy in the country. Furthermore, investigating the ranks of the decision attributes (Figure 2) it is evident that the economic and financial attribute stands on top of other attributes; this contributes to comparative advantage of the science and technology corridor as it helps economic growth of the country, so that larger investments are required on this sector. On the other hand, the weight of human resources sub-attribute is significantly different from those of other sub-sub-attributes within the resources accessibility attribute, indicating the impact of human resources and significance of long-term planning in order to upgrade this sub-attribute. Regarding sub-attributes of domestic and foreign policies, it is worth mentioning that in spite of the fact that the nuclear technology achieved the eighth place within the ultimate ranking order, it enjoys much emphasize from the government, while in contrast, it was in the same eighth place (at the same significant difference) within the scope of the foreign policy, reflecting intense sanctions against Islamic Republic of Iran, so that it will be necessary for the government to set special policies in this regard.
6.
References
153
Alvani, M and Hamid, N, (2001), “Technology Development Model in Iran”, Journal ofManagement and Development, Vol. 10, No.5, PP. 4 – 9.
Anton, F. (2000), The Global Technology Revolution, Bio/Nano/ Materials trends, John Wiley, Paris.
Bayat, M. (2003), “Indices for Technology Selection and Transfer, the Technology”, College of Application, Vol. 4, No.2, PP. 12 – 15.
Chen, Ch, (2011), “Evaluating the development of high-tech industries: Taiwan’s science park”, Technological Forecasting and Social Change, Vol. 41, No.5, PP. 839-851. Chen, Ch, (2011), “Evaluating the development of high-tech industries: Taiwan’s science
park”, Technological Forecasting and Social Change, Vol. 73, No.2, PP. 452-465. Chung, M, (1999). “Technology selection for advanced public transportation systems in
Taiwan using scenario method Technological Forecasting and Social Change”,
Information & Management, Vol. 45, No.2, PP. 452-465.
Din Mohammadi, M., Del Angizan, S. and Sadeghi, Z. (2005), “Spatial Clustering of Hi-tech Industries and the Associated Spillways over Regional and National Labor Market”,
Journal of Engineering Research, Vol. 5, No.5, PP. 27 – 34.
Ghazi Noori, S, (2000), “Metrics for Evaluation of Technology”, Journal of Engineering Research, Vol. 2, No.1, PP. 7 – 9.
Ghodsi pur, H, (2001), Analytical hierarchy process, University of Amirkabir Pub.
Golestaneh, A, (2002), “The Development of Technology within the Context of Time”,
Proceedings on the Technology Development, Vol. 12, No.2, PP. 25-30.
Haj Fathaliha, A., Seyyed Esfahani, M, (1993), Technology Development, Allame Tababa’ei Pub.
Iran’s fifth Development Plan, (2007), National Management and Planning Organization. Iran’s 20-year Provision Plan, (2001), National Management and Planning Organization. Mahnak, K, (2003), Translated by Azarang, A., Technology Transfer – A Strategy for
Scientific Self-reliance of Middle Eastern Countries, Amir Kabir University of Technology Pub.
Mehregan, M, (2013), Multiple Attribute Decision-Makings, University of Tehran Pub. Ramanthan, K, (2001), Selecting Technology, Translated by: Zanjani, M, Jeddi, S., Journal of
Engineering Research.
Saxenian,A,(1994), “Technology And Industry Scoreboard Benchmarking Knowledge- Based Economy”, OECD Science, Vol. 1, No.4, PP.34-42.
Saxenian, A. (2005), “Bangalore:The Silicon Valley Of Asia”, Working Paper, Vol. I, No. 91, pp. 21-25.
Science and Technology Evaluation Code in Islamic Republic of Iran, (2003), Monitoring and Cultural and Scientific Evaluation Bureau of the Supreme Cultural Revolution Council. Shirouyehzad, H. and Tavakoli, M.M. (2014), Discussions on Multiple Attribute
Decision-Making Process, Danesh Pazhuhan Barin Scientific Institute Pub.
Va’ez Zadeh, S, (2004), “A Step toward a Native Pattern for the Evolution of Technology”,
Quarterly Journal of Technology Development, Vol. 12, No.11, PP. 25-31.
Yadollahi Farsi, J, (1995), Contributing Factors to Selecting Technologies for the Industries within the Fars Province, College of Management, Shiraz University, Scientific Reports, Vol 1, No.4, PP.26-38.