1. Introduction
Transportation is a service that is rarely demanded to execute its own purpose but it mainly to execute other objectives in any nation. Not only does transportation provides mobility for people and goods, it also helps shape an area’s economic health and quality of life. Because of the high pertinence of transportation, it is expedient for a country or nation to embark on integrating man, material, money, and machinery towards the realization of diversified modes of transport before such country can boast to have achieved a diversified economy and a sustainable development [1]. Transportation is a process that involves movement of commuters, goods, and services from a given point of origin to specific destination [2]. It affects every human being in the course of his daily activities and it is difficult to conceive a situation where transportation does not play a significant role in the life of any individual
Corresponding author
E-mail: [email protected]
DOI: 10.22105/jarie.2017.97899.1018
Understanding Econometric Modeling: Domestic Air Travel in
Nigeria and Implication for Planning Process
Adetayo Olaniyi Adeniran
1,
Sidiq Okwudili Ben
21Department of Transport Management Technology, Federal University of Technology, Akure, Nigeria. 2Department of Geography, College of Education, Ikere, Nigeria.
A B S T R A C T P A P E R I N F O
For planning process, this study examined the econometric model of domestic air travel in Nigeria vis-à-vis some selected economic variables. Furthermore, quantitative (inferential) statistics has used which relies on data obtained from relevant government institutions in Nigeria. In addition, the model was estimated using Ordinary Least Square (OLS) regression. From the estimate, the predictor variables constant revealed that Domestic Passenger demand is a negative value, which signifies that the predictors (economic variables) cannot give true estimate of the domestic airline forecast regardless of the positive regression coefficient for the predictors. On the other side, Domestic Passenger demand positively contributes to economic indicators. When validating the model estimate, test of significance revealed that, there is no statistically significant relationship between the variables. Based on the insignificance, the model estimate cannot give a good forecast. Test for multicollinearity revealed that the coefficient of determination (R2) is 0.805 which is greater than 0.8. This signifies that there is a problem of multicollinearity. Based on this problem, the model estimate cannot give a good forecast. Goodness of fit test revealed that 80.5% of the dependent variable, Domestic Passenger demand, could be explained by the independent variables. The regression value signifies that the model can give a true forecast. Finally, based on the issues of validation, it is therefore concluded that the model cannot give a true forecast, hence economic indicators contributes little or no to air transport demand but rather air transport demand contributes significantly to economic indicators.
Chronicle:
Received: 10 July 2017 Accepted:18 December 2017
Keywords :
Econometric Model. Air Transport Demand. Transportation.
Journal of Applied Research on Industrial
Engineering
[3]. Transportation helps us achieve the basic objectives of living in the city, which is the functional efficiency of land uses, infrastructures, services, and improvement in the quality of life. As a result of the importance, there is economic advantage. It has been affirmed that no transport organization can operate profitably unless there is a demand for its services and the estimation of expected future demands is a key element in planning transport operations [1]. Transportation as a system comprises of the following modes: Road transport; Air transport; Water transport; Pipeline transport, and Cable transport. For this study, air transport will be focused.
Civil Aviation, through a complicated interaction with other econometric sectors, benefits from and contributes to the economic development of all nations. As incomes and production level increase, the demand for aviation services expands. The role of air transport as a catalyst for general economic and social development due to the expedition and flexibility has been provided by the global air transport system. It has widened the markets for numerous types of products, and it has also promoted the exchange and interaction of ideas, professional experience and skills among the nations. Since the role of air transport increasingly gains importance in the economic development of countries and regions, and aviation is the leading edge of industry, it is important to take due account of the economic and social benefits, which an efficient air transport system can offer. To ensure that future air transport needs are properly assessed together with the associated financial and human resources that need to be provided [4].
The analysis of air travel demand is very essential to an airport for making decisions on capacity utilization and for designing airport facilities. Examining the relationship between economic variables and air travel demand (passenger demand) is very important for developing infrastructure facilities and passenger services at an airport in the future. Analysis of air passenger demand helps us identify the future requirements of such facilities. Economic indicators determine the passenger demand per route at a particular airport, region, or city. The most common economic indicators are Gross Domestic Product (GDP), GDP per capita, population (Pop), income, and income per capita. There are many studies addressing the relation between the air passenger demand with operating variables and/or economic indicators. Airlines must know these indicators to predict the behavior of the passenger demand, and then make decisions such as whether it is profitable to establish their hub in a particular airport or not [5].
The aim is to examine the relationship between domestic air travel demands and select economic indices. In other to achieve this, econometric model will be adopted. The null hypothesis of the study states that there is no statistical significant relationship between the % change in domestic air passenger traffic and the % change in economic indices. The select economic indicators are Consumer Price Index (Inflation), exchange rate (BDC), and real gross domestic product (GDP).
2. Literature Review
2.1. Drivers of Air Transport Demand
According to the airline passenger survey conducted by Airbus, it was revealed that the most prominent reasons of increasing desire to use air transportation listed by passengers in order of importance are:
I. Economic growth (especially in the emerging countries where wealth of citizens is increasing, and more people are able to benefit from aviation and to see more of the world). II. Increasing desire to spend holidays and free time abroad and in different places of home
country.
III. Globalization (leading people to migrate for working or living in different countries and cities).
IV. Time concerns (time is getting more and more valuable resulting in growing desire to take faster means of transport) [7].
It should be noted that the drivers of air transport demand might differ from country to country. It may depend not only on country’s economic and social background or geographic location and size, but also on some important events like economic downturns or deregulations that could decrease or boost the demand. Forecasting the future demand for air transportation and understanding determining factors are crucial in the aviation sector to form transport policies [8]. With the help of in-depth analysis of the key determinants, airports and airlines can develop their marketing strategies in order to increase the demand for their enterprise. They can decide whether to increase airport facilities, expand airline fleet and flight network according to the demand forecasts. Airports use forecasts to decide if further capacity increase is necessary and profitable.
From literature surveys conducted, it was revealed that in year 1994, there was on deficiency of inclusion of wealth variables in the demand models for air transportation [9]. In their research, the authors found that many time series studies have an autocorrelation problem in the errors term. The study mentioned that autocorrelation problem might be the result of model misspecification in previous studies as a result of the way income is represented. Therefore, they used permanent income instead of current income as a determinant of wealth of individual. Their model includes airfares, financial assets, non-financial assets, wage per employee, CPI as determinants of passenger demand. Notwithstanding the study tried to include percentage change in CPI, percentage change in GDP, family size, these variables appeared to have insignificant coefficients and were removed from the model.
sector, GDP of manufacturing sector, and GDP of electricity sector as independent variables. The analyses suggests a positive influence of air transport on economic growth, a long run equilibrium relationship and a causal unidirectional relations from air transport to economic growth. Their study is limited to Gross Domestic Product (GDP) to determine the relationship between economic growth and air transport. In that same year, Owoputi examined aviation industry development in Nigeria economy. His study emphasized the benefits of the air transport sector, which creates three distinct types of economic impact- contribution to GDP, jobs and tax revenues generated by the sector and its supply chain. The economic benefits relate to the passenger using the air transport service. Statistically, his study lacked testable fact to really examine the contributions of aviation industry development in Nigeria economy. In addition, the study relied on past-published data and was devoid of statistical analysis. In the year 2014, Muhammad et al. conducted a study on analysis of the economic benefits of Gombe International Airport in Nigeria [11]. The study was limited to the impact of air transport on GDP and employment creation. It was also limited Gombe International Airport. A more plausible result would be obtained if other economic variables were considered and conducted on the entire airports in Nigeria.
So far, limited researches have carefully examined domestic air transport demand in Nigeria. Several studies have been carried out in different countries. The studies would give a more plausible result if they were conducted in Nigeria. This might be as a result of socio-economic and political differences, level of development and other factors. Furthermore, some did not scientifically x-ray the relationship between the contributions of aviation industry and development of Nigeria economy. Finally, economic variables involved in some studies are limited. This study examines the relationship between some selected economic indicators: Gross Domestic Product (GDP), Consumer Price Index (CPI), and Exchange rate (BDC) in so far as they are inextricably linked to the performance of aviation sector and the creation of additional passenger and aircraft flows.
3. Methodology
This study is a quantitative (inferential) study and it relied on information and data obtained from relevant government institutions and agencies in Nigeria. The hypothesis will be tested using inferential statistics.
3.1. Study Area
Nigeria is located in the West Africa sub-region. It is bounded in the north by Niger Republic, south by Atlantic Ocean, east by Cameroon and Chad and west by Benin Republic. It is the most populous country in Africa. With respect to NPC, 2006, Nigeria accounted for more than 140 millions. By August 2011, it was estimated to be about 167 millions. Nigeria is located within the longitude 30E and 150E
and latitude 40N and 140N of the equator [12]. Presently, Nigeria has about twenty (20) functional
Fig1.
Bar chart domestic air passenger traffic in different airports in Nigeria from year 2010 to 2016.Table 1. The domestic air passenger traffic in Nigeria airport between year 2010 and year 2016 [13, 14].
AIRPORT
Passenger Traffic in Year 2010
Passenger Traffic in Year 2011
Passenger Traffic in Year 2012
Passenger Traffic in Year 2013
Passenger Traffic in Year 2014
Passenger Traffic in Year 2015
Passenger Traffic in Year 2016 Lagos 3,864,458 4,127,100 3,646,824 3,383,338 3,111,975 3,778,145 3,748,333 Abuja 3,361,107 3,624,862 2,904,491 3,116,634 3,274,986 3,375,823 3,344,164
Port
Harcourt 1,198,668 1,256,266 1,077,517 125,377 1,225,135 1,116,885 974,028
Kano 234,996 272,911 213,949 207,485 257,927 227,038 255,568
Enugu 0 301,744 211,225 217,031 291,023 310,558 340,692
Osubi 343,333 365,875 355,661 267,532 221,250 187,430 203,133
Kaduna 185,297 109,622 140,800 141,841 174,216 123,827 127,233
Calabar 281,556 152,930 205,676 197,470 203,844 189,907 202,780
Sokoto 60,425 69,805 67,238 30,663 100,078 84,338 77,867
Benin 348,906 323,554 222,027 230,347 227,896 126,224 197,690
Maiduguri 107,200 74,824 79,753 13,025 11,103 43,079 110,613
Jos 75,525 47,794 50,964 54,798 48,938 48,199 58,990
Owerri 476,063 384,016 265,082 1,094,929 338,943 313,343 369,802
Yola 108,547 83,222 199,926 9538 145,588 149,940 153,157
Ilorin 43,761 46,990 65,517 63,379 66,205 67,439 74,721
Ibadan 27,843 38,979 52,286 61,072 64,743 67,911 69,797
Minna 8,896 0 5,406 8,105 787,811 5,379 2,529
Akure 6,640 6,073 7,612 10,742 6,113 2,786 9,873
Katsina 8,773 5,937 2,381 8,980 2,189 3,314 3,576
Makurdi 11,731 10,711 1,525 5,029 907,638 876 278
From the Table 1 and Figure 1, it can be depicted that Lagos Airport, Abuja Airports are the major domestic Airports in Nigeria, based on the high number of domestic passenger movement. In addition, Port Harcourt Airport is also improving. These Airports in Nigeria have contributed significantly to the economic development in Nigeria. From the Table 2, the highest number of domestic air passenger movement was recorded in the year 2014.
3.2. Steps Involved in Econometric Dynamic Model
3.2.1. Formulate or Specify the Appropriate Model
When formulating the model, mathematical model will be formulated before the econometric model. Without the mathematical model, there cannot be an econometric model. The difference between the mathematical model and the econometric model is the inclusion of stochastic disturbance term, otherwise known as unexplained variables or error term in the econometric model.
Mathematical model:
DOMPAX = α + β1(CPI%) + β2(BDC%) + β3(GDP%) Econometric model:
DOMPAX = α + β1(CPI%) + β2(BDC%) + β3(GDP%) + Ui, where
DOMPAX = Domestic Passenger Traffic (Dependent variable),
CPI% = Percentage change in Consumer Price Index or Inflation,
BDC% = Percentage change in Exchange rate Bureau de Change,
GDP% = Percentage change in Gross Domestic Product,
CPI%, BDC% and GDP% are independent variables. α = Intercept.
β1, β2, β3= Parameters.
Ui = Stochastic disturbance term or unexplained variables or error term which captures other economic indicators influencing domestic air travel demand in Nigeria.
Table 2. Relationship between % changes in domestic air passenger traffic and % change in economic [13, 14].
Year Number of Passengers % change 2010 10,753,725
2011 11,303,215 5.11
2012 9,770,453 -13.56
2013 9,159,612 -6.25
2014 11,447,601 24.98
2015 10,222,441 -10.70
2016 10,971,608 7.33
Table 3. Data collected for the specified model (% change in domestic air passenger traffic (annual), % change in Consumer Price Inflation (CPI), % change in Naira Value to Dollar (BDC) and % change
real Gross Domestic Product (GDP)). YEAR % Change Domestic
Air Passenger Traffic
% Change Consumer Inflation Price (CPI)
% Change Naira Value To Dollar (BDC)
% Change Real Gross Domestic Product (GDP)
2011 5.1 3.2 4.1 5.31
2012 -13.6 2.1 1.0 4.21
2013 -6.3 1.5 1.0 5.49
2014 25.0 1.6 5.5 6.22
2015 -10.7 0.1 30.0 2.79
2016 7.3 1.3 67.4 -1.51
3.2.2. Collect the Appropriate Data in Line with the Already Specified Model
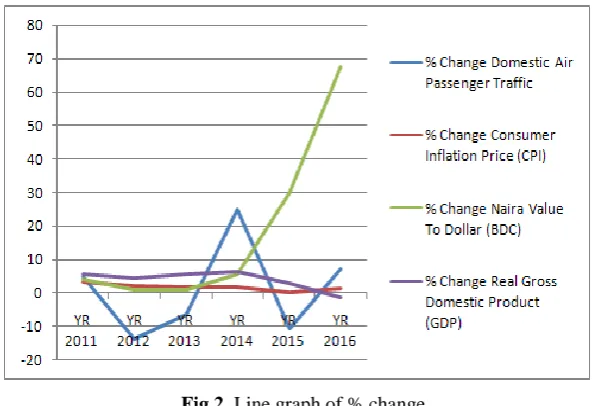
affirmed that there is little or no relationship between the economic variables and domestic air transport in the country, which is because the lines were not trended in the same direction.
Fig 2. Line graph of % change.
3.2.3. Estimating of the Model to Enhance Satisfaction and Reliability of the Model
To estimate econometric model, the use of Ordinary Least Square (OLS) regression will be adopted in order to see the differences between the true line and the observed line (error or residual). Ordinary Least Square (OLS) regression, which is also referred to as regression, is a constructive and functional parametric tool that is majorly for examining the relationship between two or more variables (dependent and independent variables). It should be noted that the data type must be either interval scale of measurement or ratio scale of measurement, and the statistics involved would be inferential in nature. Ordinary Least Square (OLS) regression assumes that there is a linear relationship between the two or more variables, if the relationship is not linear, OLS regression will not be the ideal tool for analysis, or modifications to the variables may be required. The basic idea of linear regression is that, if there is a linear relationship between two variables, one variable can be used to predict or forecast the values of the other variable.
The econometric specified model:
DOMPAX = α + β1(CPI%) + β2(BDC%) + β3(GDP%) : True line.
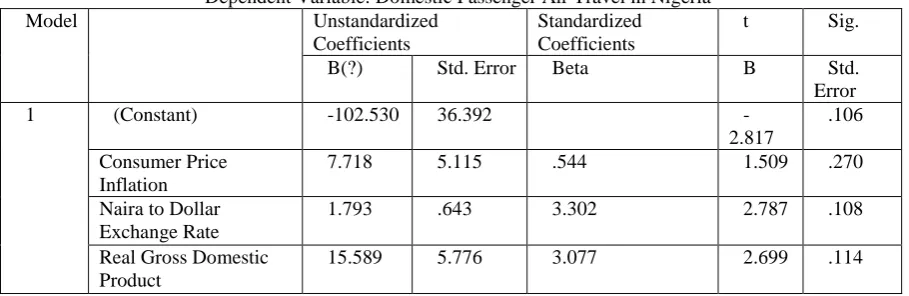
The coefficients estimate of the regression model for the true line is: DOMPAX = -102.530 + 7.718(CPI%)
+ 1.793(BDC%) + 15.589(GDP%).
DOMPAX = α + β1(CPI%) + β2(BDC%) + β3(GDP%) + Ui : Observed line.
The coefficients estimate of the regression model for the observed line is: DOMPAX = -102.530 +
7.718(CPI%) + 1.793(BDC%) + 15.589(GDP%) + Ui.
Table 4. Model summary.
(Predictors or independent variables are Real Gross Domestic Product, Consumer Price Inflation, and Naira to Dollar Exchange Rate). Model R R Square Adjusted R Square Std. Error of the Estimate
Table 5. Analysis of variance.
(Predictors or independent variables are Real Gross Domestic Product, Consumer Price Inflation, and Naira to Dollar Exchange Rate. The dependent variable is Domestic Passenger Air Travel in Nigeria).
Model Sum of Squares Df Mean Square F Sig.
1 Regression 833.675 3 277.892 2.751 .278(a)
Residual 202.058 2 101.029
Total 1035.733 5
Table 6. Value of Coefficients.
Dependent Variable: Domestic Passenger Air Travel in Nigeria
Model Unstandardized
Coefficients
Standardized Coefficients
t Sig.
B(?) Std. Error Beta B Std.
Error
1 (Constant) -102.530 36.392
-2.817
.106
Consumer Price Inflation
7.718 5.115 .544 1.509 .270
Naira to Dollar Exchange Rate
1.793 .643 3.302 2.787 .108
Real Gross Domestic Product
15.589 5.776 3.077 2.699 .114
Given all the predictor variables constant at zero (0), Domestic Passenger demand will be -102.530. This negative value signifies that the predictors cannot give true estimate of the forecast regardless of the positive regression coefficient for the predictors. On the other side, the regression coefficient for Consumer Price Index is 7.718. This means that Domestic Passenger demand positively contributes to Consumer Price Index. In addition, the regression coefficient for Exchange rate is 1.793. This means that Domestic Passenger demand positively contributes to Exchange rate. Finally, the regression coefficient for Real Gross Domestic Product is 15.598. This means that Domestic Passenger demand positively contributes to Real Gross Domestic Product.
3.2.4. Examine the Validity of the Model to Enhance a True and Genuine Forecast.
Validity of the model can be done through the following: a) Test of significance:
They further state that parametric tests usually assume certain properties of the parent population from which we draw samples. Assumptions like observations come from a normal population, sample size is large, assumptions about the population parameters like mean, proportions, variance, etc., must hold good before parametric tests can be used. A common example of parametric test is regression analysis. However, there are situations where the researcher cannot or does not want to make such assumptions, in such situations, statistical methods are used for testing hypotheses, which are called non-parametric tests because such tests do not depend on any assumption about the parameters of the parent population. Besides, most non-parametric tests assume only nominal or ordinal data, whereas parametric tests require measurement equivalent to at least an interval or ratio scale. Common examples of the non-parametric tests are Chi-square and Charles Spearman’s coefficient of correlation test [15]. In addition, common examples of parametric tests are regression analysis and Karl Pearson’s coefficient of correlation. In addition, common examples of parametric tests are regression analysis and Karl Pearson’s coefficient of correlation.
For more emphasis, this paper critically examines parametric test. Parametric test is best applicable for quantitative technique, based on inferential statistics, meanwhile the sampling must be probabilistic in nature, and the data type or data scale must be interval or ratio scale of measurement. On the other side, nonparametric test is best applicable for qualitative technique, based on descriptive statistics, meanwhile the sampling must be non-probabilistic in nature and the data type, or data scale must be ordinal or nominal scale of measurement. If this rules are not properly followed or the researcher fails to abide with the guidelines, the result of the research survey analysis will give a spurious or nonsense or problematic output which will be misleading. The explanation will be depicted in Table 7.
Table7. Summary of statistical guidelines. Scale of
Measurement
Sampling or Data Collection
Statistics Technique Test Analysis
Interval Probability Inferential Quantitative Parametric Regression analysis, Karl Pearson’s
coefficient of correlation Ratio Probability Inferential Quantitative Parametric Regression analysis,
Karl Pearson’s coefficient of
correlation
Nominal
Non-probability
Descriptive Qualitative Non-parametric
Chi-square, Charles Spearman’s coefficient
of correlation
Ordinal
Non-probability
Descriptive Qualitative Non-parametric
Chi-square, Charles Spearman’s coefficient
of correlation
The steps involved in hypothesis testing
i. Stating the hypothesis. Null Hypothesis H0: There is no statistical significant relationship
between % change of domestic air passenger travel demand and % change in the select economic indicators. Alternate Hypothesis H1: There is statistical significant relationship
between % change of domestic air passenger travel demand and % change in the select economic indicators.
iii.
Computing the test statistics using the parametric test. From the computed test statistics,
determine the significance level. As shown in Table 4, the significance level of the
computed test is 0.278.
iv.
Stating the decision rule. The decision rule for the computed test states that if the
significance level of the computed test statistics is less than the critical region
(significance level) that is set by the researcher (0.05), the Null Hypothesis will be
rejected and the Alternate Hypothesis will be affirmed. However, if the significance
level of the computed test statistics is more than the critical region (0.05), the Null
Hypothesis cannot be rejected but the Alternate Hypothesis will be rejected.
v.
Concluding the test based on the decision rule earlier stated. The significance level of
the computed test is 0.278, and the chosen critical region or significance level is 0.05.
When comparing the computed test statistics to the significance level, the computed test
statistics (0.278) is more than the significance level (0.05), hence the Null Hypothesis
of the study cannot be rejected. This is a basis for not rejecting the Null Hypotheses,
which states that there is no statistical significant relationship between % change of
domestic air passenger travel demand and % change in the select economic indicators.
Based on the insignificance, the model estimate cannot give a good forecast.
b)
Test for multicollinearity
For a model that has more than one qualitative variable, as in this study, problems of
multicollinearity can arise. In addition, since data are non-experimental, many explanatory
variables tend to move together meaning that they may be collinear [16]. When two variables
are highly or near perfectly correlated, their variances tend to infinity and as a result, hypothesis
testing becomes weak so that diverse hypothesis parameter values cannot be rejected [14].
Standard errors and overall coefficient of determination may be used for testing for
multicollinearity. [17] It is stated that if the coefficient of determination (R
2) is greater than
0.8, there is a high correlation among variables, and then multicollinearity is suspected. In this
study, the coefficient of determination (R
2) is 0.805 which is greater than 0.8. This signifies
that there is a problem of multicollinearity. Based on this problem, the estimated model cannot
give a good forecast.
c)
Goodness of fit test
The goodness of fit test can be referred to as the summary of statistics, which indicates the
precision, and appropriateness of the estimated model. It is also referred to as the regression
proper. The regression value or the explained variable is 833.675 and the unexplained variable
or error term is 202.058, and the total variable is 1035.733. Further, the analysis revealed that
R
2=
1035.733833.675,
R
2= 0.805 as shown in Table 4.
4. Conclusions
References
[1] Adeniran, A. O. & Adeniran, A. A. (2017). Econometric Modeling of Passenger Demand for International Air Transport in Nigeria Airports. American journal of traffic and transportation engineering,2(4), 39- 44.doi: 10.11648/j.ajtte.20170204.11
[2] Asiyanbola, R. A., & Akinpelu, A. A. (2012). The challenges of on-street parking in Nigerian Cities’ transportation routes. International journal of development and sustainability, 1(2), 476-489. [3] Gbadamosi, K. T. (2002). Traffic regulations and road traffic accidents in Nigeria–A spatial analysis
(Unpublished PhD dissertation). Ibadan: University of Ibadan.
[4] Ahmadzade, F. (2010, January). Model for forecasting passenger of airport. Proceedings of the 2010 international conference on industrial engineering and operations management. 9-10. Dhaka, Bangladesh January.
[5] [5]. Carmona-Benitez, R. B. (2012). The design of a large scale airline network. thesis(Delft University of Technology). Thesis Series T 2012/2, Delft.
[6] Smith, M. J. (2002). The airline encyclopedia, 1909-2000. Lanham, MD: Scarecrow Press. [7] Leahy, J. (2011). Delivering the future: Global market forecast. Retrieved from:
www.team.aero/.../Airbus_GMF_2011-2030_delivering_the_future_-_press_conferen...
[8] Dargay, J., & Hanly, M. (2001). The determinants of the demand for international air travel to and from the UK. ESRC transport studies unit, centre for transport studies. University College: London. [9] Alperovich, G., & Machnes, Y. (1994). The role of wealth in the demand for international air
travel. Journal of transport economics and policy, 163-173.
[10] Saheed, A. A. A., & Iluno, S. Z. C. (2015). Air Transportation Development and Economic Growth in Nigeria. Journal of economics and sustainable development, 6(2).
[11] Isma’il, M., Musa, I. J., Daniel, D., Musa, I., & Adamu, G. (2014). Analysis of the economic benefits of gombe international airport in Nigeria. Global journal of research and review, 1(3).
[12] Afolayan, O. S., Asaju, A. J., & Malik, N. A. (2012). Variation in spatial trend of passengers and aircrafts movement in Nigerian international airports. International journal of humanities and social science, 2 (10), 126-133.
[13] Nigeria air passenger traffic. (2016). Retrieved from https://nairametrics.com/ [14] National bureau of statistics. (2017). Retrieved from http://www.nigerianstat.gov.ng/
[15] Adeniran, A. O., Adekunle, E. A., & Oyedele, O. J. (2017).Establishing the concept of research hypothesis through the relationship between demand in Nigeria international air passenger traffic and economic variables. International journal of economic behavior and organization,5(5), 105-113. [16] Gujarati, D. N. (2003). Basic Econometrics Fourth Edition McGraw Hill Gujarati, DN, (2003). Basic
Econometrics.
[17] Greene, W. H. (2003). Econometric analysis. Pearson Education India.
![Table 1. The domestic air passenger traffic in Nigeria airport between year 2010 and year 2016 [13, 14]](https://thumb-us.123doks.com/thumbv2/123dok_us/8579256.1718535/5.595.131.472.53.258/table-domestic-passenger-traffic-nigeria-airport-year-year.webp)